

Summary
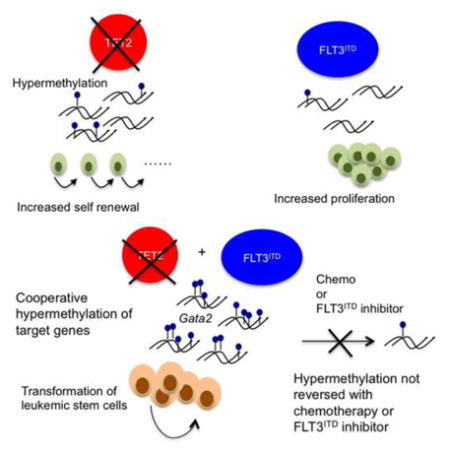
Specific combinations of Acute Myeloid Leukemia (AML) disease alleles, including FLT3 and TET2 mutations, confer distinct biologic features and adverse outcome. We generated mice with mutations in Tet2 and Flt3, which resulted in fully penetrant, lethal AML. Multipotent Tet2−/−;Flt3ITD progenitors (LSK CD48+CD150−) propagate disease in secondary recipients and were refractory to standard AML chemotherapy and FLT3-targeted therapy. Flt3ITD mutations and Tet2 loss cooperatively remodeled DNA methylation and gene expression to an extent not seen with either mutant allele alone, including at the Gata2 locus. Re-expression of Gata2 induced differentiation in AML stem cells and attenuated leukemogenesis. TET2 and FLT3 mutations cooperatively induce AML, with a defined leukemia stem cell population characterized by site-specific changes in DNA methylation and gene expression.
Keywords: Epigenetics, AML, TET2, FLT3
Graphical abstract
Introduction
Acute Myeloid Leukemia (AML) is the most common acute leukemia in adults; unfortunately, most patients relapse and develop resistance to anti-leukemic therapies. Next-generation sequencing has been used to characterize the AML genome and to identify somatic disease alleles (CGARN, 2013; Welch et al., 2012). Analysis carried out in large AML cohorts have shown that these disease alleles and their combination can be used to improved prognostic schema (Hou et al., 2014; Patel et al., 2012). Recent studies have also demonstrated the biologic and clinical relevance of these alleles, including TET2, a gene targeted by mutations in 10–20% of AML patients (Abdel-Wahab et al., 2009; Delhommeau et al., 2009; Langemeijer et al., 2009).
TET2 mutations are associated with reduced response of AML to chemotherapy and adverse overall survival (Metzeler et al., 2011). In particular, TET2 mutations are associated with adverse outcome in the setting of concurrent FLT3ITD mutations (Hou et al., 2014; Patel et al., 2012), suggesting these mutations cooperate to induce a poor-prognosis subtype. Mutations in TET2 lead to loss of function and are often present as heterozygous mutations, although a subset of patients have bi-allelic TET2 loss (CGARN, 2013; Langemeijer et al., 2009). TET2 catalyzes the 5-hydroxylation of methylcytosine to 5-hydroxymethylcytosine (5-hmC) leading to DNA demethylation (Guo et al., 2011; Tahiliani et al., 2009). TET2 mutant AML is characterized by reduced 5-hmC levels, increased DNA methylation, and epigenetic silencing (Figueroa et al., 2010; Ko et al., 2010; Rampal et al., 2014). In addition, mutations in IDH1 and IDH2 inhibit TET2 function through production of 2-hydroxyglutarate (Figueroa et al., 2010), and WT1 mutations lead to reduced TET2 function and reductions in 5-hmC (Rampal et al., 2014). Collectively, the TET2 hydroxymethylation pathway is altered by somatic mutations in 25–35% of AML and also in other hematologic and epithelial malignancies.
TET2 regulates hematopoietic stem cell self-renewal. In mouse models, conditional loss of Tet2 in the hematopoietic compartment leads to expansion of stem cells (LSK, lin−Sca+cKit+) and increased repopulation ability in competitive transplantation (Li et al., 2011; Moran-Crusio et al., 2011; Quivoron et al., 2011). Tet2 mutant mice develop a chronic myeloproliferative disease that does not consistently progress to AML. In the human context, acquired mutations in TET2 and in genes encoding other epigenetic modifiers (e.g. DNMT3A, ASXL1) are observed in subjects with clonal hematopoiesis without evidence of an overt hematologic malignancy (Busque et al., 2012; Xie et al., 2014). Analysis of AML and normal subjects suggests mutations in TET2 and in epigenetic regulators can represent early acquired mutations in “pre-leukemic” stem cells which subsequently acquire further mutations leading to overt transformation (Genovese et al., 2014; Jaiswal et al., 2014; Jan et al., 2012). These data indicate that TET2 inactivation can contribute to leukemia initiation but is not sufficient to induce transformation to AML.
Flt3ITD mutations are found in nearly 30% of AML and commonly co-occur with IDH1, IDH2, and TET2 mutations (Patel et al., 2012). The co-occurrence of FLT3ITD and TET2 mutations implies these two alleles likely function together to induce transformation. Previous studies have suggested that AML disease alleles cooperate by altering distinct biological mechanisms, classified broadly as those acting on proliferation or on hematopoietic differentiation (Gilliland and Griffin, 2002). However, there are additional possibilities, including the potential for specific combinations of disease alleles to coordinately dysregulate the expression of target loci. This can occur through gain-of-function effects resulting in distinct epigenetic states with a correspondingly altered transcriptional output. Here we investigate loss of Tet2 together with Flt3ITD in AML development and specifically how they interact to affect transcriptional and epigenetic changes.
Results
Tet2 loss or haploinsufficiency combined with Flt3ITD results in AML in vivo
To determine the functional significance of TET2 and FLT3ITD mutations in AML, we generated mice harboring both mutations. Conditional Vav-cre+Tet2fl/fl (VTet2−/−) mice were crossed to the constitutive knock-in Flt3ITD murine model (Lee et al., 2005) to generate Vav-cre+Tet2fl/fl;Flt3ITD (VTet2−/−Flt3ITD) mice. VTet2−/−Flt3ITD mice were viable at birth with no gross abnormalities; however, all mice expressing both disease alleles developed a lethal hematopoietic disease with a median survival of 36.7 weeks (Figure 1A). The survival of VTet2−/−Flt3ITD mice was significantly reduced compare to mice expressing either disease allele alone (VTet2−/−, Flt3ITD median survival >80 weeks, p<.0001). After more than one year median follow-up, no Flt3ITD mice developed leukemia and less than 30% of VTet2−/− mice died, due to progressive myeloproliferative neoplasms (MPNs) and not AML. In addition, mice with Tet2 haploinsufficiency and Flt3ITD developed a similar phenotype as VTet2−/−Flt3ITD mice with median survival of 51 weeks (Figure 1A). We performed further analysis at 4 months when VTet2−/−Flt3ITD mice had evidence of leukemia. VTet2−/−Flt3ITD mice showed marked leukocytosis with a median white count of 35.8 k/μl (Figure 1B and S1A). At the time of sacrifice for advanced disease, they developed progressive anemia (median Hct 33.6%, p<.05) which was not observed in mice expressing either disease allele alone (median Hct 40%–51%) (Figure 1C). Analysis of the peripheral blood revealed increased Mac1+ cells consistent with myeloid expansion, as well as an expanded cKit+ population, and on peripheral smear leukocytes exhibited blast-like morphology with enlarged, open nuclei (Figure 1D, 1E, & S1B).
Figure 1. Development of leukemic disease in VTet2−/−Flt3ITDmice.

(A) Kaplan Meir survival curve of Tet2−/− (n=19), Flt3ITD (n=23), Tet2+/−;Flt3ITD (n=26), and Tet2−/−;Flt3ITD (n=28). (B–D) Peripheral WBC count at 4 months (B), hematocrit at 4 months and at time of sacrifice (C), and peripheral blood Mac1 and cKit immunophenotype at 4 months (D), mean Mac1+ and cKit+ (n=5 to 12 per group). (E) Peripheral blood morphology in Tet2−/−;Flt3ITD mice. scale bar 10 μm. (F) Spleen weight at 4 months. (G) Histology of bone marrow, lung, liver and spleen of WT, Tet2−/−, Flt3ITD, Tet2−/−;Flt3ITD mice. Scale bar 100 μm bone marrow, lung, and liver; 200 μm spleen. Green arrowheads indicate megakaryocytes. (H) Bone marrow CD71 and Ter119 immunophenotype, gates mean (n=4 to 6 per genotype). (I) Serial plating in methylcellulose and colony counts (representative experiment of n=3). +p<=.05, *p<=.01, **p<=.001, ***p<=.0001. Survival statistics using long-rank test. Otherwise, p values using unpaired Student’s t-test. Graphs mean±SEM. See also Figure S1.
VTet2−/−Flt3ITD mice were characterized by marked splenomegaly (mean 483 mg, p<.05; Tet2−/− 145 mg, Flt3ITD 167 mg, WT 86 mg) and hepatomegaly (Figure 1F & S1C). We observed infiltration of the bone marrow by a monomorphic leukemic population with a decrease in the fraction of mature hematopoietic (lineage+) cells and, by morphology, the number of megakaryocytes (Figure 1G & S1D). There was complete loss of splenic architecture, including germinal centers along with splenic myeloid expansion (Figure 1G & S1E). Similar findings were observed in the lung and liver, with infiltration of leukemic cells in the alveolar and periportal regions (Figure 1G). There was loss of CD71+Ter119+ erythroid progenitors in the bone marrow consistent with impaired erythroid differentiation (Figure 1H & S1F). As previously reported for Flt3ITD induced disease, phospho-STAT5 levels are elevated in VTet2−/−Flt3ITD cells compared to wild-type (Figure S1G). To test whether VTet2−/−Flt3ITD bone marrow cells had a transformed phenotype in vitro, we performed methylcellulose re-plating. Wild-type and Flt3ITD cells did not re-plate after three rounds, but Tet2−/− and Tet2−/−;Flt3ITD cells both continued to form colonies for 5 rounds of plating, demonstrating Tet2 loss increases in vitro self-renewal potential in the presence and absence of Flt3ITD (Figure 1I). We also performed whole exome sequencing on three VTet2−/−Flt3ITD leukemias but did not identify any recurrent mutations in leukemia disease alleles (Figure S1H). These data indicate that Tet2 loss combined with Flt3ITD is sufficient to induce AML in vivo.
Tet2 loss and Flt3ITD expression results in altered hematopoietic differentiation
Given the known role of Tet2 in regulating stem cell differentiation, we analyzed stem and progenitor compartments in VTet2−/−Flt3ITD mice at 4 months. VTet2−/−Flt3ITD mice had a significantly higher percentage of Granulocyte-Macrophage Progenitors (GMPs, lin−cKit+Sca-1−FcγR+CD34+) (mean, % of lin− 80%, p<.0001) compared to wild-type (27%) or VTet2−/− mice (32%), while Flt3ITD mice also had an increased GMPs (63%) (Figure 2A & S2A). We observed a significant increase in the absolute number of GMPs in VTet2−/−Flt3ITD mice compared to wild-type or VTet2−/− mice (Figure 2B). The increase in the frequency of GMPs was associated with a decrease in the Common Myeloid Progenitor (CMP, lin−cKit+Sca-1−FcγR−CD34+) and Mega-Erythroid Progenitor (MEP, lin−cKit+Sca-1−FcγR−CD34−) populations. The frequency of LSKs was not increased in VTet2−/−Flt3ITD mice within the lineage− fraction (Figure 2C); however, we noted a significant expansion in the absolute number of LSK cells (mean, 4.1×10⁵ LSKs/mouse vs 0.74×10⁵ WT, 1.8×10⁵ VTet2−/−, 2.1×10⁵ Flt3ITD, p<.05) due to marked expansion of the lineage− population (Figure 2D & S1D). These data demonstrate that the combination of Tet2 loss and Flt3ITD expression results in synergistic alterations in stem and progenitor cells not seen with either mutant disease allele alone, with expansion of the LSK and GMP populations.
Figure 2. Stem-progenitor immunophenotype and transplantability of VTet2−/−Flt3ITDmice.

(A,B) Relative frequency of CMP, GMP, and MEP progenitors in the lin−Sca−cKit+ cell fraction (A) and absolute GMP cell number (B) in bone marrow. (C,D) Relative frequency (C) and absolute cell number (D) of LSK cells in lin− bone marrow (n=4 to 6). (E–G) Analysis of transplanted mice. Peripheral blood CD45.1 (host-derived marker) and CD45.2 (leukemia-derived marker) immunophenotype (E), representative spleen size (millimeter scale) (F), and representative peripheral blood Mac1 and cKit immunophenotype (G) of CD45.1+ recipient mice transplanted with CD45.2+ Tet2−/−;Flt3ITD LSK or GMP cells (n=4 per group). (H) Flow plot of bone marrow LSK cells for MPP (CD48+CD150−) and LT-HSC (CD48−CD150+) frequency in WT and VTet2−/−Flt3ITD mice, gate mean±SEM (n=4). (I) Re-plating colony counts of WT and Tet2−/− cells sorted for LSK and GMP populations (representative experiment from 3 replicates). (J) TET2;FLT3ITD mutant human AML and normal subject ST-HSC/MPP frequency (n=9). +p<=.05, *p<=.01, ** p<=.001, ***p<=.0001. p values using unpaired Student’s t-test. Graphs mean±SEM. See also Figure S2.
LSK cells and not GMP cells are leukemia initiating cells in VTet2−/−Flt3ITD mice
Transplantation studies of human leukemias demonstrated that leukemia initiating capacity is highest in CD34+CD38− stem cells (Bonnet and Dick, 1997). More recent studies have suggested that leukemic stem cell (LSC) activity can also be detected in committed myeloid progenitors (Kirstetter et al., 2008; Sarry et al., 2011). In the murine context, transplantation studies using MLL-fusion leukemia models have shown that GMPs can serve as LSCs, with acquisition of self-renewal by committed progenitors (Heuser et al., 2011; Krivtsov et al., 2006). Since both the LSK and GMP populations are expanded in VTet2−/−Flt3ITD mice, we sought to determine if either population had leukemia initiating capacity. LSK and GMP cells were sorted from bone marrow of CD45.2 VTet2−/−Flt3ITD mice and transplanted into CD45.1 recipient mice. Mice transplanted with LSK cells but not GMP cells had progressive expansion of the CD45.2 donor population (Figure 2E & S2B). LSK transplanted mice developed disease similar in phenotype to primary mice, with splenomegaly, expansion of cKit+ blasts, and similar stem and progenitor frequencies in the bone marrow re-establishing the leukemic hierarchy (Figure 2F, 2G, & S2C). These data demonstrate the LSK, but not the GMP, population has leukemic initiating potential.
The LSK population in VTet2−/−Flt3ITD mice displayed a monomorphic immunophenotype consistent with selective expansion of the multipotent progenitor (MPP) population (LSK CD48+CD150−) (mean % of LSK 91% vs WT 59%, p<.001) (Figure 2H & S2D). By contrast, we observed near-complete loss of the long-term HSCs (LT-HSC) (LSK CD48−CD150+) population (mean % of LSK 0.04% vs WT 8.2%, p<.01) (Figure 2H & S2D–F). The frequencies of these populations were also different from single mutant mice, and maintained in secondarily transplanted mice (Figure S2D and S2E). Secondary transplantation of sorted MPPs resulted in leukemic engraftment similar to that observed with sorted LSKs (Figure S2G and S2H). Thus, the MPP population, which is normally more limited in self-renewal capacity, acquires self-renewal and LSC potential with Tet2 and Flt3 mutations.
The observation that LSKs, but not GMPs, could initiate leukemia in secondary recipients suggested that Tet2 loss could increase the self-renewal of LSKs but not of more committed myeloid progenitors. Because the acquisition of serial re-plating potential is due to Tet2 loss and not dependent on Flt3ITD, we investigated the impact of Tet2 loss on LSK and GMP cells in methylcellulose assays (Figure 2I). Tet2−/− LSK cells had serial re-plating potential, whereas Tet2−/− GMP cells did not persist beyond the third plating. This supports the observation that LSK and not GMP derived cells are transformed by loss of Tet2, and that the self-renewal program induced by Tet2 loss is able to transform early stem-progenitors, but not more committed populations. This is in contrast to MLL-fusion driven leukemia, which is capable of transforming GMPs to LSCs in vivo.
We next sought to determine stem and progenitor frequencies in AML patients with concurrent TET2 and FLT3ITD mutations (n=9). TET2;FLT3ITD mutant AML patients were characterized by a marked expansion in the proportion of ST-HSC/MPPs but variable numbers in the proportion of LT-HSCs and GMPs (Figure 2J, S2I–P). We also observed a significant reduction in the proportion of CMPs (Figure S2K). Mutational analysis of sorted populations (n=6) showed that TET2 mutations were seen in LT-HSCs, ST-HSCs/MPPs, CMPs and GMPs, suggesting that TET2 mutations are acquired in hematopoietic stem cells (Figure S2Q). FLT3ITD was also detectable in all these populations; however, they tended to be present at a lower allelic burden than the TET2 mutation (Figure S2Q). This is in agreement with the model in which TET2 mutations lead to pre-leukemic clones that with additional mutations progress to AML and expand specific subpopulations (Jan et al., 2012). In addition, these data support the notion that the expansion of ST-HSC/MPPs in TET2;FLT3ITD mutant AML is not due to selective acquisition of these mutations in this compartment but rather due to clonal expansion of specific populations in TET2;FLT3ITD mutant AML.
VTet2−/−Flt3ITD AML is refractory to chemotherapy
In order to assess the impact of anti-leukemic therapies on VTet2−/−Flt3ITD AML cells compared to normal hematopoietic cells, we tested the therapeutic efficacy of doxorubicin and cytarabine in CD45.1 mice transplanted with CD45.2 VTet2−/−Flt3ITD AML cells (n=5 per group). Mice were treated with vehicle or doxorubicin and cytarabine for 5 to 7 days followed by assessment of disease burden (Figure 3A). Induction chemotherapy with doxorubicin and cytarabine induced pancytopenia with a similar severity and kinetic as observed with induction therapy in human AML (Figure S3A). This therapy was effective in reducing and in some cases eliminating the leukemic clone in AML1-ETO driven leukemias, consistent with previous reports (Figure S3B–G) (Zuber et al., 2009). In VTet2−/−Flt3ITD disease, chemotherapy resulted in a transient decrease in the proportion of AML (CD45.2) cells; however by 4 weeks all mice again developed marked leukocytosis (Figure 3B). Furthermore with recovery from pancytopenia, the AML clone had expanded and there was no reduction in splenomegaly (Figure 3C & S3H). Thus, VTet2−/−Flt3ITD AML is chemoresistant relative to other, sensitive AML genotypes.
Figure 3. Response of VTet2−/−Flt3ITD leukemia to AC220 and chemotherapy.

(A) Treatment scheme with secondary transplanted CD45.2+ Tet2−/−;Flt3ITD bone marrow into CD45.1+ mice (n=5 per group). (B–D) Peripheral blood WBC count after treatment for 4 weeks (B), CD45.1 (host-derived marker) and CD45.2 (leukemia-derived marker) immunophenotype at 2 weeks and 4 weeks (C), and Mac1 and cKit immunophenotype at 4 weeks (D) of vehicle, chemotherapy treated, and AC220 treated mice. (E,F) Spleen size (E) and peripheral blood WBC count (F) of VTet2−/−Flt3ITD mice treated with AC220 for 4 weeks (n=3 per group). (G–I) Bone marrow myeloid progenitor analysis (G), LSK percentage and absolute number (H), and SLAM LSK immunophenotype analysis, gates indicated for MPPs (CD48+CD150−) and LT-HSC (CD48−CD150+) fractions (I) following vehicle, chemotherapy, or AC220 treatment. +p<=.05, *p<=.01, **p<=.001, ***p<=.0001. p values using unpaired Student’s t-test. Graphs and flow plot numbers, mean±SEM. See also Figure S3.
VTet2−/−Flt3ITD LSCs are refractory to FLT3-targeted therapy
FLT3 inhibitors have clinical activity in FLT3ITD mutant AML but do not achieve sustained remission (Kayser and Levis, 2014; Smith et al., 2012). To understand the nature of this response, we assessed leukemic burden in mice transplanted with VTet2−/−Flt3ITD cells following treatment with the FLT3 inhibitor AC220 (n=5) (Figure 3A). AC220 treatment (10 mg/kg) for 4 weeks led to a reduction in leukocyte count and a modest reduction in spleen weight and leukemic burden (Figure 3B, 3C, & S3H). However, we observed persistent cKit+ blast cells in the blood of mice treated with AC220 therapy (Figure 3D). This is in contrast to reported FLT3 inhibition in Flt3ITD mice where aberrant differentiation is effectively reversed (Chu et al., 2012).
We next assessed differential effects of FLT3 inhibition on LSCs and on bulk leukemia cells. We treated primary VTet2−/−Flt3ITD mice with vehicle or AC220 (10 mg/kg) (n=3 per group). Mice treated with AC220 for 3 weeks had smaller spleens and reduced WBC counts consistent with an inhibitory effect on the bulk leukemic population (Figure 3E & 3F). AC220 therapy increased the proportion of MEP cells while decreasing that of GMPs, suggesting that myeloid progenitors remain sensitive to FLT3 inhibition (Figure 3G). By contrast, FLT3 inhibition did not reduce the absolute number of LSK cells indicative of a lack of efficacy on AML LSCs (Figure 3H). There was a trend towards increased LSK frequency due to a relative decrease in the other cell populations (Figure 3H). In addition, AC220 therapy did not inhibit LSC function, as recipients transplanted with cells from AC220 treated mice developed disease with similar kinetics as those from vehicle treated mice (Figure S3I and S3J). Furthermore, treatment with induction chemotherapy or with AC220 did not alter the immunophenotype of the LSK compartment, with continued expansion of the MPPs and reduction of the LT-HSCs (Figure 3I). These data indicate that VTet2−/−Flt3ITD LSCs are refractory to FLT3 targeted therapy and to cytotoxic chemotherapy, and suggest that there may be specific gain-of-function gene regulatory effects by combinatorial actions of Tet2−/− and Flt3ITD in LSCs that confer this phenotype.
Transcriptional and Methylation Profiling Reveal that VTet2−/−Flt3ITD LSC Have a Unique Signature
In order to understand the basis for the leukemic phenotype, we performed RNA sequencing on LSK and GMP cells from wild-type and VTet2−/−Flt3ITD mice. Unsupervised hierarchical clustering showed that LSK cells from wild-type and mutant mice were more similar to each other than to GMPs of the same genotype, again supporting the observation that mutant GMPs had not gained a stem-like signature (Figure 4A & S4A). Compared to wild-type LSK cells, Tet2−/−;Flt3ITD LSKs had a distinct gene expression signature, with dysregulated expression of known self-renewal and differentiation genes including Id1, Gata1, Gata2, Mpl, and Socs2 (Figure 4B, S4B & Table S1, S2). This signature also was distinct from Tet2−/− or Flt3ITD LSKs (Figure S4C). GSEA analysis showed that VTet2−/−Flt3ITD LSK cells were characterized by enrichment of an embryonic stem cell signature and reduced expression of a GATA target signature (Figure 4C) (Liberzon et al., 2011; Wong et al., 2008).
Figure 4. RNA-seq and methylation analysis of VTet2−/−Flt3ITD mice.

(A,B) Heat map from RNA sequencing expression analysis of WT and Tet2−/−;Flt3ITD bone marrow LSK and GMP cells (A) and LSK cells for genes ranked by Fold Change >3.5 and FDR<10−5 (B). z-score scale. (C) GSEA enrichment plot of Tet2−/−;Flt3ITD LSK RNA expression correlated with the embryonic stem cell signature and negatively correlated with GATA1 signature. (D) Dendrogram clustering based on eRRBS methylation profiles from WT and Tet2−/−;Flt3ITD (T2F3) LSK cells. (E) Gene localization of hypermethylated and hypomethylated differentially methylated regions (DMRs) in Tet2−/−;Flt3ITD LSK cells, percentages. (F) GSEA enrichment plot correlating hypermethylation promoter genes with genes with down-regulated expression trend in Tet2−/−;Flt3ITD LSK cells. See also Figure S4, Table S1–3.
Previous studies have shown that TET2 mutant AMLs are characterized by site-specific changes in DNA methylation (Akalin et al., 2012a; Figueroa et al., 2010). We therefore performed methylation profiling of VTet2−/−Flt3ITD, single mutant, and wild-type LSK cells using enhanced reduced representation bisulfite sequencing (eRRBS) to evaluate CpG regions (Table S3). Hierarchical clustering by differentially methylated cytosines (DMCs) demonstrated clear separation of leukemic VTet2−/−Flt3ITD LSKs from WT LSKs (Figure 4D). We next analyzed the grouping of DMCs into differentially methylated regions (DMRs). The majority of DMRs in VTet2−/−Flt3ITD LSKs were located in gene regulatory elements, with a distribution that was distinct from those of single mutant LSKs (Figure 4E & S4D). CpG islands and particularly CpG shores have been described to be critical regulatory regions for hematopoiesis (Ji et al., 2010). Hypermethylated DMRs in VTet2−/−Flt3ITD LSKs were more frequently located in promoter regions and CpG shores compared to other DMRs groups, suggesting gene regulatory function (Figure 4E & S4D). Principle component analysis of the differentially methylated regions (DMRs) showed that VTet2−/−Flt3ITD LSK cells form a separate group from single mutants LSKs, suggesting a functional correlation between genotype and variation in methylation (Figure S4E). GSEA analysis demonstrated hypermethylated promoter regions were enriched for genes with a trend in decreased expression based on RNA-seq data, consistent with epigenetic silencing through hypermethylation (Figure 4F). We identified 58 genes with altered differential expression and promoter or gene body hypermethylation in VTet2−/−Flt3ITD LSK cells compared to wild-type (Table S4). These include Gata2, Hox genes, Smarca2, and Dusp4, genes with known roles in hematopoiesis and differentiation. These data indicate that key regulatory genes are epigenetically modified and altered in expression as a result of Tet2 and Flt3 mutation.
Concurrent Tet2 and Flt3ITD mutations result in synergistic effects on DNA methylation and gene expression
With the observation that concurrent mutations in Tet2 and Flt3ITD cooperate to induce AML, we hypothesized that the combination of these disease alleles would result in a synergistic effect on the epigenetic state and on gene expression. Compared to Tet2−/− or Flt3ITD LSKs, Tet2−/−;Flt3ITD LSKs had a dramatic increase in the number of DMRs; we observed 1704 DMRs in Tet2−/−;Flt3ITD, 174 in Tet2−/−, and 200 in Flt3ITD LSKs (Figure 5A). Tet2−/− LSKs displayed proportionally greater hypermethylation versus wild-type LSKs, whereas Flt3ITD LSKs had predominant hypomethylation. The combination of VTet2−/−Flt3ITD had greater DNA hypermethylation, similar in direction (but not in extent) to that observed in Tet2−/− LSK cells (Figure 5B). We observed that Tet2−/−;Flt3ITD mutation resulted in DMCs at loci distinct from those affected in Flt3ITD or Tet2−/− LSKs (Figure S5A); similarly, the number of hypermethylated DMCs per genetic loci was also significantly different (Figure 5C). The majority of genes with DMRs in Tet2−/−;Flt3ITD LSKs were unique from the smaller set of those observed in Tet2−/− or Flt3ITD LSKs (Figure 5D). Therefore, the impact of Tet2−/−;Flt3ITD mutations on DNA methylation was much greater than would be expected from the additive effects of single Tet2 and Flt3ITD mutations, implying changes in methylation are a consequence of the cooperative effects of Tet2 loss and Flt3ITD.
Figure 5. Flt3ITD mutation and Tet2 loss synergistically regulate gene expression.

(A,B) Number of differentially methylated regions (DMRs) (A) and chromosomal hypermethylation and hypomethylation proportions (B) in Tet2−/−, Flt3ITD, Tet2−/−;Flt3ITD LSKs. (C) Heat map of number of hypermethylated differentially methylated cytosines (DMCs) in 424 genes in Tet2−/−;Flt3ITD LSKs compared to number of DMCs in Tet2−/− and Flt3ITD LSKs. (D) Venn diagram of genes associated with DMRs for each genotype. (E) Bar graph of paired DMC number (in red) and expression change (in blue) for genes with promoter and intron DMCs and differential RNA expression. (F) Heat map of RNA expression based on genes in Table 1 (>=6 DMCs and altered expression in Tet2−/−;Flt3ITD LSKs) for LSKs of each genotype. z-score scale. (G) Gata2 locus methylation for LSK cells, LSK cells following treatment, and human ST-HSC leukemia and CD34+ cell populations (scaled to average methylation). Also, location of DMRs and DMCs as determined through eRRBS analysis. (H) Gata2 relative RNA expression in LSK cells. (I) Scatter plot of corresponding DMRs between Tet2−/−;Flt3ITD LSKs and Tet2−/−;Flt3ITD AC220 treated LSKs. Fitted line in blue; +/− 20% variation between samples by red lines. (PearsonCorr=0.948) (J) CD71 and Mac1 immunophenotype of methylcellulose colonies from Tet2−/−;Flt3ITD cells expressing MIGR1 control or Gata2, mean gate frequency. (K,L) Peripheral blood GFP% of red blood cells (RBC), Mac1+ cells, and cKit+ cells at 3 weeks and 9 weeks (K) and leukemia free survival (L) of mice transplanted with MIGR1 (n=7) and Gata2 (n=5) transduced Tet2−/−;Flt3ITD bone marrow. *p<=.01, ***p<.0001, using unpaired Student’s t-test. Graphs mean±SEM. Survival statistic by long-rank test. See also Figure S5, Table S4 – S7.
In order to identify target loci with potential functional relevance, we focused on genes with altered expression and methylation in the setting of concurrent Tet2 and Flt3ITD mutations. We identified the set of differentially expressed genes in VTet2−/−Flt3ITD, and then target loci where the combination of Tet2 and Flt3ITD mutations had a cooperative gain-of-function effect on methylation using logistic regression and pairwise comparisons (VTet2−/−Flt3ITD vs single mutants). We identified 115 genes that exhibited cooperative effects on DNA methylation (>=3 DMCs) and altered expression (Tables S5, S6, & Figure S5B). For the majority of the loci that demonstrated cooperativity, we observed DNA hypermethylation and transcriptional silencing (Table 1 & Figure 5E). The pattern of expression of the subset of these genes with the greatest methylation differences (>=6 DMRs, see Table 1), demonstrated a distinct expression profile in Tet2−/−;Flt3ITD LSKs compared to wild-type or single mutant LSKs (Figure 5F). Notably, of the 27 genes with promoter DMRs and differential expression, 19 were differentially methylated in TET2 mutant AML patients (Table S6) (Akalin et al., 2012a). We next analyzed methylation in ST-HSC cells from TET2;FLTITD AML patients (n=2) by performing eRRBS and compared DNA methylation to normal CD34+ cells (n=13). We identified 83 genes which had at least 5 promoter DMCs in murine Tet2−/−;Flt3ITD LSKs compared to wild-type LSKs and also had a human ortholog; 53 of these 83 genes had at least one DMC in TET2;FLT3ITD AML ST-HSCs (p=4.8 × 10⁻⁸), and 33 of 83 had 5 or more DMCs (p=2.8 × 10⁻⁶) (Table S7).
Table 1.
Genes demonstrating synergistic interaction of Tet2−/− and Flt3ITD on methylation in Tet2−/−;Flt3ITD LSK cells, with altered gene expression.
| Gene Symbol | Hyper DMC numbera | Hypo DMC numbera | log2FC | ||||
|---|---|---|---|---|---|---|---|
|
| |||||||
| T2F3 | Tet2−/− | Flt3ITD | T2F3 | Tet2−/− | Flt3ITD | ||
| MN1 | 91 | 3 | 0 | 0 | 0 | 0 | −2.24 |
| HOXA3 | 51 | 0 | 1 | 0 | 3 | 1 | −2.19 |
| GATA2 | 39 | 0 | 12 | 0 | 2 | 1 | −2.99 |
| ZFPM1 | 27 | 0 | 2 | 0 | 0 | 0 | −2.85 |
| GM53 | 23 | 0 | 0 | 0 | 0 | 1 | 6.92 |
| LTBP3 | 22 | 0 | 0 | 0 | 0 | 0 | −1.68 |
| GSE1 | 23 | 0 | 4 | 2 | 2 | 0 | −1.42 |
| FAM110A | 17 | 0 | 0 | 0 | 0 | 0 | −1.26 |
| RAPGEF3 | 15 | 0 | 4 | 0 | 0 | 0 | −2.88 |
| TRIM47 | 14 | 0 | 3 | 0 | 1 | 0 | −3.54 |
| RUNX3 | 14 | 0 | 0 | 1 | 0 | 1 | −1.05 |
| GDF10 | 12 | 0 | 1 | 0 | 0 | 0 | 9.23 |
| ADCY9 | 12 | 0 | 0 | 0 | 0 | 0 | −1.64 |
| HOXB3 | 12 | 0 | 0 | 0 | 0 | 0 | −2.11 |
| RPS4Y2 | 12 | 0 | 0 | 0 | 0 | 0 | −3.48 |
| TSHZ2 | 14 | 0 | 3 | 3 | 0 | 3 | 6.64 |
| FLT1 | 12 | 0 | 1 | 1 | 0 | 0 | 2.31 |
| SCUBE3 | 11 | 0 | 0 | 0 | 1 | 0 | −1.65 |
| CUEDC1 | 10 | 0 | 1 | 0 | 3 | 2 | −1.86 |
| 2700081O15RIK | 10 | 0 | 0 | 0 | 0 | 0 | −2.10 |
| STAP2 | 15 | 0 | 1 | 7 | 0 | 0 | 6.04 |
| KCTD1 | 8 | 0 | 1 | 0 | 2 | 1 | −1.05 |
| ZFHX3 | 8 | 0 | 3 | 0 | 0 | 0 | −1.21 |
| NRG1 | 8 | 0 | 0 | 0 | 0 | 0 | 5.67 |
| PCDHGB6 | 8 | 0 | 0 | 0 | 0 | 0 | −2.46 |
| HLF | 7 | 10 | 2 | 0 | 0 | 0 | −2.74 |
| AGAP1 | 8 | 0 | 2 | 1 | 0 | 0 | −1.30 |
| ARAP3 | 7 | 0 | 2 | 0 | 0 | 0 | −1.56 |
| TCF7 | 7 | 0 | 0 | 0 | 0 | 2 | −1.78 |
| C230081A13RIK | 7 | 0 | 0 | 0 | 0 | 0 | −1.02 |
| GDF3 | 7 | 0 | 0 | 0 | 0 | 0 | −4.66 |
| RAI1 | 7 | 0 | 0 | 0 | 0 | 0 | −1.12 |
| MDGA1 | 7 | 0 | 1 | 1 | 0 | 0 | −3.13 |
| TMEM215 | 6 | 0 | 0 | 0 | 0 | 1 | 2.35 |
| CORO7 | 6 | 0 | 0 | 0 | 0 | 0 | −0.93 |
| ARID1B | 6 | 0 | 0 | 1 | 0 | 0 | −1.03 |
| TMEM51 | 6 | 0 | 0 | 2 | 0 | 0 | 3.61 |
| RASSF4 | 0 | 0 | 0 | 6 | 0 | 0 | 2.31 |
| REPS1 | 0 | 0 | 0 | 7 | 0 | 4 | 1.39 |
| CISH | 0 | 0 | 0 | 18 | 1 | 4 | 2.81 |
LSK, (lin−Sca+cKit+) cells; Hyper, Hypermethylation; Hypo, Hypomethylation; T2F3, Tet2−/−;Flt3ITD synergy component; log2FC, log 2 fold change of gene expression in Tet2−/−;Flt3ITD LSKs compared to wild-type LSKs.
DMC contribution of the allele or allele combination to overall gene methylation (gene body and 5kb 5′ region) calculated by logistic regression analysis, filtered for >=6 DMC.
Epigenetic silencing of Gata2 contributes to impaired differentiation in VTet2−/−Flt3ITD LSC
The Gata2 locus in VTet2−/−Flt3ITD LSKs was characterized by a marked hypermethylation at the promoter, introns, and a key enhancer region compared to wild-type and single mutant LSKs (Figure 5G) (Snow et al., 2010). Expression analysis of Gata2 in sorted LSK cells demonstrate that concomitant Tet2 and Flt3ITD mutations led to significant decreased levels of RNA expression (Figure 5H). The GATA2 locus was also densely hypermethylated in human TET2; FLT3ITD AML cells, with 45 DMCs in the GATA2 locus in leukemic ST-HSCs compared to normal CD34+ cells (Figure 5G).
To determine the impact of Flt3ITD inhibition on Gata2 expression, we assessed the expression level of Gata2 in LSK cells sorted from vehicle or AC220 treated VTet2−/−Flt3ITD mice. Gata2 expression modestly increased with AC220 therapy, but did not return to wild-type levels (Figure S5C). This suggests that the cooperative activities of both mutations are required to epigenetically silence the Gata2 locus and that targeting one mutant allele alone is not sufficient to reverse the coordinate effects on the transcriptome. We then analyzed the impact of FLT3 inhibition with AC220 on locus-specific DNA methylation in VTet2−/−Flt3ITD LSKs. Despite evidence of effect on bulk leukemia cells with reductions in WBC count and spleen size, AC220 treatment did not substantively alter the overall LSK methylation status as individual DMRs remained highly correlated between naïve and treated LSKs (Figure 5I and S5D–F). Clustering by methylation status showed that AC220-treated LSKs were indistinguishable from vehicle treated or naïve VTet2−/−Flt3ITD LSKs and were distinct from Tet2−/− LSKs (Figure S5G and S5H). Consistent with the transcriptional data, the methylation status of Gata2 locus was largely unaffected by AC220 therapy (Figure 5G).
We next sought to assess whether restoring Gata2 expression would alter differentiation and inhibit leukemogenesis in VTet2−/−Flt3ITD cells. We expressed Gata2 and MIGR1 control using a GFP-expressing vector in bone marrow cells from VTet2−/−Flt3ITD mice. When plated in methylcellulose, control VTet2−/−Flt3ITD colony cells showed reduced CD71 positivity, consistent with impaired erythroid differentiation (Figure 5J & S5I). By contrast, VTet2−/−Flt3ITD cells re-expressing Gata2 had increased CD71 expression (Figure 5J & S5I). These data imply Tet2−/−; Flt3ITD bone marrow cells are not irrevocably blocked but are capable of differentiating when Gata2 is re-expressed. We next assess the impact of re-expressing Gata2 in vivo by transplanting Tet2−/−;Flt3ITD bone marrow cells expressing control GFP or Gata2 into recipient mice. Cells expressing Gata2 engrafted in vivo; however, we observed a marked reduction in the proportion of Gata2 positive VTet2−/−Flt3ITD myeloid leukemia cells compared to Gata2 positive erythroid cells, consistent with in vivo erythroid differentiation of AML cells (Figure 5K). Furthermore, Gata2 expression, but not expression of vector control, resulted in a progressive reduction in the proportion of cKit+ Tet2−/−;Flt3ITD leukemic cells, correlating with disappearance of the AML clone (Figure 5K & S5J). Notably, mice expressing vector alone succumbed to leukemia, whereas no mice expressing Gata2 developed lethal AML (Figure 5L). These data demonstrate that Gata2 re-expression can restore differentiation and attenuates leukemogenesis in vivo.
Discussion
Mutations that dysregulate the DNA hydroxy-methylcytosine pathway are amongst the most common disease alleles in human cancers and include mutations in TET2, as well as mutations in IDH1, IDH2, and WT1 that can lead to inhibition of TET2 function. As such, there is a need to delineate how these mutations contribute to malignant transformation, the epigenetic state, and alterations in transcriptional output. Here we show that Tet2 loss combined with Flt3ITD causes leukemia in vivo, and that these two disease alleles cooperate to induce synergistic and gain-of-function effects on DNA methylation and gene expression.
Previous studies using Tet2 conditional knock-out mice implicate a role for TET2 in regulating stem cell self-renewal. These data with studies demonstrating TET2 mutations establishing clonal hematopoiesis and a pre-leukemic state in the human context, suggest that TET2 mutations enhance stem cell function and initiate the process of malignant transformation. Similarly, studies have shown that a broader spectrum of leukemia disease alleles, including those in DNMT3A and in ASXL1, can promote clonal hematopoiesis without inducing AML. TET2 loss has a second, critical function in leukemic transformation, as it can cooperate with other AML disease alleles to coordinately dysregulate DNA methylation and alter expression at target loci. This effectively maintains the block in hematopoietic differentiation and increases self-renewal of AML LSCs after malignant transformation. These data demonstrate a role for TET2 mutation in leukemic maintenance distinct from inducing clonal expansion, and suggest that mutations in epigenetic modifiers can act at multiple steps during leukemogenesis.
We identify the LSC population in our model of TET2;FLT3ITD mutant AML in the MPP compartment, a population that has also been found to be expanded in human AML samples and to be capable of leukemia propagation in xenotransplant studies (Goardon et al., 2011). Although the combination of Tet2 and Flt3 mutations in our mouse model was sufficient to promote leukemogenesis, additional mutations and chromosomal alterations are sometimes seen in TET2;FLT3ITD mutant human AML (CGARN, 2013), suggesting additional events may be required to transform human LSCs. However, we find significant overlap between the set of differentially methylated genes in our model and in human AML stem-progenitor cells suggesting that this combination of mutations leads to similar effects on DNA methylation.
Although the TET family of enzymes is critical in regulating DNA methylation, the target genes and pathways affected have not been well characterized in AML or other human cancers. We demonstrate that Tet2;Flt3ITD mutant AML has a unique epigenetic and transcriptional signature, and that LSCs in Tet2;Flt3ITD mutant AML are characterized by increased expression of a stem cell gene expression program and by reduced expression of Gata2 and of a GATA-associated gene expression signature. These data underscore recent studies showing that Idh2;Flt3ITD mutant AML is characterized by a reduced GATA gene expression signature (Kats et al., 2014) and that IDH1 and IDH2 mutant AML samples are characterized by differential methylation of GATA target genes (Figueroa et al., 2010). Consistent with these data, we found that GATA2 is hypermethylated in TET2;Flt3ITD human AML stem-progenitor cells. Furthermore, AML profiling has identified somatic GATA2 mutations and dysregulated GATA2 expression (Celton et al., 2014; CGARN, 2013; Groschel et al., 2014). Our data is also consistent with reports in which human hematopoietic stem cell differentiation to the erythroid lineage acquires 5-hmC at binding sites enriched for GATA1 and GATA2 motifs and depends on TET2 (Madzo et al., 2014; Pronier et al., 2011). Undoubtedly, there are additional genes that are dysregulated in TET2 and IDH mutant AMLs that can contribute to leukemic transformation; they may also vary depending on the specific cooperating mutation.
Although loss of Tet2 alone leads to alterations in DNA methylation and gene expression, we found that the combination of Tet2 loss with expression of FLT3ITD results in synergistic and gain-of-function effects on the epigenetic state and on transcription. Previous studies in AML and in other malignancies have suggested that different somatic mutations combine to induce transformation by endowing a cancer cell with discrete, necessary biologic features; our data suggest that there may be specific target genes that serve as convergent nodes for cooperative transformation requiring combinations of mutations. We observe that inhibition of FLT3 signaling alone is not sufficient to reverse the methylation changes in Tet2;Flt3ITD mutant LSCs. One could speculate that since TET2 is required for demethylation, once certain CpGs become methylated in the combined TET2;FLT3ITD mutant setting, even if FLT3 signaling is blocked, without sufficient TET2 activity, the methylation status cannot be reset. This provides another possible mechanism of resistance to FLT3 directed therapy; specifically the persistent altered epigenetic state of LSCs that is not reversed by FLT3 inhibitor monotherapy.
The observation that ectopic expression of Gata2 can promote differentiation of VTet2−/−Flt3ITD mutant AML cells demonstrates that Tet2;Flt3ITD mutant LSCs have an epigenetic signature that does not irrevocably alter their differentiation and self-renewal potential. These data suggest that therapies that can reverse this signature will offer significant therapeutic efficacy in AML patients with mutations in TET2, IDH1, or IDH2. This may include combination therapies which incorporate epigenetic modulators such as hypomethylating agents and bromodomain inhibitors, or targeted therapies such as the mutant IDH1 and IDH2 inhibitors (Rohle et al., 2013; Wang et al., 2013). Clinical studies indicate increased sensitivity to hypomethylating agents in TET2 mutant patients (Bejar et al., 2014; Traina et al., 2014), which may reflect an ability to reverse the effects of TET2 mutations on DNA methylation by these agents. Studies in preclinical models and in the clinical setting will determine if these or other epigenetic therapies can be used to potently and specifically reprogram leukemia stem cells to induce differentiation, and to determine how best to incorporate epigenetically targeted agents into multimodality therapies.
Experimental Procedures
Transgenic Animals
The conditional Vav-cre+ Tet2fl/fl mice were previously described (Moran-Crusio et al., 2011) and Flt3ITD mice were kindly provided by Gary Gilliland (University of Pennsylvania). Pathology was obtained after fixation in 4% PFA and slides stained with H&E. All animal procedures were conducted in accordance with the Guidelines for the Care and Use of Laboratory Animals and were approved by the Institutional Animal Care and Use Committees at MSKCC.
In vitro colony forming assays
Bone marrow cells (whole or sorted populations) were seeded into cytokine supplemented methylcellulose medium (Methocult, M3434, Stem Cell Technologies). Colonies propagated in culture were scored at day 7 to 10. Cells were resuspended and re-plated at 15,000 cells per well.
Bone marrow transplantation
Dissected femurs and tibias were isolated. Bone marrow was flushed with a syringe into RPMI 10%FCS media. Spleens were isolated and single cell suspensions made by mechanical disruption using glass slides. Cells were passed through a 70 μm strainer. RBCs were lysed in ammonium chloride-potassium bicarbonate lysis buffer for 10 minutes on ice. Finally, 1 × 10⁶ total cells were transplanted via tail vein injection into lethally irradiated (2x 550 Rad) C57BL/6 or CD45.1 host mice. For sorted cell populations, 1×10⁵ (LSK), 3×10⁵ (GMP), 4×10⁵ (GFP+) cells were transplanted in combination with support marrow.
In vivo treatment studies
Mice were treated daily using oral gavage with AC220 at 10 mg/kg, suspended in 5% 2-hydroxypropyl-β-cyclodextrin. Mice were treated with combination chemotherapy using protocol previously described (Zuber et al., 2009). Briefly, mice were treated for 5 to 7 days daily with i.p. injections of 100 mg/kg cytarabine and 3 days, 3 mg/kg doxorubicin.
RNA sequencing and Analysis
Cell populations were sorted using BD FACSAria and RNA isolated using TrizolLS. RNA was prepared using RiboMinus from LifeTechnologies. The library was sequenced using the Ion Proton System from LifeTechnologies. Aligned RNA was analyzed for fold change. See supplement for details of analysis.
eRRBS and Differential Methylation Analysis
eRRBS was performed using a protocol previously described (Akalin et al., 2012a). Briefly, genomic DNA were digested with MspI. DNA fragments were end-repaired, adenylated and ligated with Illumina kits. Library fragments of 150–250 bp and 250–400 bp were isolated. Bisulfite treatment was performed using the EZ DNA Methylation Kit (Zymo Research). Libraries were amplified and sequenced on an Illumina HiSeq. Differential methylation analysis was performed on the resulting eRRBS data using methylKit (Akalin et al., 2012b) for finding single nucleotide differences (q-value < 0.01 and methylation percentage difference of at least 25%) and eDMR (Li et al., 2013) for finding differentially methylated regions. See supplement for details of analysis.
Retroviral transduction
MSCV Gata2 construct was provided by Dr. John Crispino (Northwestern). Virus was produced by transfecting 293T cells with MSCV and EcoPack plasmids. Bone marrow was harvested 6 days after 5FU (150 mg/kg) treatment. After red cell lysis, the cells were cultured in media containing RPMI/10% FBS and IL-3 (7 ng/ml), IL-6 (10 ng/ml), and stem cell factor (10 ng/ml). Cells were infected twice in the presence of polybrene and Hepes buffer.
Flow cytometry and FACS
Antibody staining and FACS analysis were performed as previously described (Moran-Crusio et al., 2011). Intra-cytoplasmic staining was performed with the Cytofix Cytoperm kit from BD Biosciences. Stem cell enrichment was performed using the Progenitor Cell Enrichment Kit (Stem Cell Technologies). Isolation of human stem and progenitor populations from mononuclear cells was performed as previously described (Barreyro et al., 2012). See supplement for antibodies.
Patient Samples
AML samples were obtained at diagnosis from patients enrolled in the Eastern Cooperative Oncology Group’s (ECOG) 1900 clinical trial. All patients provided informed consent. Approval was obtained from the Institutional Review Board at Memorial Sloan-Kettering Cancer Center.
Supplementary Material
Significance.
Specific combinations of AML disease alleles confer adverse outcomes and define subtypes; however, in vivo models do not exist for the majority of common, poor-prognosis genotypes. Here we show that TET2 and FLT3 mutations cooperate to induce AML using a mouse model. This model has a defined leukemia stem cell population with a characteristic transcriptional and epigenetic profile and is critical for therapeutic targeting. The methylation changes exhibit cooperativity of disease alleles to target multiple loci. These data also suggest that leukemic transformation by these epigenetic changes is reversible, and therapies that reactivate silenced genes may improve outcomes for AML patients.
Acknowledgments
This work was supported by a Gabrielle’s Angel Fund grant to RLL and AMM, a Leukemia Lymphoma Society (LLS) Translational Research grant to RL and IA, grant CA172636-01 to RLL, IA and AM, and the Samuel Waxman Cancer Research Center. CEM is supported by R01HG006798, R01NS076465; SN and MH by R01CA166835; MSKCC cores by P30 CA008748. AM is a Burroughs Wellcome Clinical Translational Scholar and supported by the Sackler Center for Biomedical and Physical Sciences. RLL is a LLS Scholar. AHS is supported by the Conquer Cancer Foundation and LLS. YJ is an ASH Scholar. We would like to thank Scott Lowe for reagents and advice on chemotherapy studies.
Footnotes
Accession numbers
RNA sequencing data has been deposited in GEO under accession number GSE57244 and the eRRBS data under GSE57114.
Publisher's Disclaimer: This is a PDF file of an unedited manuscript that has been accepted for publication. As a service to our customers we are providing this early version of the manuscript. The manuscript will undergo copyediting, typesetting, and review of the resulting proof before it is published in its final citable form. Please note that during the production process errors may be discovered which could affect the content, and all legal disclaimers that apply to the journal pertain.
References
- Abdel-Wahab O, Mullally A, Hedvat C, Garcia-Manero G, Patel J, Wadleigh M, Malinge S, Yao J, Kilpivaara O, Bhat R, et al. Genetic characterization of TET1, TET2, and TET3 alterations in myeloid malignancies. Blood. 2009;114:144–147. doi: 10.1182/blood-2009-03-210039. [DOI] [PMC free article] [PubMed] [Google Scholar]
- Akalin A, Garrett-Bakelman FE, Kormaksson M, Busuttil J, Zhang L, Khrebtukova I, Milne TA, Huang Y, Biswas D, Hess JL, et al. Base-pair resolution DNA methylation sequencing reveals profoundly divergent epigenetic landscapes in acute myeloid leukemia. PLoS Genet. 2012a;8:e1002781. doi: 10.1371/journal.pgen.1002781. [DOI] [PMC free article] [PubMed] [Google Scholar]
- Akalin A, Kormaksson M, Li S, Garrett-Bakelman FE, Figueroa ME, Melnick A, Mason CE. methylKit: a comprehensive R package for the analysis of genome-wide DNA methylation profiles. Genome Biol. 2012b;13:R87. doi: 10.1186/gb-2012-13-10-r87. [DOI] [PMC free article] [PubMed] [Google Scholar]
- Barreyro L, Will B, Bartholdy B, Zhou L, Todorova TI, Stanley RF, Ben-Neriah S, Montagna C, Parekh S, Pellagatti A, et al. Overexpression of IL-1 receptor accessory protein in stem and progenitor cells and outcome correlation in AML and MDS. Blood. 2012;120:1290–1298. doi: 10.1182/blood-2012-01-404699. [DOI] [PMC free article] [PubMed] [Google Scholar]
- Bejar R, Lord A, Stevenson K, Bar-Natan M, Perez-Ladaga A, Zaneveld J, Wang H, Caughey B, Stojanov P, Getz G, et al. TET2 mutations predict response to hypomethylating agents in myelodysplastic syndrome patients. Blood. 2014;124:2705–2712. doi: 10.1182/blood-2014-06-582809. [DOI] [PMC free article] [PubMed] [Google Scholar]
- Bonnet D, Dick JE. Human acute myeloid leukemia is organized as a hierarchy that originates from a primitive hematopoietic cell. Nature medicine. 1997;3:730–737. doi: 10.1038/nm0797-730. [DOI] [PubMed] [Google Scholar]
- Busque L, Patel JP, Figueroa ME, Vasanthakumar A, Provost S, Hamilou Z, Mollica L, Li J, Viale A, Heguy A, et al. Recurrent somatic TET2 mutations in normal elderly individuals with clonal hematopoiesis. Nat Genet. 2012;44:1179–1181. doi: 10.1038/ng.2413. [DOI] [PMC free article] [PubMed] [Google Scholar]
- Celton M, Forest A, Gosse G, Lemieux S, Hebert J, Sauvageau G, Wilhelm BT. Epigenetic regulation of GATA2 and its impact on normal karyotype acute myeloid leukemia. Leukemia. 2014 doi: 10.1038/leu.2014.67. [DOI] [PubMed] [Google Scholar]
- CGARN CGARN. Genomic and epigenomic landscapes of adult de novo acute myeloid leukemia. N Engl J Med. 2013;368:2059–2074. doi: 10.1056/NEJMoa1301689. [DOI] [PMC free article] [PubMed] [Google Scholar]
- Chu SH, Heiser D, Li L, Kaplan I, Collector M, Huso D, Sharkis SJ, Civin C, Small D. FLT3-ITD knockin impairs hematopoietic stem cell quiescence/homeostasis, leading to myeloproliferative neoplasm. Cell Stem Cell. 2012;11:346–358. doi: 10.1016/j.stem.2012.05.027. [DOI] [PMC free article] [PubMed] [Google Scholar]
- Delhommeau F, Dupont S, Della Valle V, James C, Trannoy S, Masse A, Kosmider O, Le Couedic JP, Robert F, Alberdi A, et al. Mutation in TET2 in myeloid cancers. The New England journal of medicine. 2009;360:2289–2301. doi: 10.1056/NEJMoa0810069. [DOI] [PubMed] [Google Scholar]
- Figueroa ME, Abdel-Wahab O, Lu C, Ward PS, Patel J, Shih A, Li Y, Bhagwat N, Vasanthakumar A, Fernandez HF, et al. Leukemic IDH1 and IDH2 mutations result in a hypermethylation phenotype, disrupt TET2 function, and impair hematopoietic differentiation. Cancer Cell. 2010;18:553–567. doi: 10.1016/j.ccr.2010.11.015. [DOI] [PMC free article] [PubMed] [Google Scholar]
- Genovese G, Kahler AK, Handsaker RE, Lindberg J, Rose SA, Bakhoum SF, Chambert K, Mick E, Neale BM, Fromer M, et al. Clonal Hematopoiesis and Blood-Cancer Risk Inferred from Blood DNA Sequence. N Engl J Med. 2014 doi: 10.1056/NEJMoa1409405. [DOI] [PMC free article] [PubMed] [Google Scholar]
- Gilliland DG, Griffin JD. The roles of FLT3 in hematopoiesis and leukemia. Blood. 2002;100:1532–1542. doi: 10.1182/blood-2002-02-0492. [DOI] [PubMed] [Google Scholar]
- Goardon N, Marchi E, Atzberger A, Quek L, Schuh A, Soneji S, Woll P, Mead A, Alford KA, Rout R, et al. Coexistence of LMPP-like and GMP-like leukemia stem cells in acute myeloid leukemia. Cancer Cell. 2011;19:138–152. doi: 10.1016/j.ccr.2010.12.012. [DOI] [PubMed] [Google Scholar]
- Groschel S, Sanders MA, Hoogenboezem R, de Wit E, Bouwman BA, Erpelinck C, van der Velden VH, Havermans M, Avellino R, van Lom K, et al. A Single Oncogenic Enhancer Rearrangement Causes Concomitant EVI1 and GATA2 Deregulation in Leukemia. Cell. 2014;157:369–381. doi: 10.1016/j.cell.2014.02.019. [DOI] [PubMed] [Google Scholar]
- Guo JU, Su Y, Zhong C, Ming GL, Song H. Hydroxylation of 5-methylcytosine by TET1 promotes active DNA demethylation in the adult brain. Cell. 2011;145:423–434. doi: 10.1016/j.cell.2011.03.022. [DOI] [PMC free article] [PubMed] [Google Scholar]
- Heuser M, Yun H, Berg T, Yung E, Argiropoulos B, Kuchenbauer F, Park G, Hamwi I, Palmqvist L, Lai CK, et al. Cell of origin in AML: susceptibility to MN1-induced transformation is regulated by the MEIS1/AbdB-like HOX protein complex. Cancer Cell. 2011;20:39–52. doi: 10.1016/j.ccr.2011.06.020. [DOI] [PMC free article] [PubMed] [Google Scholar]
- Hou HA, Lin CC, Chou WC, Liu CY, Chen CY, Tang JL, Lai YJ, Tseng MH, Huang CF, Chiang YC, et al. Integration of cytogenetic and molecular alterations in risk stratification of 318 patients with de novo non-M3 acute myeloid leukemia. Leukemia. 2014;28:50–58. doi: 10.1038/leu.2013.236. [DOI] [PubMed] [Google Scholar]
- Jaiswal S, Fontanillas P, Flannick J, Manning A, Grauman PV, Mar BG, Lindsley RC, Mermel CH, Burtt N, Chavez A, et al. Age-Related Clonal Hematopoiesis Associated with Adverse Outcomes. N Engl J Med. 2014 doi: 10.1056/NEJMoa1408617. [DOI] [PMC free article] [PubMed] [Google Scholar]
- Jan M, Snyder TM, Corces-Zimmerman MR, Vyas P, Weissman IL, Quake SR, Majeti R. Clonal evolution of preleukemic hematopoietic stem cells precedes human acute myeloid leukemia. Science translational medicine. 2012;4:149ra118. doi: 10.1126/scitranslmed.3004315. [DOI] [PMC free article] [PubMed] [Google Scholar]
- Ji H, Ehrlich LI, Seita J, Murakami P, Doi A, Lindau P, Lee H, Aryee MJ, Irizarry RA, Kim K, et al. Comprehensive methylome map of lineage commitment from haematopoietic progenitors. Nature. 2010;467:338–342. doi: 10.1038/nature09367. [DOI] [PMC free article] [PubMed] [Google Scholar]
- Kats LM, Reschke M, Taulli R, Pozdnyakova O, Burgess K, Bhargava P, Straley K, Karnik R, Meissner A, Small D, et al. Proto-Oncogenic Role of Mutant IDH2 in Leukemia Initiation and Maintenance. Cell Stem Cell. 2014;14:329–341. doi: 10.1016/j.stem.2013.12.016. [DOI] [PMC free article] [PubMed] [Google Scholar]
- Kayser S, Levis MJ. FLT3 tyrosine kinase inhibitors in acute myeloid leukemia: clinical implications and limitations. Leuk Lymphoma. 2014;55:243–255. doi: 10.3109/10428194.2013.800198. [DOI] [PMC free article] [PubMed] [Google Scholar]
- Kirstetter P, Schuster MB, Bereshchenko O, Moore S, Dvinge H, Kurz E, Theilgaard-Monch K, Mansson R, Pedersen TA, Pabst T, et al. Modeling of C/EBPalpha mutant acute myeloid leukemia reveals a common expression signature of committed myeloid leukemia-initiating cells. Cancer Cell. 2008;13:299–310. doi: 10.1016/j.ccr.2008.02.008. [DOI] [PubMed] [Google Scholar]
- Ko M, Huang Y, Jankowska AM, Pape UJ, Tahiliani M, Bandukwala HS, An J, Lamperti ED, Koh KP, Ganetzky R, et al. Impaired hydroxylation of 5-methylcytosine in myeloid cancers with mutant TET2. Nature. 2010;468:839–843. doi: 10.1038/nature09586. [DOI] [PMC free article] [PubMed] [Google Scholar]
- Krivtsov AV, Twomey D, Feng Z, Stubbs MC, Wang Y, Faber J, Levine JE, Wang J, Hahn WC, Gilliland DG, et al. Transformation from committed progenitor to leukaemia stem cell initiated by MLL-AF9. Nature. 2006;442:818–822. doi: 10.1038/nature04980. [DOI] [PubMed] [Google Scholar]
- Langemeijer SM, Kuiper RP, Berends M, Knops R, Aslanyan MG, Massop M, Stevens-Linders E, van Hoogen P, van Kessel AG, Raymakers RA, et al. Acquired mutations in TET2 are common in myelodysplastic syndromes. Nat Genet. 2009;41:838–842. doi: 10.1038/ng.391. [DOI] [PubMed] [Google Scholar]
- Lee BH, Williams IR, Anastasiadou E, Boulton CL, Joseph SW, Amaral SM, Curley DP, Duclos N, Huntly BJ, Fabbro D, et al. FLT3 internal tandem duplication mutations induce myeloproliferative or lymphoid disease in a transgenic mouse model. Oncogene. 2005;24:7882–7892. doi: 10.1038/sj.onc.1208933. [DOI] [PubMed] [Google Scholar]
- Li S, Garrett-Bakelman FE, Akalin A, Zumbo P, Levine R, To BL, Lewis ID, Brown AL, D’Andrea RJ, Melnick A, Mason CE. An optimized algorithm for detecting and annotating regional differential methylation. BMC Bioinformatics. 2013;14(Suppl 5):S10. doi: 10.1186/1471-2105-14-S5-S10. [DOI] [PMC free article] [PubMed] [Google Scholar]
- Li Z, Cai X, Cai CL, Wang J, Zhang W, Petersen BE, Yang FC, Xu M. Deletion of Tet2 in mice leads to dysregulated hematopoietic stem cells and subsequent development of myeloid malignancies. Blood. 2011;118:4509–4518. doi: 10.1182/blood-2010-12-325241. [DOI] [PMC free article] [PubMed] [Google Scholar]
- Liberzon A, Subramanian A, Pinchback R, Thorvaldsdottir H, Tamayo P, Mesirov JP. Molecular signatures database (MSigDB) 3.0. Bioinformatics. 2011;27:1739–1740. doi: 10.1093/bioinformatics/btr260. [DOI] [PMC free article] [PubMed] [Google Scholar]
- Madzo J, Liu H, Rodriguez A, Vasanthakumar A, Sundaravel S, Caces DB, Looney TJ, Zhang L, Lepore JB, Macrae T, et al. Hydroxymethylation at Gene Regulatory Regions Directs Stem/Early Progenitor Cell Commitment during Erythropoiesis. Cell Rep. 2014;6:231–244. doi: 10.1016/j.celrep.2013.11.044. [DOI] [PMC free article] [PubMed] [Google Scholar]
- Metzeler KH, Maharry K, Radmacher MD, Mrozek K, Margeson D, Becker H, Curfman J, Holland KB, Schwind S, Whitman SP, et al. TET2 mutations improve the new European LeukemiaNet risk classification of acute myeloid leukemia: a Cancer and Leukemia Group B study. J Clin Oncol. 2011;29:1373–1381. doi: 10.1200/JCO.2010.32.7742. [DOI] [PMC free article] [PubMed] [Google Scholar]
- Moran-Crusio K, Reavie L, Shih A, Abdel-Wahab O, Ndiaye-Lobry D, Lobry C, Figueroa ME, Vasanthakumar A, Patel J, Zhao X, et al. Tet2 loss leads to increased hematopoietic stem cell self-renewal and myeloid transformation. Cancer Cell. 2011;20:11–24. doi: 10.1016/j.ccr.2011.06.001. [DOI] [PMC free article] [PubMed] [Google Scholar]
- Patel JP, Gonen M, Figueroa ME, Fernandez H, Sun Z, Racevskis J, Van Vlierberghe P, Dolgalev I, Thomas S, Aminova O, et al. Prognostic relevance of integrated genetic profiling in acute myeloid leukemia. N Engl J Med. 2012;366:1079–1089. doi: 10.1056/NEJMoa1112304. [DOI] [PMC free article] [PubMed] [Google Scholar]
- Pronier E, Almire C, Mokrani H, Vasanthakumar A, Simon A, da Costa Reis Monte Mor B, Masse A, Le Couedic JP, Pendino F, Carbonne B, et al. Inhibition of TET2-mediated conversion of 5-methylcytosine to 5-hydroxymethylcytosine disturbs erythroid and granulomonocytic differentiation of human hematopoietic progenitors. Blood. 2011;118:2551–2555. doi: 10.1182/blood-2010-12-324707. [DOI] [PMC free article] [PubMed] [Google Scholar]
- Quivoron C, Couronne L, Della Valle V, Lopez CK, Plo I, Wagner-Ballon O, Do Cruzeiro M, Delhommeau F, Arnulf B, Stern MH, et al. TET2 inactivation results in pleiotropic hematopoietic abnormalities in mouse and is a recurrent event during human lymphomagenesis. Cancer Cell. 2011;20:25–38. doi: 10.1016/j.ccr.2011.06.003. [DOI] [PubMed] [Google Scholar]
- Rampal R, Alkalin A, Madzo J, Vasanthakumar A, Pronier E, Patel J, Li Y, Ahn J, Abdel-Wahab O, Shih A, et al. DNA Hydroxymethylation Profiling Reveals that WT1 Mutations Result in Loss of TET2 Function in Acute Myeloid Leukemia. Cell Rep. 2014;9:1841–1855. doi: 10.1016/j.celrep.2014.11.004. [DOI] [PMC free article] [PubMed] [Google Scholar]
- Rohle D, Popovici-Muller J, Palaskas N, Turcan S, Grommes C, Campos C, Tsoi J, Clark O, Oldrini B, Komisopoulou E, et al. An inhibitor of mutant IDH1 delays growth and promotes differentiation of glioma cells. Science. 2013;340:626–630. doi: 10.1126/science.1236062. [DOI] [PMC free article] [PubMed] [Google Scholar]
- Sarry JE, Murphy K, Perry R, Sanchez PV, Secreto A, Keefer C, Swider CR, Strzelecki AC, Cavelier C, Recher C, et al. Human acute myelogenous leukemia stem cells are rare and heterogeneous when assayed in NOD/SCID/IL2Rgammac-deficient mice. J Clin Invest. 2011;121:384–395. doi: 10.1172/JCI41495. [DOI] [PMC free article] [PubMed] [Google Scholar]
- Smith CC, Wang Q, Chin CS, Salerno S, Damon LE, Levis MJ, Perl AE, Travers KJ, Wang S, Hunt JP, et al. Validation of ITD mutations in FLT3 as a therapeutic target in human acute myeloid leukaemia. Nature. 2012;485:260–263. doi: 10.1038/nature11016. [DOI] [PMC free article] [PubMed] [Google Scholar]
- Snow JW, Trowbridge JJ, Fujiwara T, Emambokus NE, Grass JA, Orkin SH, Bresnick EH. A single cis element maintains repression of the key developmental regulator Gata2. PLoS Genet. 2010;6:e1001103. doi: 10.1371/journal.pgen.1001103. [DOI] [PMC free article] [PubMed] [Google Scholar]
- Tahiliani M, Koh KP, Shen Y, Pastor WA, Bandukwala H, Brudno Y, Agarwal S, Iyer LM, Liu DR, Aravind L, Rao A. Conversion of 5-methylcytosine to 5-hydroxymethylcytosine in mammalian DNA by MLL partner TET1. Science. 2009;324:930–935. doi: 10.1126/science.1170116. [DOI] [PMC free article] [PubMed] [Google Scholar]
- Traina F, Visconte V, Elson P, Tabarroki A, Jankowska AM, Hasrouni E, Sugimoto Y, Szpurka H, Makishima H, O’Keefe CL, et al. Impact of molecular mutations on treatment response to DNMT inhibitors in myelodysplasia and related neoplasms. Leukemia. 2014;28:78–87. doi: 10.1038/leu.2013.269. [DOI] [PubMed] [Google Scholar]
- Wang F, Travins J, DeLaBarre B, Penard-Lacronique V, Schalm S, Hansen E, Straley K, Kernytsky A, Liu W, Gliser C, et al. Targeted inhibition of mutant IDH2 in leukemia cells induces cellular differentiation. Science. 2013;340:622–626. doi: 10.1126/science.1234769. [DOI] [PubMed] [Google Scholar]
- Welch JS, Ley TJ, Link DC, Miller CA, Larson DE, Koboldt DC, Wartman LD, Lamprecht TL, Liu F, Xia J, et al. The origin and evolution of mutations in acute myeloid leukemia. Cell. 2012;150:264–278. doi: 10.1016/j.cell.2012.06.023. [DOI] [PMC free article] [PubMed] [Google Scholar]
- Wong DJ, Liu H, Ridky TW, Cassarino D, Segal E, Chang HY. Module map of stem cell genes guides creation of epithelial cancer stem cells. Cell Stem Cell. 2008;2:333–344. doi: 10.1016/j.stem.2008.02.009. [DOI] [PMC free article] [PubMed] [Google Scholar]
- Xie M, Lu C, Wang J, McLellan MD, Johnson KJ, Wendl MC, McMichael JF, Schmidt HK, Yellapantula V, Miller CA, et al. Age-related mutations associated with clonal hematopoietic expansion and malignancies. Nat Med. 2014;20:1472–1478. doi: 10.1038/nm.3733. [DOI] [PMC free article] [PubMed] [Google Scholar]
- Zuber J, Radtke I, Pardee TS, Zhao Z, Rappaport AR, Luo W, McCurrach ME, Yang MM, Dolan ME, Kogan SC, et al. Mouse models of human AML accurately predict chemotherapy response. Genes Dev. 2009;23:877–889. doi: 10.1101/gad.1771409. [DOI] [PMC free article] [PubMed] [Google Scholar]
Associated Data
This section collects any data citations, data availability statements, or supplementary materials included in this article.