

Abstract
DNMT1, the most abundant human methyltransferase, is responsible for translating the correct methylation pattern during DNA replication, and aberrant methylation by DNMT1 has been linked to tumorigenesis. We have developed a sensitive signal-on electrochemical assay for the measurement of DNMT1 activity in crude tissue lysates. We have further analyzed ten tumor sets and found a direct correlation between DNMT1 hyperactivity and tumorous tissue. In the majority of samples analyzed, the tumorous tissue has significantly higher DNMT1 activity than the healthy adjacent tissue. No such correlation is observed in measurements of DNMT1 expression by quantitative PCR, DNMT1 protein abundance by Western blotting, or DNMT1 activity using a radiometric DNA labeling assay. DNMT1 hyperactivity can result from both protein overexpression and/or enzyme hyperactivity. DNMT1 activity measured electrochemically provides a direct measure of activity in cell lysates and, as a result, provides a sensitive and early indication of cancerous transformation.
Graphical Abstract
INTRODUCTION
Colorectal cancer is the third most prevalent cancer worldwide, causing approximately 700,000 mortalities annually (Forman et al., 2013). The study of the causes of this disease is especially important, as its diagnosis is on the rise among people under the age of 50, and one of the major causes of mortality from this disease is metastasis due to its late detection (Mandelblatt et al., 1996). Many molecular factors have been found to contribute to the onset of this disease, including a host of genetic mutations (Fearon and Vogelstein, 1990, Lengauer et al., 1997, Liu et al., 1995, Vogelstein and Kinzler, 2004) and epigenetic modifications (Jones and Laird, 1999, Feinberg and Tycko, 2004, Jones and Baylin, 2002, Frigola et al., 2006), as well as the inactivation of DNA repair pathways (Leach et al., 1993, Lynch and de la Chapelle, 2003, Jin and Robertson, 2012).
While many factors likely contribute to the initiation and development of colorectal cancer, epigenetic modifications are of special interest, as they are connected to the progression of a variety of cancers (Sharma et al., 2010, Esteller, 2008). DNA methylation in particular has garnered significant interest, as aberrant DNA methylation has been found to be a hallmark of many cancers (Baylin and Herman, 2000, Esteller, 2007), including colorectal cancer (Toyota et al., 1999). Genomic hypermethylation is often found in colorectal cancer and has been linked to the methylation of tumor suppressor genes and genes for DNA repair proteins, leading to their silencing and therefore tumorigenesis (Esteller et al., 2001, Fearon and Vogelstein, 1990, Esteller et al., 2000).
In humans, there are two classes of methyltransferases: de novo methyltransferases (DNMT3a, DNMT3b, and DNMT3L) and maintenance methyltransferases (DNMT1). De novo methyltransferases are in relatively low copy number and are responsible for establishing methylation patterns on the genome, meaning that they have a large preference for unmodified DNA (Okano et al., 1999). In contrast, DNMT1, the most abundant mammalian methyltransferase, is a maintenance methyltransferase responsible for transferring the genomic methylation pattern from the parent DNA strand to the daughter strand during DNA replication (Bestor, 2000). Because of its vital role in maintaining genomic methylation patterns during DNA replication, DNMT1 may be important in these molecular transformations that lead to the development of colorectal cancer.
Despite the potential importance of DNMT1 activity in disease initiation and progression, there is currently no clinical test for its activity. Generally, quantitative PCR (qPCR), which can be used to quantify gene expression of this protein, is used as a correlative measurement for the total amount of DNMT1 present (El-Deiry et al., 1991). Other methods, such as bisulfite sequencing (Toyota et al., 1999, Zou et al., 2002), are used to detect specific, disease-relevant methylation patterns for early clinical diagnosis. However, such techniques are very costly and have limited efficacy (Munteanu and Mastalier, 2014). In order to obtain a direct measure of methyltransferase activity, the current laboratory gold standard involves radiolabeling DNA with a tritium-labeled methyl group (Fraga and Esteller, 2002). This assay not only produces relatively high variability but also requires the use of radioactivity and specialized instrumentation for measurement, making it impractical for clinical use.
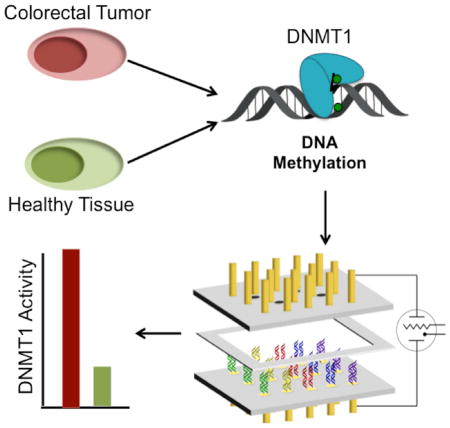
We have previously developed an electrochemical method for the assessment of DNMT1 activity from crude cultured cell and tissue lysate (Furst et al., 2014). This assay is conducted on a multiplexed, two working electrode platform (Figure 1) that enables electrochemical readout from disperse DNA monolayers with signal amplification and no necessary background correction. With this platform, low-density DNA monolayers are formed through electrochemical activation of an inert copper precatalyst into an active catalyst (Furst et al., 2013). Electrochemical readout is accomplished through the measurement of current generated from a catalytic cycle. In this cycle, DNA-mediated charge transport reduces an intercalative redox probe, methylene blue, to leucomethylene blue. This form of the probe has a reduced affinity for DNA, destacking from the helix and entering solution. In solution, leucomethylene blue reduces the ferricyanide electron sink to ferrocyanide, in turn becoming reoxidized to methylene blue. Amplified DNA-mediated electrochemical signals are generated without necessitating background correction through the detection of the current generated from the reoxidation of ferrocyanide at the secondary electrode array, which is proportional to the amount of ferrocyanide present (Figure 2). This cycling enables significant signal amplification, leading to very sensitive detection. Using this sensitive detection platform, the methylation state of DNA can be assayed easily. Bound to the electrode is a hemi-methylated oligonucleotide duplex. Methylation of this DNA substrate is converted into an electrochemical signal through treatment of the hemi-methylated DNA bound to the electrode with a methylation-specific restriction enzyme; if the DNA oligonucleotide on the electrode has been fully methylated by DNMT1, restriction is inhibited and the electrochemical signal remains large. On the other hand, if the DNA is not further methylated by DNMT1, the restriction enzyme cuts the DNA, and the signal, reflecting the amount of DNA, is significantly diminished (Figure 2) (Muren and Barton, 2013). Thus the assay is rapid, requires no background correction or complex instrumentation, and requires only 500 μg of tissue per electrode, which is significantly less sample than is currently required with a biopsy (Furst et al., 2014).
Figure 1.

Electrochemical array for DNMT1 activity detection. The array contains two sets of fifteen gold electrodes, each embedded in a Teflon plate. Each electrode has a 1 mm diameter. The two complementary Teflon arrays are assembled with a 150 μm spacer between them, which was previously determined to be the optimal distance such that signals are not diffusion-limited.29 The electrodes of the primary (bottom) array are modified with DNA of the desired sequences such that DNA-mediated charge transport is detectable. The electrodes of the secondary (top) array are bare for electrochemical detection.
Figure 2.

Signal-on electrochemical assay for DNMT1 detection. Left: The bottom electrode modified with a dilute DNA monolayer is responsible for generating electrochemical signals through DNA-mediated charge transport (CT) amplified by electrocatalysis. Methylene blue (MB+), a DNA intercalating redox probe, is reduced by DNA CT to leucomethylene blue (LB), where it can interact with an electron sink, ferricyanide. Upon interaction, ferricyanide is reduced to ferrocyanide, reoxidizing leucomethylene blue to methylene blue in the process. Current is generated and detected at the secondary electrode from the reoxidation of ferrocyanide. The current generated is proportional to the amount of ferrocyanide oxidized, which depends on the amount of methylene blue reduced by DNA CT and dissociated. To detect DNMT1, crude lysate (multicolored shapes in background) is added to the electrode. If DNMT1 (blue heart) is capable of methylating the hemi-methylated DNA substrate (green arrows), the DNA on the electrode becomes fully methylated. If the protein is not active, the DNA remains hemi-methylated (red arrows). The lysate is washed away prior to the addition of the restriction enzyme. A methylation-specific restriction enzyme (BssHII, brown heart) is then added that cuts the hemi-methylated DNA (red arrow), decreasing the amount of bound methylene blue and significantly attenuating the electrochemical signal, while leaving the fully methylated DNA untouched. Constant potential amperometry (right) is used to measure the percent change before and after restriction enzyme treatment. If the restriction enzyme did not affect the DNA (top), the signals overlay. If, however, the restriction enzyme cuts the DNA, the signal is significantly attenuated (bottom). Constant potential amperometry is run for 90 s with a 320 mV potential applied to the secondary electrode and a −400 mV potential applied to the primary electrode relative to an AgCl/Ag reference. All scans are in Tris buffer (10 mM Tris, 100 mM KCl, 2.5 mM MgCl2, 1 mM CaCl2, pH 7.6) with 4 μM methylene blue and 300 μM potassium ferricyanide.
Using this platform, we evaluate DNMT1 activity in ten sets of tumor tissue and healthy adjacent tissue, as well as in cultured colorectal carcinoma and normal colon cells. Significantly more DNMT1 activity is observed electrochemically in the majority of the tumor samples as compared to their healthy tissue counterparts, making this assay promising as an early clinical diagnostic for cancerous transformations.
RESULTS
DNMT1 Activity Measured Electrochemically
The electrochemical assay for DNMT1 activity involves the signal-on detection of methylation events on synthetic substrate DNA tethered to an electrode surface (Muren and Barton, 2013). The process involves two steps: first, the pure methyltransferase or crude lysate is added to the surface. Subsequently, a methylation-specific restriction enzyme is used to cut any DNA that was not methylated during the previous treatment step. Successful methylation, resulting in protection from a methylation-specific restriction enzyme, maintains an electrochemical signal (Figure 2), while inactivity of the methyltransferase on the DNA-modified surface results in a significantly diminished electrochemical signal following restriction enzyme treatment.
When pure DNMT1 is titrated onto a DNA-modified electrode modified with hemi-methylated DNA, a binding curve is generated, and a binding constant can be extracted based on the percent of the electrochemical signal that remains following restriction of the substrate DNA. A similar binding curve is generated from the addition of pure DNMT1 to the lysate of 4000 HCT116 DNMT1−/− cultured cells (the previously determined optimal lysate concentration for DNMT1 activity detection) (Furst et al., 2014). The titration data, along with the curve fit to the Hill binding model, are shown in Figure 3. Based on the inflection point of this curve, a KD of pure DNMT1 on this DNA-modified electrode is found to be 31±1.3 nM, and 32±1.8 nM for pure DNMT1 in HCT116 DNMT1−/− lysate. These values are in good agreement with previously determined values for the KD of DNMT1 in solution (26 nM) (Lee et al., 2005). A surface KD on the same order as solution values indicates that not only is our platform especially sensitive for the detection of this protein but also that the morphology of the DNA on our surface mimics the native substrate for the DNMT1 protein, allowing full access of the protein to the DNA bound to the surface.
Figure 3.
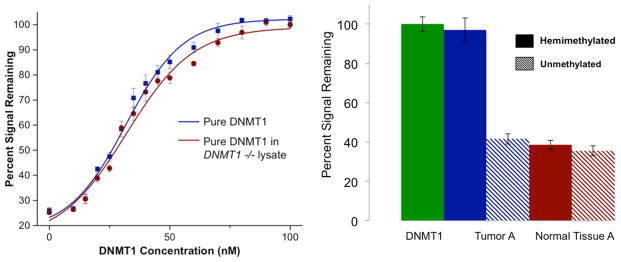
Detection of DNMT1 in pure form and from crude lysate. A titration of pure DNMT1 protein (left) demonstrates the sensitivity of this method of detection. In blue is shown the titration of pure DNMT1 on our electrodes, while in red is shown pure DNMT1 added to HCT116 DNMT1−/− cultured cell lysate. When the data are fit to a Hill binding model (fits shown as solid traces in plot), a KD of 31±1.3 nM protein is extracted for pure DNMT1 and 32 nM±1.8 nM for DNMT1 added to lysate. The data from an array used to measure the DNMT1 activity from tumor A (right) show the differential between active lysate on electrodes and inactive lysate. The green bar shows electrodes treated with 65 nM pure DNMT1 as a positive control. The blue bars show electrodes treated with tumor A lysate on hemi-methylated substrate (solid) and unmethylated substrate (dashed). The red bars show electrodes treated with adjacent normal tissue A lysate on hemi-methylated DNA (solid) and unmethylated DNA (dashed). As can be seen, a significantly higher amount of signal protection is observed for the tumor tissue on the hemi-methylated substrate than for the adjacent normal tissue on that substrate. The error bars show standard error across three electrodes.
Similarly, the differential signal protection from tumor and adjacent healthy tissue sets can be measured electrochemically. Ten tumor sets (A–J), which were received snap frozen with no further treatment, were evaluated, and an example (tissue set A) is shown in Figure 3. Electrochemical data for this set show significant DNMT1 hyperactivity in the tumor sample as compared to the normal adjacent tissue over several replicates. With the data shown, an electrochemical assay using pure, isolated DNMT1 (green bar in Figure 3) is always included as a positive control. Also it should be noted that the tumor lysate as well as the adjacent healthy tissue lysate are tested for methyltransferase activity using both a hemi-methylated and an unmethylated DNA substrate. It is clear, even without normalization to the healthy adjacent tissue, that tumor A has significantly more DNMT1 activity than the healthy tissue. Additionally, the incorporation of a comparison between the hemi-methylated and unmethylated substrates ensures that the activity we monitor is specific to DNMT1, and not to any de novo methyltransferases, given the noted preference of DNMT1 for a hemi-methylated substrate (Hermann et al., 2004).
The data for each tissue set tested (A–J) have been aggregated into a single graph indicating the fold excess of DNMT1 activity in the tumor tissue as compared to the normal adjacent tissue (Figure 4). To calculate fold excess, each tumor and adjacent normal tissue have been normalized for the signal protection for the unmethylated DNA substrate to account for methylation that is not DNMT1-specific. Subsequently, the tumor tissue value is normalized to the adjacent healthy tissue, producing a ratio. If the fold excess is >1, the DNMT1 activity in the tumor is higher than in the adjacent tissue. A fold excess of <1 indicates lower activity in the tumor relative to the healthy tissue, while a value of 1 indicates equivalent expression. As can be seen in Figure 4, none of the tumors exhibits lower DNMT1 activity than their healthy tissue counterparts. In fact, the vast majority of the samples show significantly higher activity of DNMT1 as compared to the healthy tissue.
Figure 4.
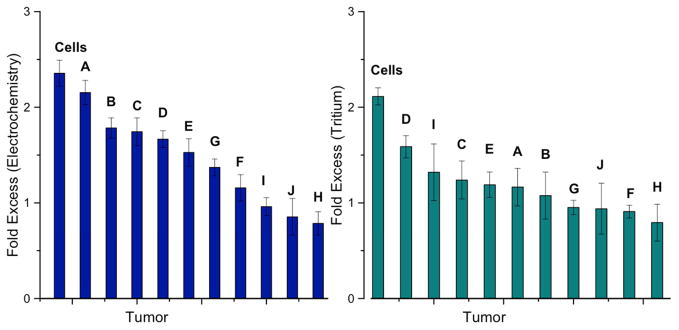
DNMT1 activity measured electrochemically and radioactively. The fold excess activity measured electrochemically (left) shows hyperactivity (fold excess > 1) in all but two of the tissue samples. Those that do not show hyperactivity show equivalent DNMT1 activity between tumor and normal tissue (fold excess ~1). When DNMT1 activity is measured with radioactive labeling (right), the same hyperactivity is not observed likely because the measurement is convoluted by genomic DNA in the lysate samples. In both cases, the data for both the tumor and normal tissue on the hemi-methylated substrate are first normalized to that of the unmethylated substrate, and the data for the tumor tissue are then normalized to the normal adjacent tissue. Data for hemimethylated substrates without normalization to unmethylated substrates are shown in Figures S1 and S2. Each of the letters represents one of the tumor and healthy adjacent tissue sets, and the bar denoted ‘cells’ represents the result from the comparison between HCT116 colorectal carcinoma and healthy CCD-18Co cultured cells.
Radiometric Assay for DNMT1 Activity
In addition to measuring DNMT1 activity with our electrochemical assay, the current generally used radiochemical assay for DNMT1 activity (Fraga and Esteller, 2002) was used to assess the ten tumor samples. This assay involves the addition of substrate DNA and tritium-labeled S-Adenosyl methionine (SAM) cofactor, the source of methyl groups, to crude lysate or pure DNMT1. Protein activity is extrapolated from the amount of radioactive methylation added to the DNA following incubation, determined through scintillation counting of the samples in triplicate. Just as with the electrochemical assay, both hemi-methylated and unmethylated substrate DNA were tested with the crude lysate for methylation. Analogously to the electrochemical assay, the resulting fold excess determination is calculated based on the ratio of hemi-methylated substrate to unmethylated substrate counts for the tumor sample normalized to the hemi-methylated divided by the unmethylated counts for the normal tissue. As can be seen in Figure 4, although the trend in fold excess activity is similar for tritium labeling as for electrochemistry, the extent of hyperactivity is diminished across all samples. Additionally, the majority of the samples have essentially statistically equivalent activity measured in this manner. This is, in part, due to the correction for the activity on unmethylated DNA. In this assay, genomic DNA from the lysate remains in the reaction mixture and is therefore capable of being methylated and contributing to the overall activity, even though it is not the target substrate. This seems to have led to higher activity in the unmethylated substrate samples for the tumors in many cases, which, when corrected, may lead to overall lower fold excess activity. The values that simply compare the hemi-methylated tumor counts to their normal tissue counterparts are shown in Figures S1 and S2. Because of this large difference, tritium labeling of DNA appears to be a less precise measurement of specific DNMT1 activity from lysate than electrochemical measurements.
DNMT1 Expression Measured by RT-qPCR
Currently, the most common method to analyze methyltransferases from lysate is through evaluation of genomic expression of the methyltransferase of interest. Thus, as a baseline with which to compare our electrochemical data, the expression of the DNMT1 gene in each tumor and adjacent healthy tissue sample was evaluated by reverse transcription-quantitative PCR (RT-qPCR). A relative quantification method was used to determine the fold excess of DNMT1 gene expression in the tumor sample as compared to the adjacent normal tissue sample. For each set of samples, the relative abundance of DNMT1 is first normalized to the expression of β-Actin in each sample, followed by comparison between the normal tissue and tumor tissue. A fold excess of DNMT1 from each tumor and normal tissue pair is calculated, and a value of >1 indicates higher expression in the tumor as compared to the normal tissue, <1 indicates lower expression in the tumor as compared to the healthy tissue, and a value of 1 indicates equivalent expression.
Multiple primer sets were evaluated for consistency over multiple trials, and the most consistent results were obtained with RealTime Primers, which were used for both DNMT1 and β-Actin quantification by RT-qPCR. As can be seen in Figure 5, there is a large degree of variability among the ten tumor sets regarding the overexpression of DNMT1 in the tumors as compared to the normal adjacent tissues. Sample B has the most significant upregulation, with a 22±5 fold excess of DNMT1 expression, while sample G has significant downregulation of DNMT1 in the tumor sample, with a fold excess of 0.3±0.1. Overall, no trends were observed with regards to the expression of DNMT1 among these samples; tumors A, B, E, F, as well as the HCT116 cells compared to the CCD-18Co cells all have significant upregulation of DNMT1 in the tumor tissue. Samples C, D, and I have equivalent DNMT1 expression compared to adjacent tissue, while samples G, H, and J have significant downregulation of DNMT1 in the tumors.
Figure 5.
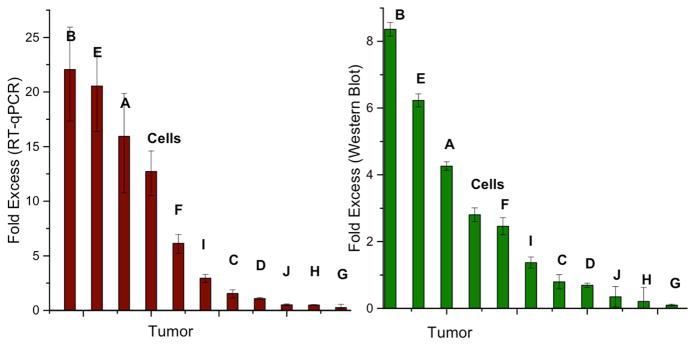
DNMT1 expression and DNMT1 protein quantification. The fold excess DNMT1 expression is determined with RT-qPCR (left), which shows just as many samples with overexpression of DNMT1 in the tumor (fold excess > 1) as with equivalent expression (fold excess ~1) and underexpression (fold excess < 1). The RT-qPCR expression data for DNMT1 expression in the tumor tissue are normalized to that of the normal adjacent tissue. The error represents the standard error across four replicates. The DNMT1 protein content (right), determined by Western blot, follows the same trend as the fold excess DNMT1 expression; overexpression in the tumor sample correlates to more protein in that sample as compared to the normal adjacent tissue. The same trends are observed for those samples with equivalent expression and underexpression. For DNMT1 protein quantification, the measured intensity of the DNMT1 band is normalized to the Lamin A loading control, and subsequently, data for the tumor tissue are normalized to the normal adjacent tissue. Error bars represent standard error across four sets of Western blots. Sample bands used for quantification are shown in Figure S3. Each of the letters represents one of the tumor and healthy adjacent tissue sets, and the bar denoted ‘cells’ represents the result from the comparison between HCT116 colorectal carcinoma and healthy CCD-18Co cultured cells.
Protein Content Measured by Western Blot
In addition to DNMT1 expression evaluated by RT-qPCR, the total DNMT1 protein content of each tissue sample was evaluated by Western blotting. Total nuclear protein (60 μg) was added to each lane, and the amount of DNMT1 protein in the tumor tissue as compared to the healthy adjacent tissue was determined through quantification of the bands resulting from the Western blot (Figure 5). Again, a large amount of variability is observed in the total amount of DNMT1 within each lysate sample. The bands for DNMT1 protein as well as the nuclear protein Lamin A, used as a loading control, are given in Figure S3. Importantly, the ratio of DNMT1 in the tumor as compared to the normal adjacent tissue correlates directly to the fold excess of the DNMT1 gene expression quantified by RT-qPCR.
Figure 6 then compares our electrochemical measurement of activity for the various tumor samples, normalized to the adjacent healthy tissue, with DNMT1 expression, also normalized. Remarkably, as is evident in the Figure, there is no correlation between expression levels and resultant activity. While, for example, sample D has comparable expression levels in the tumor and adjacent tissue, the protein is found to be hyperactive electrochemically. In the case of sample B, the high activity seen electrochemically appears instead to be a function of the very high expression levels. Thus the electrochemical measurements allow a clear determination of methyltransferase activity associated with a given sample, and comparisons with expression and/or Western blotting permit the evaluation of whether the high activity in a given tumor sample results from high protein content or protein hyperactivity. The electrochemical assay is seen to provide the most direct measure of DNMT1 activity, not simply its cellular abundance.
Figure 6.
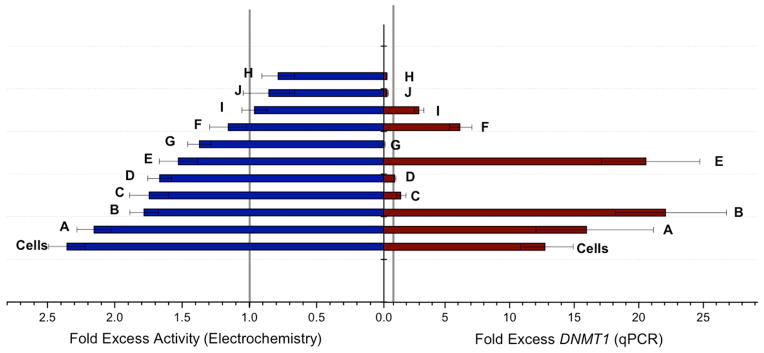
Direct comparison between DNMT1 activity measured electrochemically and DNMT1 expression. The two bar graphs directly compare the fold excess protein activity (blue) measured electrochemically and the fold excess gene expression (red). There is no correlation evident between the amount of expression of DNMT1 and the eventual activity of DNMT1 found in the tissue.
DISCUSSION
The electrochemical platform developed for the measurement of DNMT1 activity allows the detection of this protein from crude cultured cell and colorectal tissue lysates. However, the utility of this platform for potential clinical diagnostic applications rests in the analysis of many samples. Here, ten tumor samples and adjacent healthy tissue have been evaluated. Our electrochemical platform facilitates extremely sensitive protein detection, with femtomole detection limits for the DNMT1 protein (Furst et al., 2014). Furthermore, the electrochemical assay is a signal-on method of detection, ensuring specific DNMT1 discrimination from a host of proteins, DNA and RNA fragments found in crude lysates. Importantly, measurements of methyltransferase activity using the hemi-methylated versus unmethylated substrate distinguishes the methyltransferase activity as associated with DNMT1 versus other methyltransferases, since only DNMT1 is preferentially active on the hemi-methylated substrate (Hermann et al., 2004).
From the electrochemical analysis of the ten samples tested, in addition to lysate from cultured colorectal carcinoma cells, a pattern was found to emerge. Hyperactivity in the tumor samples as compared to the normal tissue is clearly found in the majority of tissue specimens analyzed. Furthermore, the few samples that did not show hyperactivity in the tumor tissue have equal activity between the tumor and healthy tissue. In fact, a one-way ANOVA analysis of variance between the tumor and normal adjacent tissue DNMT1 activity was performed. Despite our small sample size (10), we found a confidence level of p < 0.05, indicating a 95% confidence that the DNMT1 activity in the tumor tissues is different from the healthy adjacent tissues.
Currently, the most prevalent method of methyltransferase activity measurement is a radioactivity assay involving the application of tritium-labeled SAM cofactor to the methyltransferase of interest in pure form or in a mixture from crude lysate (Furst et al., 2014). Substrate DNA is added to the reaction, and activity is measured based on scintillation counts resulting from tritium-labeled methyl groups added to DNA. This assay is also used here as a comparison to our electrochemical assay. The results from this activity assay, however, show less hyperactivity in the tumor samples as compared to the electrochemical assay. Indeed, the radioactivity assay does not show for most samples a statistically clear hyperactivity of DNMT1 in tumorous tissue. This lack of a clean correlation is likely due to methylation of genomic DNA present in the lysate, which is inseparable from measurements of the methylation of the synthetic, target DNA added to the reaction. Tritium labeling, therefore, does not provide a pure measurement of DNMT1 activity on a target substrate when measured from lysate, as methylation of native DNA can affect the levels of methylation measured and therefore, the ratio of methylation on hemi-methylated versus unmethylated substrates. It is especially important to note that this is not a problem with our electrochemical assay, as the only DNA methylation events that contribute to the electrochemical signal are those that occur on the target DNA in the electrochemical device. Noteworthy also is that the tritium-based assay is not suitable for clinical applications due to the large amounts of reagents required and the necessity of radioactivity for detection.
Perhaps more important in the context of clinical relevance is the comparison of DNMT1 activity measurements to the primary method currently applied in analysis of clinical samples: gene expression of the DNMT1 gene by RT-qPCR. Many studies have focused on correlations between the expression of this methyltransferase gene and tumorigenesis (El-Deiry et al., 1991, De Marzo et al., 1999, Peng et al., 2005, Girault et al., 2003). However, upon analysis of the ten sample sets involved in this study, no such correlation is observed. There are just as many samples that have upregulation of DNMT1 in tumors as equivalent expression and underexpression. We also observe no correlation between the activity of DNMT1 in a sample and its gene expression level as measured by RT-qPCR. Thus while RT-qPCR has potential applications for general research regarding methyltransferases, in and of itself, it is insufficient as a diagnostic to identify potentially tumorous transformations.
Western blotting for total DNMT1 protein content in the lysate samples yields similar results as RT-qPCR. The DNMT1 protein levels are found to correlate to the expression of DNMT1, but not to the activity of the protein measured electrochemically. This finding indicates that it is not simply the amount of protein present that is responsible for the hyperactivity in the tumor samples observed electrochemically. Electrochemical measurement of DNMT1 activity is not a measure of the total amount of DNMT1, but instead of the methylase activity of the DNMT1 protein on the hemi-methylated substrate present in the sample. Based on the finding that the amount of DNMT1 does not directly correlate to the activity of this protein present in the sample, it is likely that other post-translational factors must influence the activity of DNMT1 (Roundtree et al., 2000, Smallwood et al., 2007).
If one considers the various sources of changes in protein activity, it is understandable that the electrochemical assay, which directly measures the methyltransferase activity on a hemi-methylated target, would yield the clearest diagnostic for DNMT1 as a source of epigenetic change within a given tissue. Measurement of protein activity is closest in time and space to the epigenetic changes responsible for cancerous transformation, certainly as compared to the measurement of mRNA for the methyltransferase, which reflects effects on transcription, and even measurements of the abundance of protein, reflecting the status of DNMT1 following translation. What is key for cancerous transformation is the activity itself, turning on and off given genes as a result of methylation. The fact that only some of the tumorigenic changes in a sample depend on the amount of DNMT1, measured by Western blot or expression levels, underscores that point; tumorigenic changes are also seen to depend upon enzymatic hyperactivity of a given DNMT1. In developing assays for epigenetic changes as a source of tumorigenic change, this point needs to be kept in mind. In sum, then, using our electrochemical data, it is clear that tumorigenesis does indeed correlate with DNMT1 hyperactivity, and hence the electrochemistry provides a useful early and sensitive diagnostic for cancerous transformation.
SIGNIFICANCE
We have developed an electrochemical platform based upon DNA charge transport for the measurement of DNMT1 activity from crude lysate samples. Using this platform to analyze ten colorectal carcinoma samples, as well as cultured colorectal carcinoma cells, we find a direct correlation between hyperactivity of DNMT1 and tumorous tissue. Significant hyperactivity of the protein is found in the majority of samples. This hyperactivity does not correlate with either overexpression or total amount of DNMT1 within the sample. Instead, significant enzyme hyperactivity is frequently evident. Furthermore, DNMT1 hyperactivity as an indicator of cancerous transformation, measured electrochemically, is not cleanly observed with the current standard techniques of DNMT1 analysis, including tritium labeling, RT-qPCR, and Western blotting. Thus our electrochemical platform has the potential to provide a sensitive method of detecting DNMT1-related cancerous transformations and with greater reliability than current DNMT1 analysis techniques.
EXPERIMENTAL PROCEDURES
RT-qPCR
Total RNA was extracted from 30 mg of tissue and 3,000,000 cultured cells of each cell type. Tissue samples were received snap frozen with no further treatment. Tissue samples were homogenized in a total RNA extraction lysis buffer from a RNEasy kit (Qiagen). The total RNA extracted using this kit was eluted into a 300 microliters of RNAse-free water.
Following RNA isolation, RT-PCR was performed to make a complete cDNA library using a Transcription First Strand cDNA Synthesis kit (Roche) and standard RT-PCR thermocycler conditions (C1000 Touch™ Thermal Cycler, Bio-Rad). Total cDNA concentrations were determined by nanodrop. For these samples, 250 ng/μL of total DNA was used.
Three DNMT1 primer sets were evaluated for consistency and reproducibility. β-Actin expression was evaluated to normalize the DNMT1 results with primers from RealTime Primers; GAPDH was also evaluated as a housekeeping gene but was observed to be extremely variable. DNMT1 primers were obtained from RealTime Primers, qSTAR and Genocopeiea. DNMT1 primers from RealTime primers were found to have the most consistent results over multiple trials, and were therefore used for all tissue sample evaluation. Each sample was run in quadruplicate for RT-qPCR measurements. RT-qPCR was performed on a CFX 96 Real-Time PCR Detection system (Bio-Rad). RT-qPCR results were calculated using a relative quantification method, with the Ct to determine fold excess of the mRNA between the adjacent normal and tumor tissue. Error was propagated through the experiment for four samples of each primer and sample set.
Cell and Tumor Preparation for 3H and Electrochemistry
100 mg of each tissue sample was prepared as a crude cell lysate. Tissue samples were homogenized before nuclear isolation using a 3 mL homogenizer with 100 strokes of the pestle. Cultured cells were harvested upon confluence (approximately 7,000,000 cells) and taken directly to rinsing. Both tissue and cultured cells were rinsed with 1 mL phosphate buffer (5 mM phosphate, 50 mM NaCl, pH 7.0) and centrifuged. The tissue and cells were then prepared with a commercial NE-PERTM Nuclear and Cytoplasmic Extraction kit (Thermo Scientific). Following nuclear lysis, the lysate was buffer exchanged with a 10 kDa spin column into DNMT1 reaction buffer (50 mM Tris HCl, 1 mM EDTA, 5% glycerol, pH 7.8), flash frozen and stored at −80° C.
Once the nuclear lysate was aliquotted and frozen, total protein concentrations were determined using a bicinchoninic acid (BCA) assay kit (Pierce) for protein concentration. Concentrations of lysate were found to range from 1000–6000 μg/mL of protein. For all assays, tissue samples were normalized to total protein concentration.
3H Assay
Tritium assays were performed using the protocol previously established in our lab (Muren and Barton, 2013). The DNA used as a substrate for electrochemical measurements, with sequences provided in the Supplemental Information, including the hexynyl terminal modification, was used in this radioactive methyltransferase activity assay. 0.5 μCi 3H-SAM with 20 μM DNA, 100 μg/mL of BSA, and lysate (final concentration of 500 μg/mL total protein) were combined to a total volume of 20 μL in DNMT1 reaction buffer (50 mM Tris HCl, 1 mM EDTA, 5% glycerol, pH 7.8). Samples with purified DNMT1 (BPS Biosciences) were used as a positive standard, along with a negative standard with no methyltransferase. Reactions were incubated for 2 h at 37 °C, followed by quenching with 30 μL of 10% TCA in water. The solutions were then spotted onto DE81 filter paper (Whatman) and air-dried for 15 minutes. Each filter paper was then washed by individually soaking it in 10 mL of 50 mM Na2HPO4 for 15 minutes, followed by rinsing with 50 mM Na2HPO4 and 95% ethanol. Filter papers were heated to 37 °C to dry for 15 minutes before liquid scintillation counting. Fold excess for radioactive measurements of a given tumor set was determined by taking the ratio of the counts for the tumor lysate on the hemi-methylated substrate to the tumor lysate on the unmethylated substrate divided by that same ratio for the normal tissue lysate.
Electrochemistry
Electrochemistry was performed on a bipotentiostat (CHInstruments 760E) with two working electrodes, a platinum counter electrode and an AgCl/Ag reference electrode. Constant potential amperometry electrochemical measurements were recorded for 90 seconds with an applied potential of 320 mV to the secondary electrode and −400 mV to the primary electrode. Constant potential amperometry measurements were performed in Tris buffer (10 mM Tris, 100 mM KCl, 2.5 mM MgCl2, 1 mM CaCl2, pH 7.6) with 4 μM methylene blue and 300 μM potassium ferricyanide. Scans were taken individually at each of the 15 secondary pin electrode sets. The percent signal remaining data are reported as compared to pure DNMT1, with variation in the data representing the standard error across three measurements of three electrodes, all at a given condition.
To incubate electrodes with desired proteins, a 1.25 mm deep Teflon spacer was attached to the primary electrode surface with clips to form an isolated 4 μL volume well around each electrode. Generally, three electrodes on the device were incubated with 65 nM DNMT1 and 160 μM SAM and 100 μg/mL BSA as a positive control. For electrodes incubated with lysate, the lysate was diluted to a final concentration of ~200 μg/mL and directly combined with SAM to a final SAM concentration of 160 μM with 50 μg/mL BSA. Three electrodes modified with hemi-methylated DNA were treated with tumor lysate and three treated with adjacent normal tissue lysate. Similarly, three electrodes modified with unmethylated DNA were incubated with tumor lysate and three with normal tissue lysate. Each electrode had 4 μL of the desired solution added to the well. The platform was incubated at 37 °C for 1.5 h in a humidified container. The DNA monolayers were then treated with 1 μM protease solution in phosphate buffer (5 mM phosphate, 50 mM NaCl, pH 7.0) for 1 h, followed by thorough rinsing with phosphate buffer (5 mM phosphate, 50 mM NaCl, pH 7.0) and scanning by constant potential amperometry. The restriction enzyme BssHII was then added at a concentration of 1500 units/mL for 1.5 h at 37 °C. BssHII was prepared by buffer exchange into DNMT1 reaction buffer (50 mM Tris HCl, 1 mM EDTA, 5% glycerol, pH 7.8) using a size exclusion column (10 kDa, Amicon). The electrodes were again rinsed with phosphate buffer and scanned. Results from three trials per tumor sample were aggregated and averaged. Fold excess for electrochemical measurements of a given tumor set was determined by taking the ratio of the percent signal remaining for the tumor lysate on the hemi-methylated substrate to the tumor lysate on the unmethylated substrate divided by that same ratio for the normal tissue lysate.
Western Blot Analysis of Lysate for DNMT1
The relative amount of DNMT1 protein in each tumor set was established by Western blot. Samples were diluted to a final loading of 60 μg of protein per lane with DNMT1 reaction buffer (50 mM Tris HCl, 1 mM EDTA, 5% glycerol, pH 7.8) and Lammli reagent with betamercaptoethanol. Samples were probe sonicated for 10 seconds at 20% power, followed by boiling at 90 °C for 5 minutes. Samples were loaded onto 4–12% polyacrylamide gels in MOPS SDS buffer (50 mM MOPS, 50 mM Tris base, 0.1% SDS, 1 mM EDTA, pH 7.7) and run at 175 mV for 2.5 hours at 4 °C. Gels were subsequently transferred to membranes with a dry transfer procedure for 1.5 h. Membranes were blocked with 5% milk in TBST (20 mM Tris base, 150 mM NaCl, 0.1% Tween-20, pH 7.6) at room temperature for 1 hour, followed by overnight incubation with a 1° antibody in 5% milk in TBST (1:1000 for DNMT1 (R & D) and 1:1000 for Lamin A (Santa Cruz)). The membranes were then rinsed with TBST buffer. Lamin A membranes were incubated with goat anti-rabbit 2° antibody (Abcam) (1:5000 in 5% milk with 0.02% SDS in TBST) or Donkey Anti Sheep for DNMT1 (Santa Cruz) (1:5000) for 1 hour and then rinsed with TBST. Membranes were scanned on a Li-Cor Odyssey CLx infrared gel scanner, and bands were quantified using Image Studio software.
Supplementary Material
HIGHLIGHTS.
DNMT1 activity is effectively measured electrochemically from tissue samples.
Greater DNMT1 activity is observed in colorectal tumors than in healthy tissue.
Higher DNMT1 activity in tumors does not correlate to the measured amount of DNMT1.
Acknowledgments
We are grateful to the NIH (GM61077) for their financial support of this research.
Footnotes
Author Contributions. A. L. F. conceived of experiments, acquired and analyzed data and wrote the manuscript. J. K. B. conceived of experiments and wrote the manuscript.
Supporting Information Available. Additional experimental details as well as additional quantifications of the electrochemistry and tritium data as well as images of Western blot bands used for quantification are available.
Publisher's Disclaimer: This is a PDF file of an unedited manuscript that has been accepted for publication. As a service to our customers we are providing this early version of the manuscript. The manuscript will undergo copyediting, typesetting, and review of the resulting proof before it is published in its final citable form. Please note that during the production process errors may be discovered which could affect the content, and all legal disclaimers that apply to the journal pertain.
References
- Baylin SB, Herman JG. DNA hypermethylation in tumorigenesis: epigenetics joins genetics. Trends in Genetics. 2000;16:168–174. doi: 10.1016/s0168-9525(99)01971-x. [DOI] [PubMed] [Google Scholar]
- Bestor TH. The DNA methyltransferases of mammals. Human Mol Genet. 2000;9:2395–2402. doi: 10.1093/hmg/9.16.2395. [DOI] [PubMed] [Google Scholar]
- De Marzo AM, Marchi VL, Yang ES, Veeraswamy R, Lin X, Nelson WG. Abnormal Regulation of DNA Methyltransferase Expression during Colorectal Carcinogenesis. Cancer Res. 1999;59:3855–3860. [PubMed] [Google Scholar]
- El-Deiry WS, Nelkin BD, Celano P, Yen RWC, Falco JP, Hamilton SR, Baylin SB. High expression of the DNA methyltransferase gene characterizes human neoplastic cells and progression stages of colon cancer. Proc Natl Acad Sci USA. 1991;88:3470–3474. doi: 10.1073/pnas.88.8.3470. [DOI] [PMC free article] [PubMed] [Google Scholar]
- Esteller M, Toyota M, Sanchez-Cespedes M, Capella G, Peinado MA, Watkins DN, Issa JPJ, Sidransky D, Baylin SB, Herman JG. Inactivation of the DNA Repair Gene O6-Methylguanine-DNA Methyltransferase by Promoter Hypermethylation Is Associated with G to A Mutations in K-ras in Colorectal Tumorigenesis. Cancer Res. 2000;60:2368–2371. [PubMed] [Google Scholar]
- Esteller M, Corn PG, Baylin SB, Herman JG. A Gene Hypermethylation Profile of Human Cancer. Cancer Res. 2001;61:3225–3229. [PubMed] [Google Scholar]
- Esteller M. Cancer epigenomics: DNA methylomes and histone-modification maps. Nat Rev Genet. 2007;8:286–298. doi: 10.1038/nrg2005. [DOI] [PubMed] [Google Scholar]
- Esteller M. Epigenetics in Cancer. N Engl J Med. 2008;358:1148–1159. doi: 10.1056/NEJMra072067. [DOI] [PubMed] [Google Scholar]
- Fearon ER, Vogelstein B. A genetic model for colorectal tumorigenesis. Cell. 1990;61:759–767. doi: 10.1016/0092-8674(90)90186-i. [DOI] [PubMed] [Google Scholar]
- Feinberg AP, Tycko B. The history of cancer epigenetics. Nat Rev Cancer. 2004;4:143–153. doi: 10.1038/nrc1279. [DOI] [PubMed] [Google Scholar]
- Forman D, Bray F, Brewster DH, Gombe MC, Kohler B, Piñeros M, Steliarova-Foucher E, Swaminathan R, Ferlay J, editors. Cancer Incidence in Five Continents, Vol. X electronic version. Lyon: IARC; 2013. [DOI] [PubMed] [Google Scholar]
- Fraga MF, Esteller M. DNA Methylation: A Profile of Methods and Applications. BioTechniques. 2002;33:632–649. doi: 10.2144/02333rv01. [DOI] [PubMed] [Google Scholar]
- Frigola J, Song J, Stirzaker C, Hinshelwood RA, Peinado MA, Clark SJ. Epigenetic remodeling in colorectal cancer results in coordinate gene suppression across an entire chromosome band. Nat Genet. 2006;38:540–549. doi: 10.1038/ng1781. [DOI] [PubMed] [Google Scholar]
- Furst AL, Landefeld S, Hill MG, Barton JK. Electrochemical Patterning and Detection of DNA Arrays on a Two-Electrode Platform. J Am Chem Soc. 2013;135:19099–19102. doi: 10.1021/ja410902j. [DOI] [PMC free article] [PubMed] [Google Scholar]
- Furst AL, Muren NB, Hill MG, Barton JK. Label-free electrochemical detection of human methyltransferase from tumors. Proc Natl Acad Sci USA. 2014;111:14985–14989. doi: 10.1073/pnas.1417351111. [DOI] [PMC free article] [PubMed] [Google Scholar]
- Girault I, Tozlu S, Lindereau R, Bieche I. Expression Analysis of DNA Methyltransferases 1, 3A, and 3B in Sporadic Breast Carcinomas. Clin Cancer Res. 2003;9:4415–4422. [PubMed] [Google Scholar]
- Hermann A, Goyal R, Jeltsch A. The DNMT1 DNA-(cytosine-C5)-methyltransferase Methylates DNA Processively with High Preference for Hemi-methylated Target Sites. J Biol Chem. 2004;279:48350–48359. doi: 10.1074/jbc.M403427200. [DOI] [PubMed] [Google Scholar]
- Jin B, Robertson KD. DNA Methyltransferases, DNA Damage Repair, and Cancer. In: Karpf AR, editor. Epigenetic Alterations in Oncogenesis. New York, United States: Springer New York; 2012. pp. 3–29. [Google Scholar]
- Jones PA, Laird PW. Cancer-epigenetics comes of age. Nat Genet. 1999;21:163–167. doi: 10.1038/5947. [DOI] [PubMed] [Google Scholar]
- Jones PA, Baylin SB. The fundamental role of epigenetic events in cancer. Nat Rev Genet. 2002;3:415–428. doi: 10.1038/nrg816. [DOI] [PubMed] [Google Scholar]
- Leach FS, Nicolaides NC, Papadopoulos N, Liu B, Jen J, Parsons R, Peltomaki P, Sistonen P, Aaltonen LA, Nystron-Lahti M, Guan XY, Zhang J, Meltzer PS, Yu JW, Kao FT, Chen DJ, Cerosaletti KM, Fournier REK, Todd S, Lewis T, Leach RJ, Naylor SL, Weissenbach J, Mecklin JP, Jarvinen H, Petersen GM, Hamilton SR, Green J, Jass J, Watson P, Lynch HT, Trent JM, de la Chapelle A, Kinzler KW, Vogelstein B. Mutations of a mutS homolog in hereditary nonpolyposis colorectal cancer. Cell. 1993;75:1215–1225. doi: 10.1016/0092-8674(93)90330-s. [DOI] [PubMed] [Google Scholar]
- Lee BH, Yegnasubramanian S, Lin X, Nelson WG. Procainamide is a specific inhibitor of DNA methyltransferase 1. J Biol Chem. 2005;280:40749–40756. doi: 10.1074/jbc.M505593200. [DOI] [PMC free article] [PubMed] [Google Scholar]
- Lengauer C, Kinzler KW, Vogelstein B. Genetic instability in colorectal cancers. Nature. 1997;386:623–627. doi: 10.1038/386623a0. [DOI] [PubMed] [Google Scholar]
- Liu B, Nicolaides NC, Markowitz S, Willson JKV, Parsons RE, Jen J, Papadopolous N, Peltomäki P, de la Chapelle A, Hamilton SR, Kinzler KW, Vogelstein B. Mismatch repair gene defects in sporadic colorectal cancers with microsatellite instability. Nat Genet. 1995;9:48–55. doi: 10.1038/ng0195-48. [DOI] [PubMed] [Google Scholar]
- Lynch HT, de la Chapelle A. Hereditary Colorectal Cancer. N Engl J Med. 2003;348:919–932. doi: 10.1056/NEJMra012242. [DOI] [PubMed] [Google Scholar]
- Mandelblatt J, Andrews H, Kao R, Wallace R, Kerner J. The late-stage diagnosis of colorectal cancer: demographic and socioeconomic factors. Am J Public Health. 1996;86:1794–1797. doi: 10.2105/ajph.86.12.1794. [DOI] [PMC free article] [PubMed] [Google Scholar]
- Munteanu I, Mastalier B. Genetics of colorectal cancer. J Med Life. 2014;7:507–511. [PMC free article] [PubMed] [Google Scholar]
- Muren NB, Barton JK. Electrochemical Assay for the Signal-On Detection of Human DNA Methyltransferase Activity. J Am Chem Soc. 2013;135:16632–16640. doi: 10.1021/ja4085918. [DOI] [PMC free article] [PubMed] [Google Scholar]
- Okano M, Bell DW, Haber DA, Li E. DNA Methyltransferases Dnmt3a and Dnmt3b Are Essential for De Novo Methylation and Mammalian Development. Cell. 1999;99:247–257. doi: 10.1016/s0092-8674(00)81656-6. [DOI] [PubMed] [Google Scholar]
- Peng DF, Kanai Y, Sawada M, Ushijima S, Hiraoka N, Kosuge T, Hirohashi S. Increased DNA methyltransferase 1 (DNMT1) protein expression in precancerous conditions and ductal carcinomas of the pancreas. Cancer Sci. 2005;96:403–408. doi: 10.1111/j.1349-7006.2005.00071.x. [DOI] [PMC free article] [PubMed] [Google Scholar]
- Roundtree MR, Bachman KE, Baylin SB. DNMT1 binds HDAC2 and a new co-repressor, DMAP1, to form a complex at replication foci. Nat Genet. 2000;25:269–277. doi: 10.1038/77023. [DOI] [PubMed] [Google Scholar]
- Sharma S, Kelley TS, Jones PA. Epigenetics in cancer. Carcinogenesis. 2010;31:27–36. doi: 10.1093/carcin/bgp220. [DOI] [PMC free article] [PubMed] [Google Scholar]
- Smallwood A, Esteve PO, Pradhan S, Carey M. Functional cooperation between HP1 and DNMT1 mediates gene silencing. Genes & Dev. 2007;21:1169–1178. doi: 10.1101/gad.1536807. [DOI] [PMC free article] [PubMed] [Google Scholar]
- Toyota M, Ahuja N, Ohe-Toyota M, Herman JG, Baylin SB, Issa JPJ. CpG island methylator phenotype in colorectal cancer. Proc Natl Acad Sci, USA. 1999;96:8681–8686. doi: 10.1073/pnas.96.15.8681. [DOI] [PMC free article] [PubMed] [Google Scholar]
- Toyota M, Ho C, Ahuja N, Jair KW, Li Q, Ohe-Toyota M, Baylin SB, Issa JPJ. Identification of Differentially Methylated Sequences in Colorectal Cancer by Methylated CpG Island Amplification. Cancer Res. 1999;59:2307–2312. [PubMed] [Google Scholar]
- Vogelstein B, Kinzler KW. Cancer genes and the pathways they control. Nat Med. 2004;10:789–799. doi: 10.1038/nm1087. [DOI] [PubMed] [Google Scholar]
- Zou HZ, Yu BM, Wang ZW, Sun JY, Cang H, Gao F, Li DH, Zhao R, Feng GG, Yi J. Detection of Aberrant p16 Methylation in the Serum of Colorectal Cancer Patients. Clin Cancer Res. 2002;8:188–191. [PubMed] [Google Scholar]
Associated Data
This section collects any data citations, data availability statements, or supplementary materials included in this article.