Abstract
Active glutamine utilization is critical for tumor cell proliferation. Glutaminolysis represents the first and rate-limiting step of glutamine utilization and is catalyzed by glutaminase (GLS). Activation of ErbB2 is one of the major causes of breast cancers, the second most common cause of death for women in many countries. However, it remains unclear whether ErbB2 signaling affects glutaminase expression in breast cancer cells. In this study, we show that MCF10A-NeuT cell line has higher GLS1 expression at both mRNA and protein levels than its parental line MCF10A, and knockdown of ErbB2 decreases GLS1 expression in MCF10A-NeuT cells. We further show that in these cells, ErbB2-mediated upregulation of GLS1 is not correlated to c-Myc expression. Moreover, activation of neither PI3K-Akt nor MAPK pathway is sufficient to upregulate GLS1 expression. Interestingly, inhibition of NF-κB blocks ErbB2-stimulated GLS1 expression, whereas stimulation of NF-κB is sufficient to enhance GLS1 levels in MCF10A cells, suggesting a PI3K-Akt-independent activation of NF-κB upregulates GLS1 in ErbB2-positive breast cancer cells. Finally, knockdown or inhibition of GLS1 significantly decreased the proliferation of breast cancer cells with high GLS1 levels. Taken together, our data indicate that ErbB2 activation promotes GLS1 expression via a PI3K-Akt-independent NF-κB pathway in breast cancer cells, identifying another oncogenic signaling pathway which stimulates GLS1 expression, and thus promoting glutamine utilization in cancer cells. These findings, if validated by in vivo model, may facilitate the identification of novel biochemical targets for cancer prevention and therapy.
Keywords: breast cancer, ErbB2, glutaminase, glutamine, GLS1, nuclear factor κ B
Active glutaminolysis is a major biochemical feature of many tumors. Through glutaminolysis, glutamine is utilized to meet biosynthetic, energetic and reductive needs for highly proliferating cells [Reitzer et al., 1979; Turowski et al., 1994; DeBerardinis et al., 2008; Levine and Puzio-Kuter, 2010; Meng et al., 2010; Dang et al., 2011; Shanware et al., 2011]. Glutaminolysis is the conversion of glutamine to glutamate catalyzed by glutaminases (GLS) which include two isoforms: GLS1 and GLS2. Particularly, GLS1 has been reported to be widely expressed in non-hepatic human tissues and tumors [Aledo et al., 2000]. Moreover, GLS1 overexpression correlates with cell proliferation and tumor growth [de la Rosa et al., 2009], whereas the liver isoform, GLS2 is involved in the urea cycle [Gomez-Fabre et al., 2000].
Oncogenes promote tumor formation and regulate cell growth through various signaling pathways [Borrello et al., 2008]. Cell metabolic processes provide the energy, building blocks and reductive equivalents to support cell survival and proliferation, forming the biochemical basis for all cellular activities including proliferation and malignant transformation. As initiators of oncogenic transformation and regulators of cell growth, oncogenes not only enhance cell cycle progression but also coordinate the malignant transformation with reprogrammed utilization of nutrients. Glutaminolysis not only provides ATP and reducing equivalent, but also represents a fundamental mechanism for nitrogen anabolism [Thompson et al., 2008; Gao et al., 2009; Meng et al., 2010]. It is plausible that tumor-initiating oncogenes may promote glutamine utilization through elevating GLS expression as part of the metabolic transformation processes. As an oncogene, c-Myc has been shown to enhance GLS1 expression in human tumor cells; however, it remains elusive if other oncogenes regulate GLS1 expression and coordinate glutaminolysis with tumor cell proliferation.
Breast cancer is the second most common cause of death for women [Rana et al., 2010], comprising 26% of all cancers diagnosed for women in the United States [Dizdar and Altundag, 2009]. About 15–20% of breast cancers show overexpression and/or amplification of ErbB2 [Baselga and Swain, 2009; Guarneri et al., 2010]. Overexpression of ErbB2 facilitates the formation of ErbB2 homodimers or heterodimers with other ErbB proteins, leading to activation of downstream signaling pathways, such as MAPK/Erk, PI3K-Akt, or nuclear factor kappa B (NF-κB), which together enhance cell survival, proliferation and tumorigenesis [Slamon et al., 1987; Yarden and Sliwkowski, 2001; Chodosh, 2011]. In addition, erratically activated ErbB2 signaling also contributes to the resistance to endocrine therapy in ER-positive breast cancers, resulting in poor outcomes [Ertel et al., 2010]. However, it is unclear whether and how ErbB2 signaling is involved in glutamine utilization during tumorigenesis.
In this study, we report that ErbB2 activation upregulates GLS1 expression. We also show that mechanistically this upregulation is controlled by NF-κB pathway, but not by c-Myc. Finally, we show that the ErbB2-increased glutaminase activity is important for the rapid proliferation of breast cancer cells.
MATERIALS AND METHODS
CELL LINES AND CELL CULTURES
MCF10A and NeuT transformed MCF10A (MCF10A-NeuT) were generously provided by Dr. R. Pestell (Kimmel Cancer Center, Philadelphia, PA). MCF10A and MCF10A-NeuT cells were cultured in DMEM/F12 (50:50) (Mediatech, Inc., Manassas, VA) supplemented with horse serum (5%), insulin (10µg/ml), EGF (20 ng/ml), hydrocortisone (0.5µg/ml), and cholera toxin (100 ng/ml). Proliferation assay media for MCF10A and MCF10A-NeuT cells were DMEM/ F12 (50:50) (Mediatech, Inc.) supplemented with horse serum (5%), insulin (10µg/ml), hydrocortisone (0.5µg/ml) and cholera toxin (100 ng/ml). SK-BR-3 and MDA-MB-453 cells were from ATCC and maintained in DMEM (Mediatech, Inc.) supplemented with 10% fetal bovine serum. All cells were cultured at 37°C in humidified incubators with 5% carbon dioxide.
ANTIBODIES AND REAGENTS
Mouse anti-c-ErbB2 monoclonal antibody was purchased from Calbiochem (Gibbstown, NJ); mouse anti-glutaminase monoclonal antibody was purchased from Abcam (Cambridge, MA); mouse antic-Myc monoclonal antibody was purchased from Santa Cruz Biotechnology (Santa Cruz, CA); Rabbit anti-active Erk and total Erk1/2 polyclonal antibodies were purchased from Promega (Madison, WI); rabbit anti-phospho-Akt (Ser473), total Akt and p65 polyclonal antibodies were from Cell Signaling (Danvers, MA); mouse anti-α-tubulin monoclonal antibody was from Sigma-Aldrich (St. Louis, MO). PD98059 and LY294002 were purchased from Sigma-Aldrich. Both drugs were diluted in DMSO and kept as stocks in −20°C. NF-κB inhibitor BAY 11-7082 and NF-κB activator phorbol-12-myristate-13-acetate (PMA) were purchased from EMD Chemicals, Inc. (Gibbstown, NJ). Both drugs were diluted in DMSO and kept as stocks in −20°C. TNF-α and Bis-2-(5-phenylacetamido-1,3,4-thiadiazol-2-yl)ethyl sulfide (BPTES) were purchased from Sigma-Aldrich. TNF-α was diluted in sterilized PBS. BPTES was diluted in DMSO. Pharmacy grade trastuzumab (Herceptin) was purchased from Genentech (San Francisco, CA). Trastuzumab was reconstituted with 20ml of supplied bacteriostatic water for injection, USP, containing 1.1% benzyl alcohol as preservative. The final trastuzumab solution strength per vial was 21mg/ml. When drugs were applied to cells, different concentrations were used as indicated in text or figures.
siRNA KNOCKDOWN ASSAYS
ErbB2, GLS1, c-Myc, p65 and control siRNA were purchased from Ambion (Austin, TX). Prior to transfection, 3 × 10⁵ cells were seeded into six-well plates. The next morning, cells were transfected with ErbB2, GLS1, c-Myc, p65 or control siRNA using lipofectamine 2000 transfection reagent (Invitrogen, Carlsbad, CA). Six hours after transfection, Opti-MEM (Invitrogen, Grand Island, NY) was changed to regular medium. The third day, control or targeted siRNA were used to transfect the cells again. Twenty-four hours after transfection, the whole cell lysates were collected and prepared for Western blotting analysis.
PLASMIDS AND TRANSIENT TRANSFECTION
Control vector or plasmids overexpressing MEK [Sang et al., 2003] or Akt-Myr [Ahmed et al., 1997] were used to transiently activate MEK/MAPK and/or PI3K-Akt signaling pathways. Prior to transfection, MCF10A cells were seeded into a 10 cm dish; when cells reached ~70% confluency, transfection was done using Lipofectamine 2000 by following manufacturer’ s protocol. Twenty-four hours after transfection, whole cell lysates were collected for Western blotting analysis.
RNA EXTRACTION AND qRT-PCR
MCF10A and MCF10A-NeuT cells were cultured for 24 h and then washed twice with ice-cold PBS. Total RNA was extracted using RNeasy Mini Kit (Qiagen, Valencia, CA). RNA concentrations were determined at 260/280 nm using Nanodrop spectrophotometer (Nanodrop Technologies, Montchanin, DE). 2 µg of total RNA from each sample were reverse transcribed using SuperScript II Reverse Transcriptase according to the manufacturer’s manual (Invitrogen, Grand Island, NY) in a total volume of 20 µl. The quality of cDNA was confirmed by PCR amplification of β-actin. The cDNA (1:50 dilution) was used for quantitative analysis using predesigned and validated GLS1 and GLS2 TaqMan probes (Applied Biosystem, Foster City, CA). PCR assays were used with the following protocol: after 2 min at 50°C, denaturation at 95°C for 10min, and 40 cycles of 15 s denaturation at 95°C, 1min annealing and extension at 60°C. The PCR reaction volume was 10 µl containing 4.5µl 1:50 diluted cDNA, 5 µl TaqMan 2 × Universal PCR Master Mix NoAmpErase UNG (Applied Biosystems), 0.5 µl predesigned and validated gene-specific TaqMan Gene Expression Assay Mix. RNA levels of β-actin were used to normalize for RNA loading. Relative quantification (RQ) studies were made from collected data (threshold cycle numbers, referred to as Ct) using StepOne™ Software v2.1 (Applied Biosystems).
WESTERN BLOTTING
Whole cell lysates were collected using urea lysis buffer containing 6.6M urea, 10mM Tris-HCl, 1% SDS, 5mM DTT, 1% Triton X-100, 10% Glycerol and 1 × protein inhibitor mix. Protein concentrations were determined by using Bio-Rad Protein Assay Kit I. The same amounts of total proteins were loaded onto a Mini-protein TGX precast gel (Bio-Rad, Hercules, CA) and electrophoresis was performed. The separated proteins were transferred onto PVDF membrane (Bio-Rad), blocked with 5% non-fat dry milk powder in TBST buffer (50mM Tris, pH 8.0, 150mM NaCl, 0.2% Tween-20), and probed with the appropriate antibody. Bands were visualized using chemiluminescence system (Thermo Scientific, Rockford, IL). Western blots were stripped in buffer containing 62.5mMTris-HCl, pH 6.7, 2% SDS, and 100mM 2-mercaptoethanol at 50°C for 1 h, washed 4–6 times in TBST buffer, and re-probed when needed. Western blot quantification was performed using Quantity One (Bio-Rad); the bands were automatically analyzed by the software. Signals were calculated by subtracting the detected intensity × mm2 by background. Signal from control was arbitrarily set as 1.00, while the signals of treated groups were denoted as the fold compared to the control.
IMMUNOFLUORESCENT STAINING
MCF10A and MCF10A-NeuT cells were plated in eight-well chamber slides (BD Biosciences). MCF10A cells were treated with TNF-α and PMA for 6 h. Then, the cells were fixed with 4% paraformaldehyde for 15min at room temperature. After three times wash with PBS, cells were incubated with PBS containing 5% goat serum and 0.3% Triton X-100 for 1 h for blocking and then incubated in diluted primary antibodies in PBS with 1% BSA and 0.3% Triton X-100 for 2 h. Washed in PBS three times, cells were incubated with fluorescent-conjugated goat anti-rabbit or mouse secondly antibodies. Cells were then visualized by confocal microscopy (Fluoview 1000; Olympus).
CELL PROLIFERATION ASSAYS
For GLS1 knockdown: MCF10A-NeuT, SK-BR-3 and MDA-MB-453 cells were transfected with control or GLS1 siRNA for 24 h. On the following day, the cells were re-seeded in triplicate in 96-well plates. The cell numbers were determined using the CyQUANT® NF Cell Proliferation Assay Kit (Invitrogen, Grand Island, NY) 6 h after plating, and this number was set as day 0. “Fold of numbers” was calculated through dividing cell numbers of days 1, 3, and 5 by day 0 for each condition of each cell line. For BPTES treatment: MCF10A, MCF10A-NeuT, SK-BR-3 and MDA-MB-453 cells were plated in triplicate in 96-well plates at a density of 3 × 10³ cells per well. On the following day, these cells were treated with different concentrations of BPTES (0, 5, 10, 20 µM). Cell numbers were examined on day 0, 1, 3 and 5 after treatment using the CyQUANT® NF Cell Proliferation Assay Kit (Invitrogen, Grand Island, NY).
STATISTICAL ANALYSIS
For quantitative PCR and cell proliferation assay results, RQ or cell number values were analyzed by student t test. P values <0.05 were considered as significant.
RESULTS
ErbB2 ACTIVATION UP-REGULATES GLS1 EXPRESSION IN MCF10A CELLS
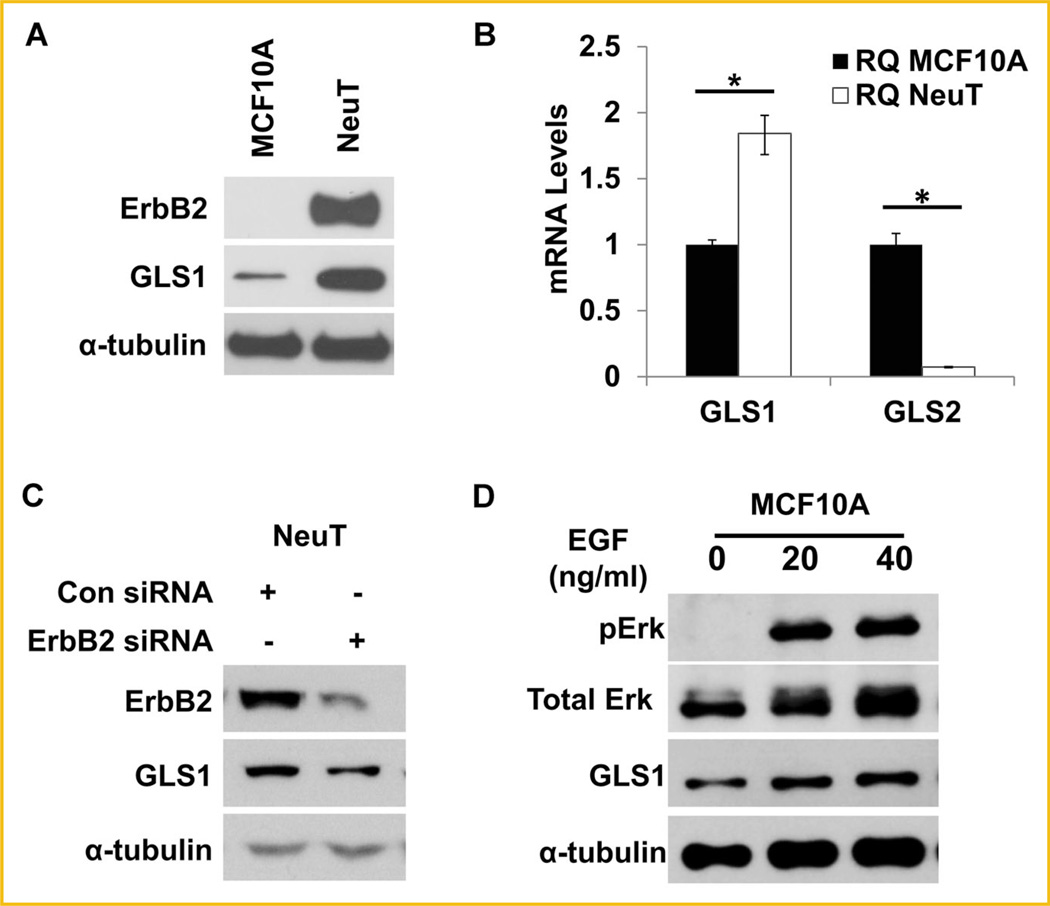
Oncogenes and tumor suppressors have been proposed to regulate glucose and glutamine metabolism [Li et al., 2012; Qie et al., 2012; Yin et al., 2012]. As an oncogene responsible for a large portion of breast cancers, ErbB2 has not been studied for its potential role in glutamine utilization in breast cancer cells. To explore if ErbB2 activation plays a role in the regulation of glutamine utilization during oncogenic and metabolic transformation of cells, we used MCF10A, a non-tumorigenic breast epithelial cell line, and MCF10A-NeuT, a NeuT (constitutively active form of ErbB2) transformed MCF10A cell line, as our experimental model. We first compared the GLS1 protein levels in this matched pair of cell lines by Western blotting and found that NeuT-transformed cells had remarkably increased GLS1 protein (Fig. 1A). Quantification of mRNA levels by real time qRT-PCR also revealed that in MCF10A-NeuT cells, GLS1 mRNA levels were increased while GLS2 mRNA levels were decreased when compared with MCF10A cells (Fig. 1B). To determine if ErbB2 activation is responsible for the increase of GLS1 expression in MCF10A-NeuT cells, we knocked down ErbB2 using ErbB2 siRNA in MCF10A-NeuT cells and found that ErbB2 knockdown reduced GLS1 expression in these cells (Fig. 1C). To further substantiate that ErbB2 activation positively regulates GLS1, we treated MCF10A cells with EGF, a natural growth factor that binds and activates ErbB2 through a different mechanism. The effect of EGF was indicated by the phosphorylation of Erk (Fig. 1D). As expected, EGF treatment increased GLS1 expression (Fig. 1D), confirming that ligand-mediated activation of ErbB2 pathway also enhances GLS1 levels.
Fig. 1.
ErbB2 activation up-regulates GLS1 expression at both mRNA and protein levels. A: Western blotting analysis of total cell lysates prepared from MCF10A-NeuT and its parental cell line, MCF10A. Both ErbB2 and GLS1 were detected, and α-tubulin was used as a loading control. B: Quantitative analysis of GLS mRNA levels by real time PCR. The total RNA samples were isolated from MCF10A and MCF10A-NeuT cells and reverse-transcribed to cDNA. GLS1 and GLS2 expression at mRNA level was determined by qRT-PCR (ΔRQ). Error bars shown are standard deviations; *P < 0.05. C: ErbB2 knockdown reduces GLS1 levels in MCF10A-NeuT cells. Control and ErbB2 specific siRNA were transfected into MCF10A-NeuT cells. Twenty-four hours post transfection cell lysates were prepared and analyzed by Western blots. D: GLS1 expression after EGF treatment. MCF10A were treated with indicated doses of EGF. Cells were harvested 6 h post treatment. GLS1 was determined by Western blot and pErk was used as an indicator of the activation of ErbB2 signaling pathway.
GLS1 UPREGULATION DOES NOT INVOLVE c-Myc INDUCTION IN MCF10A-NEUT CELLS
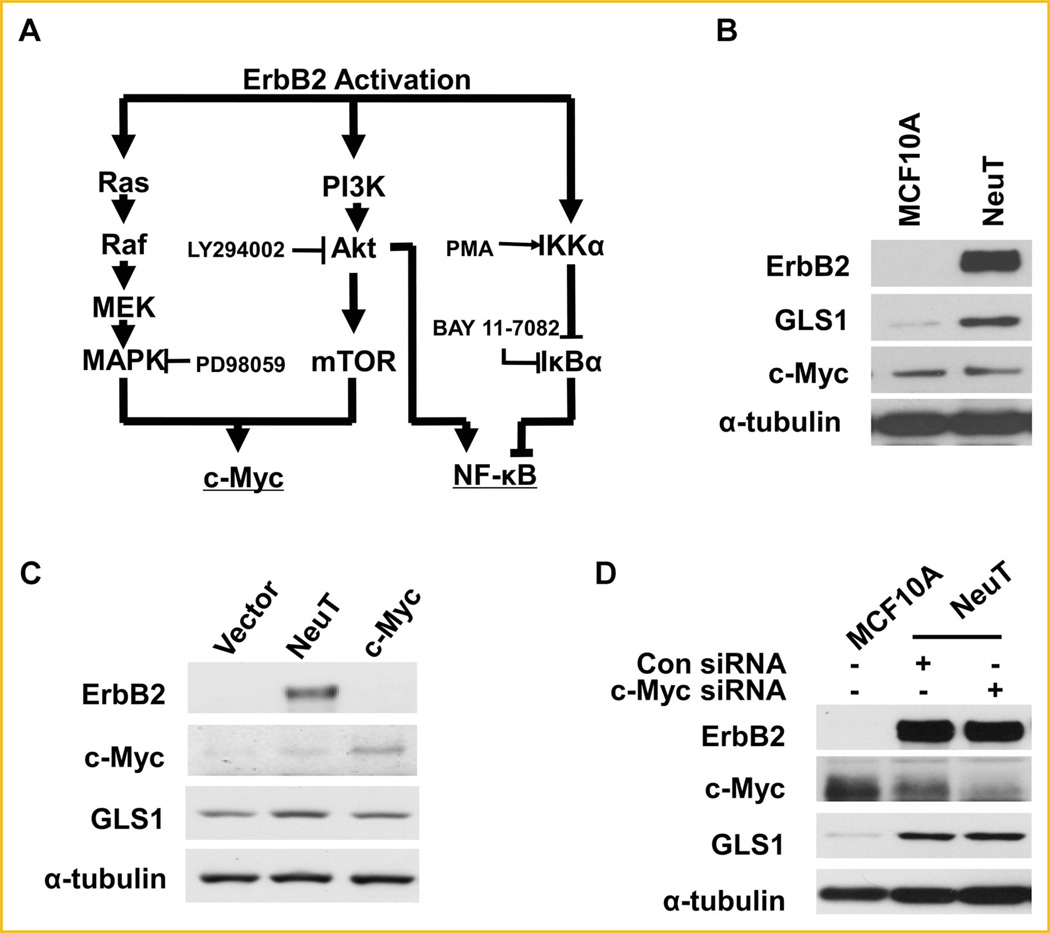
It has been shown that c-Myc upregulates GLS1 expression by inhibiting miR-23a/b expression [Gao et al., 2009]. ErbB2 activation has been reported to activate both MAPK and PI3K signaling pathways, which together enhance c-Myc expression as schematically shown in Figure 2A [Neve et al., 2000]. We next asked if ErbB2 upregulated GLS1 expression through c-Myc induction. To address this, we determined c-Myc levels in MCF10A and MCF10A-NeuT cells by Western blotting. We found that while MCF10A-NeuT transformed cells had increased GLS1, c-Myc expression level was not affected when compared with the parental MCF10A cells (Fig. 2B). To further explore the role of c-Myc in GLS1 expression in MCF10A, we tested the GLS1 levels in a MCF10A cell line which stably overexpresses c-Myc. Western blots showed stable overexpression of c-Myc in MCF10A cells did not enhance GLS1 expression (Fig. 2C). Finally, c-Myc knockdown did not reduce GLS1 levels in MCF10ANeuT cells (Fig. 2D). Taken together, these data indicate that c-Myc is unlikely the major regulator of GLS1 in MCF10A, suggesting ErbB2 activation may upregulate GLS1 via a pathway distinctive from c-Myc.
Fig. 2.
ErbB2 enhanced GLS1 expression does not involve c-Myc. A: ErbB2 and its downstream signaling pathways. MAPK/Erk and PI3K/Akt pathways are two key signaling pathways activated by ErbB2. ErbB2 may induce c-Myc expression through either MAPK/Erk, or PI3K/Akt or both. In addition, ErbB2 activation stimulates NF-κB pathway through induction of IKK, which is independent of PI3K. Inhibitors and activators of the signaling pathways studied are shown in the diagram. PD98059 is an MAPK/Erk inhibitor; LY294002 is an Akt inhibitor; BAY 11-7082 is an NF-κB inhibitor; and PMA is an NF-κB activator. (B) ErbB2 does not upregulate c-Myc expression in MCF10A-NeuT cells. The protein levels of ErbB2, GLS1 and c-Myc in MCF10A and MCF10A-NeuT cells were determined by Western blotting analysis. C: Stable overexpression c-Myc in MCF10A cells fails to upregulate GLS1. D: c-Myc knockdown does not affect GLS1 expression in MCF10A-NeuT cells.
ACTIVATION OF PI3K-AKT OR MAPK/ERK IS NOT SUFFICIENT TO INDUCE GLS1 EXPRESSION
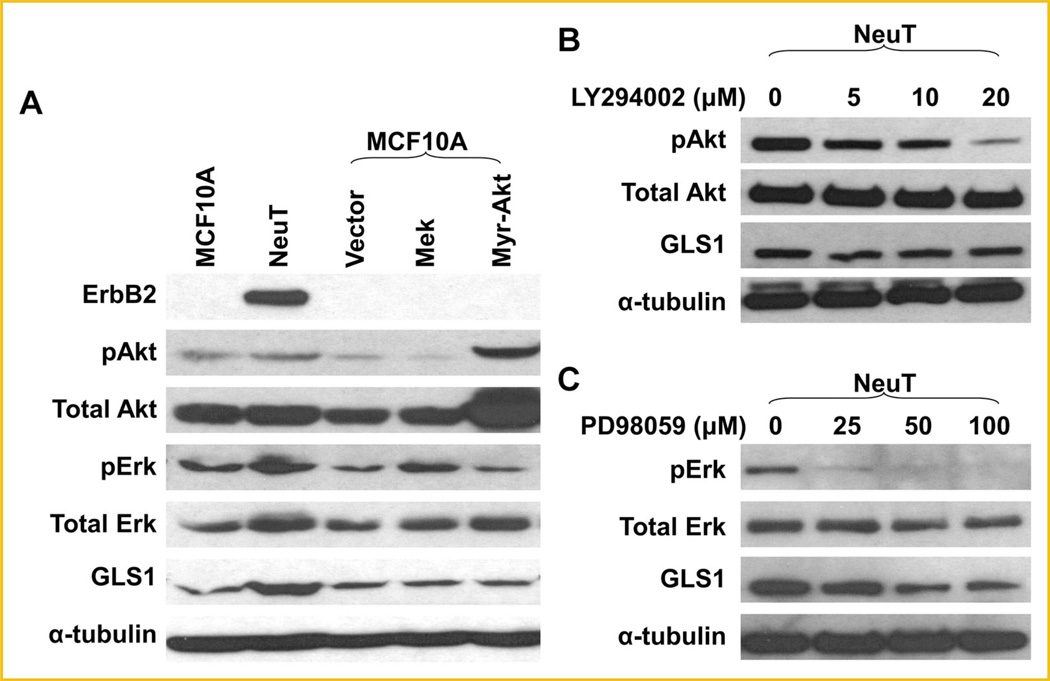
ErbB2 activation enhances cell survival, cell cycle progression and cell proliferation through activating MAPK/Erk and PI3k-Akt signaling pathways (Fig. 2A) [Baselga and Swain, 2009]. Not surprisingly, we found that MCF10A-NeuT cells had higher levels of phospho-MAPK/Erk and phospho-Akt than MCF10A cells (Fig. 3A). To determine the signaling pathway that mediates ErbB2-induced GLS1 upregulation, we continued to address if activation of PI3K-Akt or MAPK/Erk pathway is sufficient to stimulate GLS1 expression. We overexpressed MEK, the upstream activating kinase of Erk, and Myr-Akt, a constitutively active form of Akt, into MCF10A cells. We observed that in either case, GLS1 level was not affected (Fig. 3A). In addition, treating cells with PI3K inhibitor LY294002 suppressed Akt phosphorylation, but not GLS1 expression in MCF10A-NeuT cells (Fig. 3B). However, an MAPK inhibitor, PD98059, suppressed both Erk phosphorylation and GLS1 expression in MCF10A-NeuT cells (Fig. 3C), suggesting basal level of MAPK signaling is needed to maintain GLS1 expression. Taken together, these results suggest that while adequate MAPK signaling seems to be required for GLS1 expression, activation of either MAPK or PI3K-Akt pathway alone is not sufficient to induce GLS1 expression in MCF10A cells.
Fig. 3.
Activation of PI3K-Akt or MAPK/Erk is not sufficient to enhance GLS1 expression. A: GLS1 expression in MCF10A cells transiently transfected with empty vector, and plasmids expressing MEK or Myr-Akt. Western blots show that the activation of either MAPK/Erk or Akt pathway is not sufficient to upregulate GLS1. B: Inhibition of PI3K pathway does not suppress GLS1 expression. MCF10A-NeuT cells were treated with 0, 5, 10, and 20mM of LY294002 for 24 h prior to cell harvest and Western blotting analysis. Phosporylated Akt was detected as an indicator of PI3K pathway inhibition. C: MCF10A-NeuT cells were treated with 0, 25, 50, and 100 mM of PD98059 for 24 h. Both Erk activation and GLS1 expression is suppressed.
ErbB2 UPREGULATES GLS1 EXPRESSION THROUGH ACTIVATION OF NF-κB SIGNALING PATHWAY
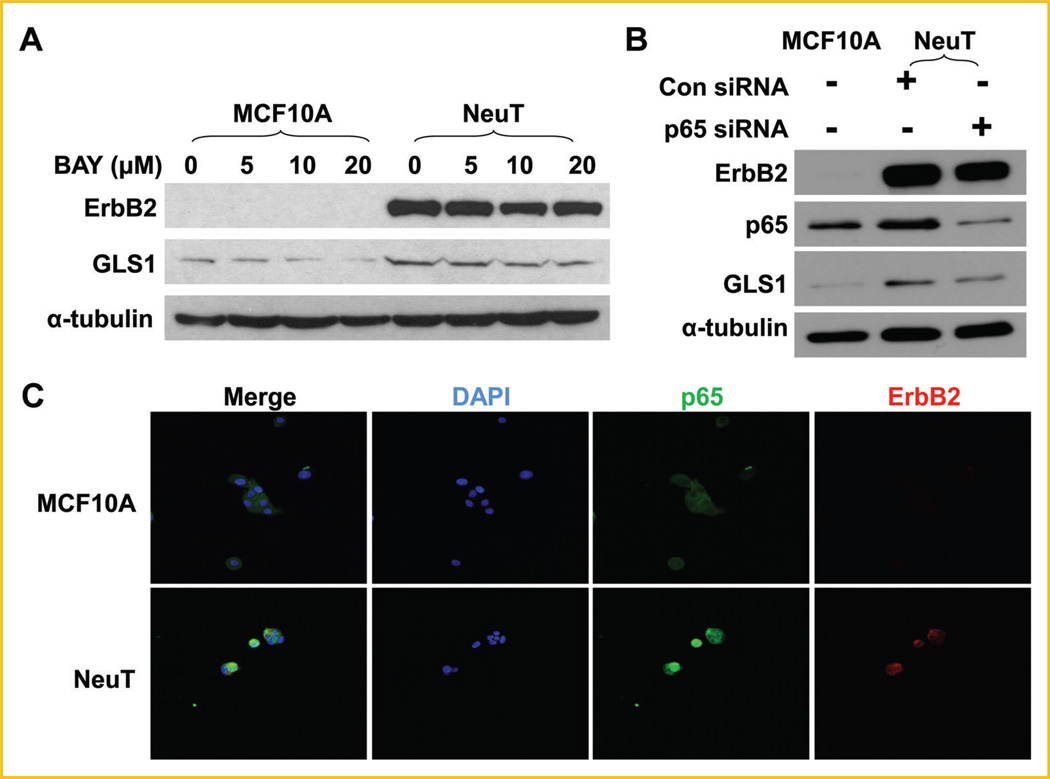
Besides MAPK and PI3K-Akt pathways, NF-κB has been shown to be a mediator of ErbB2 signaling (Fig. 2A) [Galang et al., 1996; Pianetti et al., 2001; Liu et al., 2009;Merkhofer et al., 2010]. In addition, recent studies have shown that p65 induces the expression of GLS1 [Wang et al., 2010; Rathore et al., 2012]. Therefore, we next tested whether NF-κB activation was implicated in ErbB2-induced GLS1 upregulation. BAY 11-7082 selectively and irreversibly inhibits NF-κB activation by blocking phosphorylation of IκB-α without affecting constitutive IκB-α phosphorylation [Pierce et al., 1997]. We treated MCF10A and MCF10A-NeuT cells with BAY 11-7082, and found that BAY 11-7082 decreased GLS1 expression in both cell lines (Fig. 4A). In addition, knockdown of p65 with siRNA reduced GLS1 expression in MCF10ANeuT cells (Fig. 4B). Nuclear translocation is an indicator of NF-κB activation. To examine whether NeuT transformation caused NF-κB activation, we performed immunofluoresent staining of p65 to trace its subcellular localization. We found that MCF10A-NeuT showed higher nuclear p65 levels than its parental cell line MCF10A (Fig. 4C). Taken together, these data indicate that ErbB2 activation promotes p65 activation, which is required for enhanced GLS1 expression.
Fig. 4.
NF-κB pathway is involved in GLS1 expression in MCF10A-NeuT cells. A: MCF10A and MCF10A-NeuT cells were treated with 0, 5, 10, and 20mM of BAY 11-7082 (BAY) for 24 h, GLS1 expression was determined by Western blotting analysis. B: Knockdown of p65 down-regulates GLS1 in MCF10A-NeuT cells. C: Nuclear localization of p65 in MCF10A-NeuT cells. MCF10A and MCF10A-NeuT cells were cultured in eight well chamber slides, fixed and stained for p65, ErbB2, and DNA (DAPI).
ACTIVATION OF NF-κB IS SUFFICIENT TO UPREGULATE GLS1 EXPRESSION IN MCF10A CELLS
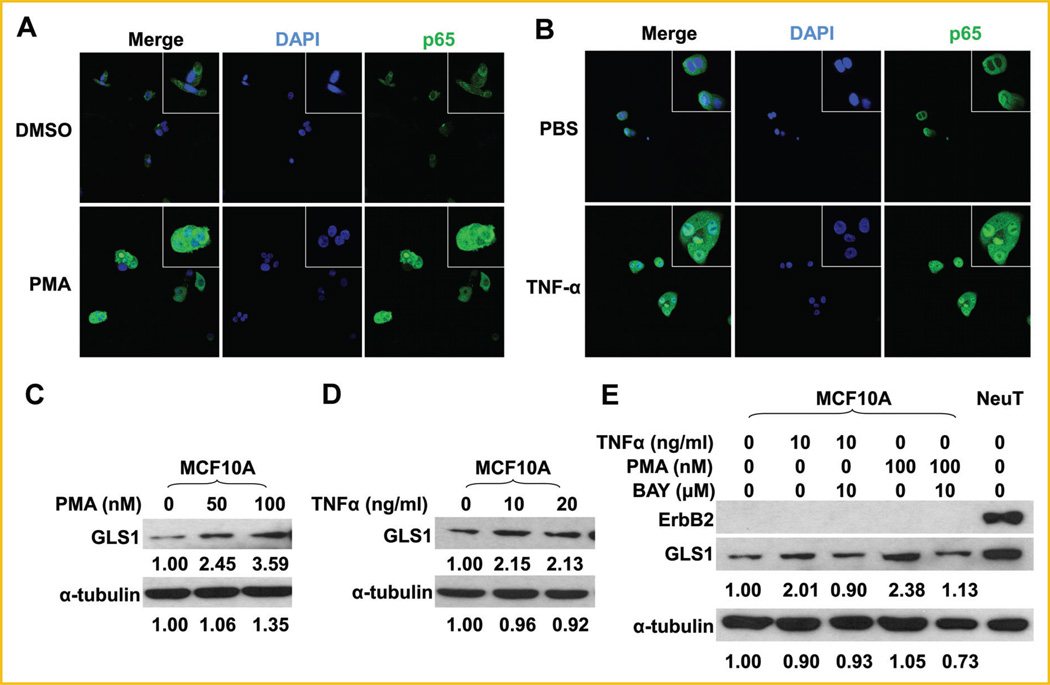
To address if NF-κB activation is sufficient to enhance GLS1 expression, we next treated MCF10A cells with two well-studied NF-κB activators PMA or TNF-α [Conant et al., 1994]. Activation of p65 in MCF10A cells by PMA or TNF-α, as indicated by its nuclear localization, was confirmed by immunofluorescent staining (Fig. 5A, B). Both activators of NF-κB enhanced GLS1 expression in MCF10A cells (Fig. 5C, D), which was abolished by pre-treatment of MCF10A cells with an NF-κB inhibitor, BAY 11-7082 (Fig. 5E). Taken together, these results indicate that NF-κB activation is sufficient to enhance GLS1 expression in MCF10A cells.
Fig. 5.
Activation of p65 is sufficient to upregulate GLS1 in MCF10A cells. A: MCF10A cells were treated with 100 nM of PMA in DMSO or DMSO alone for 6 h, followed by immunofluorescent staining for p65. B: MCF10A cells were treated with 20 ng/ml of TNF-α in PBS or PBS alone for 6 h, followed by immunofluorescent staining for p65. C: MCF10A cells were treated with 0, 50, or 100nM of PMA in DMSO for 6 h. GLS1 expression was determined by Western blots. D: MCF10A cells were treated with 0, 10, and 20 ng/ml of TNF-α for 6 h, GLS1 expression was determined by Western blots. E: MCF10A cells were treated with 10mMof BAY 11-7082 for 18 h, followed by treatment with 10 ng/ml of TNF-α or 100 nM of PMA for another 6 h. The whole cell lysates were collected for Western blotting analysis. The numbers under the blots are quantification of each detected bands; GLS1 or α-tubulin of control groups were set at 1.00, and treated groups were compared to the control group.
ErbB2-DEPENDENT EXPRESSION OF GLS1 IN HUMAN BREAST CANCER CELLS
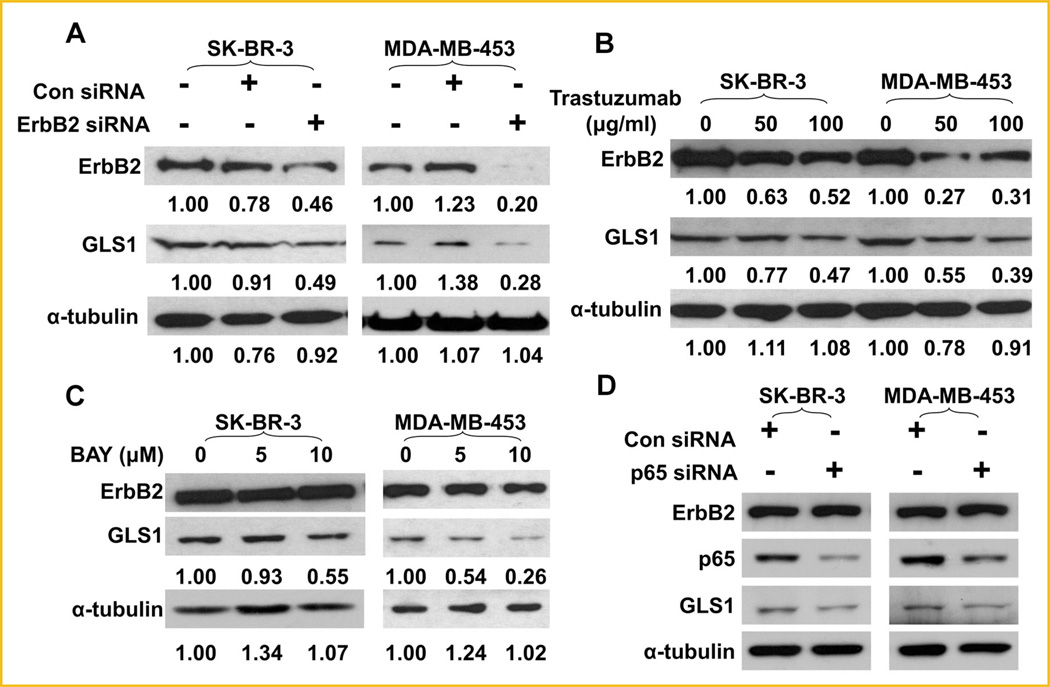
To further explore the role of ErbB2 activation in the regulation GLS1 expression in human breast cancer cells, we examined the levels of GLS1 in ErbB2-positive SK-BR-3 and MDA-MB-453 cells, and high levels of GLS1 in these two cell lines were confirmed (Supplemental data, Fig. S1). We knocked down ErbB2 expression in SK-BR-3 andMDA-MB-453 cells using ErbB2 siRNA, and observed that ErbB2 knockdown remarkably reduced GLS1 expression in these cells (Fig. 6A). Trastuzumab is a recombinant humanized IgG1 monoclonal antibody which directly binds the extracellular domain of ErbB2 and inhibits its activation [Goldenberg, 1999]. To rule out potential off-target effects associated with siRNA knock-down, we also used trastuzumab to treat SK-BR-3 and MDA-MB-453 cells. We found trastuzumab treatment reduced GLS1 levels in SKBR-3 and MDA-MB-453 cells (Fig. 6B). We also noted that trastuzumab caused ErbB2 reduction, a phenomenon which was reported in previous studies [Raja et al., 2008; Paris et al., 2010]. Importantly, BAY 11-7082 and p65 knockdown also decreased GLS1 expression in SK-BR-3 and MDA-MB-453 cells (Fig. 6C, D), confirming that p65 is a critical mediator of ErbB2-induced GLS1 expression. Taken together, these data indicate that the ErbB2-enhanced, NF-κB-mediated, GLS1 expression is likely to be a common feature of some breast cancer cells, not a special finding only applicable to MCF10A line.
Fig. 6.
Suppressing ErbB2 down regulates GLS1 expression in human breast cancer cells. A: Knockdown of ErbB2 down-regulates GLS1 levels in SK-BR-3 and MDA-MB-453 cells. Twenty-four hours after transfection, protein levels of ErbB2 and GLS1 in SK-BR-3 and MDA-MB-453 cells were examined by Western blots. B: Trastuzumab represses the expression of GLS1. SK-BR-3 and MDA-MB-453 cells were treated with trastuzumab (50 or 100 mg/ml) for 24 h. Protein levels of ErbB2 and GLS1 were determined by Western blotting. The numbers under the blots are quantification of each detected bands; ErbB2, GLS1, or α-tubulin of control group were set at 1.00, treated groups were compared to the control group. C,D: Inhibition or knockdown of p65 reduces GLS1 expression in ErbB2-positive breast cancer cells. NF-κB activity in SK-BR-3 and MDA-MB-453 cells were inhibited by treat cells with 5 and 10mM BAY 11-7082, or by siRNA knockdown. GLS1 expression levels and the p65 knockdown effects were monitored by Western blotting analysis.
GLS1 KNOCKDOWN SUPPRESSES BREAST CANCER CELL PROLIFERATION
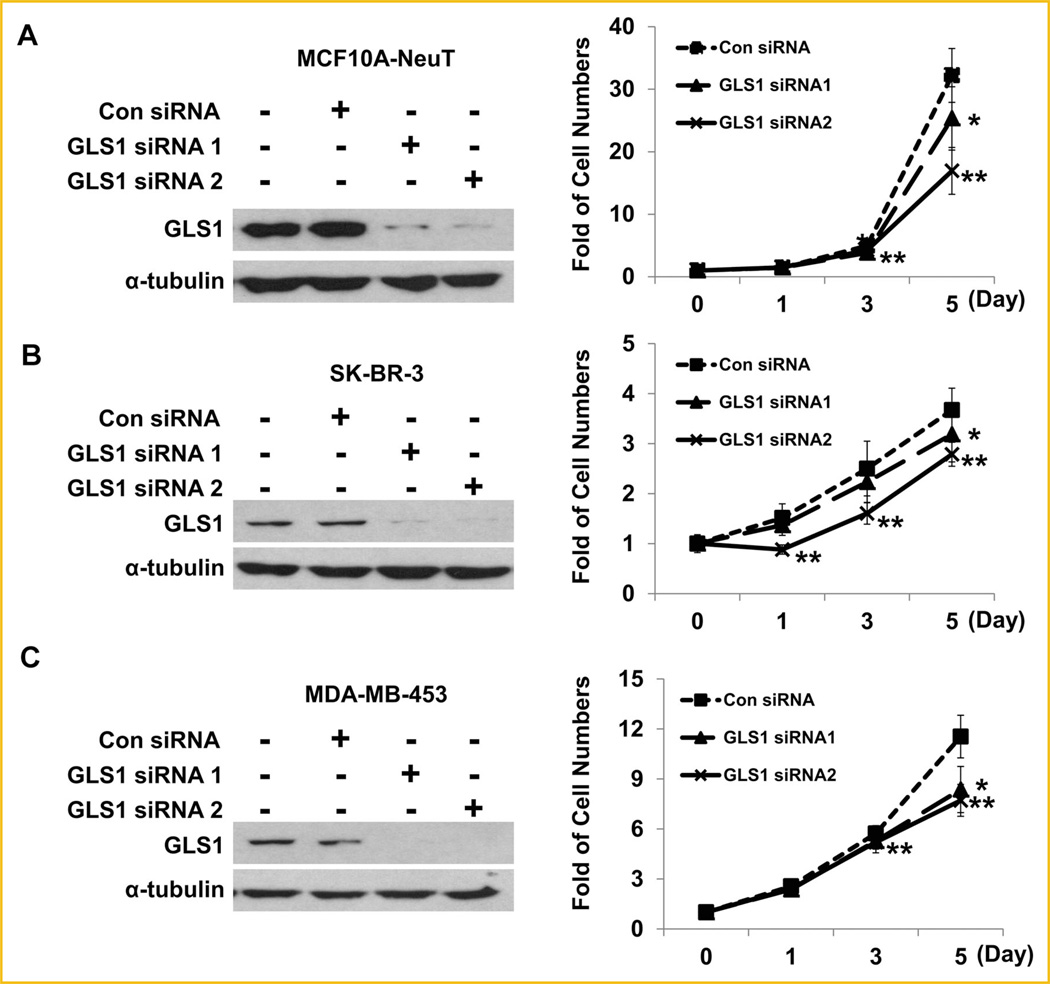
Biochemically, some metabolic enzymes can be expressed at excessive levels, thus increased expression may not affect the metabolic kinetics and cellular processes. To determine whether ErbB2-enhanced GLS1 expression levels contribute to breast cancer cell proliferation, we employed two different GLS1 siRNAs to knockdown GLS1 levels. GLS1 Knockdown was confirmed in MCF10A-NeuT, SK-BR-3, and MDA-MB-453 cells by Western blotting (Fig. 7A–C, left panels). Cell proliferation assays revealed that GLS1 knockdown significantly suppressed cell growth rates (Fig. 7A–C, right panels). These data indicate that the increased GLS1 expression caused by ErbB2 activation indeed promotes cell proliferation rates.
Fig. 7.
GLS1 knockdown attenuates the proliferation rates of MCF10A-NeuT, SK-BR-3, and MDA-MB-453 cells. A–C: Western blots show the knockdown effects of two different GLS1 siRNAs in MCF10A-NeuT (A), SK-BR-3 (B), and MDA-MB-453 (C) cells (left panels). Cell proliferation curves of MCF10A-NeuT, SK-BR-3, and MDA-MB-453 cells are shown in the right panels. *P < 0.05 for GLS1 siRNA1 versus control siRNA group; **P < 0.05 for GLS1 siRNA2 versus control siRNA groups.
GLS1 INHIBITOR SUPPRESSES BREAST CANCER CELL PROLIFERATION
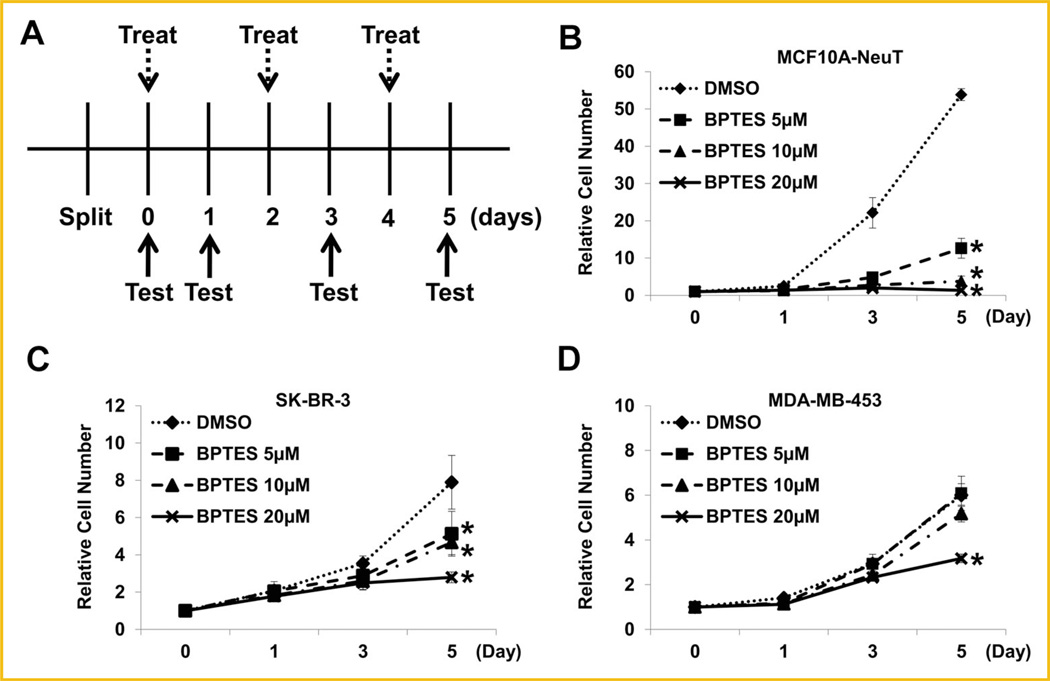
BPTES has been used as an inhibitor to suppress the activity of GLS1 [Robinson et al., 2007; Le et al., 2012]. To further substantiate the role of GLS1 activity in breast cancer cell proliferation, we also examined the effects of BPTES on ErbB2-positive breast cancer cell lines. The treatment schedule is illustrated in Figure 8A. Analysis of the cell growth curves under different regimens revealed that that BPTES treatment (≥5µM) significantly suppressed MCF10A-NeuT cell proliferation (Fig. 8B). High concentrations (20µM) of BPTES also suppressed SK-BR-3 and MDA-MB-453, two ErbB2-positive breast cancer cell lines (Fig. 8C, D). These data provide additional evidence that enhanced GLS1 activity may facilitate breast cancer cell proliferation.
Fig. 8.
Small molecule compound BPTES suppresses the proliferation of ErbB2-positive human breast cancer cells. A: Schematic illustration of BPTES treatment. BPTES concentrations used are: 0, 5, 10, and 20mM. Treatment: change of media containing BPTES with indicated concentrations. Test: cell number determination. B–D: Effects of BPTES on the proliferation rates of MCF10A-NeuT cells (B), SK-BR-3 cells (C), and MDA-MB-453 cells (D).
DISCUSSION
Glutaminolysis and Warburg effect are the two most noticeable metabolic characteristics of tumor cells, representing altered utilization of nitrogen and carbon sources to facilitate the metabolic transformation. Warburg effect defines the shifting of mitochondrial oxidative phosphorylation to glycolysis in tumor cells [Vander Heiden et al., 2009; Dang, 2010], which facilitates proliferative biosynthesis involving carbon metabolites. Glutamine is regarded as a nonessential amino acid at organismal level because it can be synthesized in many tissues. Even though glutamine has the highest serum concentration among all the amino acids, its demand may overwhelm its supply in highly proliferative tumor cells [DeBerardinis and Cheng, 2010]. The importance of glutamine in supporting tumor cell survival and proliferation has been well demonstrated [Kita et al., 2007; Yuneva et al., 2007; Gao et al., 2009]. Lack of glutamine in culture media commonly causes amino acid deficient stresses, ER stress, and eventually growth arrest and cell death [Qie et al., 2012]. In addition to serve as a carbon source, glutamine has also been demonstrated to serve as a major nitrogen source [Meng et al., 2010]. In fact, glutamine is the major precursor of glutamate; both glutamine and glutamate participate in the biosynthesis of a variety of nitrogenous biomolecules [Meng et al., 2010]. Notably, proliferating cells need to actively synthesize nitrogenous bases, glutathione, ornithine, polyamines and other non-essential amino acids. Since most types of cells cannot uptake glutamate effectively, glutamine becomes critical for these cells to maintain their intracellular glutamate levels through glutaminolysis. It has been proposed that the “glutamate-α-ketoglutarate cycle” plays an important role in maintain the dynamic balance among the intracellular pool of non-essential amino acids to support biosynthetic processes [Meng et al., 2010]. A metabolic pathway analysis reveals that rapid proliferating cells demand for increased synthesis of serine, aspartate and glycine; glutamate is the major amino group donor for their biosynthesis. Thus, as rapid proliferating cells, tumor cells dictate increased glutamine supply and utilization, and limiting glutamine utilization may suppress the proliferation of tumor cells [Reitzer et al., 1979; Turowski et al., 1994; DeBerardinis et al., 2008; Levine and Puzio-Kuter, 2010; Meng et al., 2010; Dang et al., 2011; Shanware et al., 2011].
Myc is the first oncogene identified to facilitate glutamine utilization by reprograming the expression of genes implicated in glutamine metabolism, including glutamine transporters and GLS1 [Thompson et al., 2008]. Particularly, the glutaminolytic rate correlates with GLS1 levels. ErbB2 activation represents an important oncogenic pathway in breast cancer cells. In this study, we found that ErbB2 activation associated with increased GLS1 levels at both mRNA and protein levels in breast cancer cells. ErbB2 knockdown reduced GLS1 expression in NeuT transformed breast epithelial cells and two ErbB2-positive human breast cancer cell lines, confirming a link between ErbB2 activation and GLS1 expression. Taken together, our data indicate a new oncogenic signaling pathway that may promote glutamine utilization in tumorigenic process.
Mechanistically, ErbB2 activates several downstream signaling pathways. The two major downstream pathways are MAPK/Erk and PI3K-Akt pathways [Hynes and Lane, 2005; Hynes and MacDonald, 2009]. Activation of both pathways have been reported to induce the expression of c-Myc by ErbB2 in other experimental settings [Olayioye et al., 2000]; however, our results showed no obvious c-Myc upregulation in MCF10A-NeuT cells compared to MCF10A cells. More importantly, overexpressed c-Myc in MCF10A cells did not enhance GLS1 expression. Why c-Myc status does not affect GLS1 expression in this cell line remains unclear. We also evaluated the role of MAPK/Erk and PI3K/Akt pathways in GLS1 upregulation. Our results indicate that the PI3K-Akt pathway is not involved in this process; consistent with a previous report that glutaminolysis was independent of activation of PI3K-Akt [Thompson et al., 2008]. Inhibiting the MAPK/Erk pathway decreased GLS1 expression in MCF10A-NeuT cells, but over-activation of MEK failed to induce an upregulation of GLS1, indicating that adequate MAPK/Erk signaling is required, but not sufficient, to stimulate glutamine utilization in tumor cells.
We and others have demonstrated that ErbB2 activates NF-κB signaling [Galang et al., 1996; Pianetti et al., 2001; Liu et al., 2009; Merkhofer et al., 2010]. How ErbB2 activates NF-κB remains elusive. Pianetti et al. [2001] reported that ErbB2 activates NF-κB via PI3K-Akt, which can be inhibited by PTEN and is mediated by calpain rather than IκB complex. Merkhofer et al. [2010] reported that ErbB2 activation of NF-κB requires IKKα in a PI3K-Akt-independent manner. Our results reported here support a PI3K-Akt-independent activation of NF-κB, underlying molecular mechanism remains to be elucidated.
The precise action model of NF-κB-mediated regulation of GLS1 also remains elusive. Recently it is reported that NF-κB regulates glutamine metabolism through repressing miR-23a in a c-Myc-independent manner [Rathore et al., 2012]. Independent studies have shown that suppression of NF-κB by inhibitor or siRNA decreases GLS1 in cancer cells [Erickson and Cerione, 2010; Wang et al., 2010]. These recent independent studies provide additional evidence to support our findings that NF-κB mediates ErbB2 signaling and upregulates GLS1 expression, as summarized in supplemental Figure S2. However, we found that ErbB2 knockdown did not affect the miR-23a/b levels (data not shown). In addition, bioinformatics analysis revealed no evidence to support that NF-κB may directly interact with GLS1 promoter/enhancer. It is well known that NF-κB is a pleiotropic transcription factor that controls the expression of a large number of genes related to cell survival, proliferation, apoptosis, and immune response [Srivastava and Ramana, 2009]. It has been reported that NF-κB activation promotes glucose uptake, triggers the switch of oxidative phosphorylation to glycolysis, thus enhancing tumorigenesis [Kawauchi et al., 2008; Jin et al., 2010]. Whether NF-κB enhances GLS1 expression through an indirect metabolic link remains to be investigated.
We also studied the effects of GLS1 activity on the proliferation of ErbB2-positive cells. BPTES is a noncompetitive inhibitor of GLS1 that inhibits GLS1 activity and leads to cellular glutamate depletion [Cooney et al., 1976; Lebedeva et al., 1986]. BPTES treatment decreased tumor cell proliferation of ErbB2-positive human breast cancer cells. These indicate that enhanced GLS1 activity is not simply a collateral consequence of, but an important part for, ErbB2-mediated malignant transformation. Therefore, if further validated by in vivo studies, our data may suggest that both NF-κB signaling pathway and GLS1 activity are potential targets for the prevention and treatment of ErbB2 positive breast cancers.
As metabolic transformation forms the biochemical basis for malignant transformation caused by oncogenic signaling pathways, it is important to note that ErbB2-NF-κB axis may represent only one of these pathways that regulate glutamine utilization; other oncogenic signaling pathways, in addition to c-Myc and ErbB2, may also affect GLS1 expression and glutamine utilization as well. In addition, these findings based on breast cancer cell lines remain to be further validated by in vivo cancer models. Nevertheless, we have demonstrated that ErbB2 activation up-regulates GLS1 expression through NF-κB, and the increased glutaminase expression promotes the proliferation of ErbB2-positive breast cancer cells in cell culture. Therefore, if validated by in vivo model, glutamine utilization may be explored as a novel biochemical target for the prevention and treatment of breast cancers.
ACKNOWLEDGMENTS
We thank Dr. R. Pestell (K.C.C., T.J.U.) for providing MCF10A and MCF10A-NeuT cell lines, Dr. M. Reginato (DUCOM) for providing cell lysates for initial studies and helpful discussion, Dr. K.L. Guan (UCSD) for providing pCMV.MEK1 plasmid and Dr. P.N. Tsichlis (Tufts University School of Medicine) for providing Akt-Myr plasmid. Clarissa Chu is a STAR Scholar supported by Drexel University.
Grant sponsor: NCI, National Institutes of Health (NIH); Grant number: R01-CA129494; Grant sponsor: Drexel University.
Abbreviations
- Akt
v-akt murine thymoma viral oncogene homolog
- ERBB2
v-erb-b2 erythroblastic leukemia viral oncogene homolog 2
- GLS
glutaminase
- HER2
human epidermal growth factor receptor 2
- MAPK/Erk
mitogen activated kinase-like protein
- c-Myc
v-myc myelocytomatosis viral oncogene homolog (avian)
- NF-κB
nuclear factor of kappa light polypeptide gene enhancer in B-cells
- PI3K
phosphatidylinositol-4,5-bisphosphate 3-kinase
- qRT-PCR
quantitative reverse transcription-polymerase chain reaction
Footnotes
Disclose potential conflicts of interest: The authors declare no conflicts of interest.
SUPPORTING INFORMATION
Additional supporting information may be found in the online version of this article at the publisher’s web-site.
REFERENCES
- Ahmed NN, Grimes HL, Bellacosa A, Chan TO, Tsichlis PN. Transduction of interleukin-2 antiapoptotic and proliferative signals via Akt protein kinase. Proc Natl Acad Sci USA. 1997;94:3627–3632. doi: 10.1073/pnas.94.8.3627. [DOI] [PMC free article] [PubMed] [Google Scholar]
- Aledo JC, Gomez-Fabre PM, Olalla L, Marquez J. Identification of two human glutaminase loci and tissue-specific expression of the two related genes. Mamm Genome. 2000;11:1107–1110. doi: 10.1007/s003350010190. [DOI] [PubMed] [Google Scholar]
- Baselga J, Swain SM. Novel anticancer targets: Revisiting ERBB2 and discovering ERBB3. Nat Rev Cancer. 2009;9:463–475. doi: 10.1038/nrc2656. [DOI] [PubMed] [Google Scholar]
- Borrello MG, Degl’Innocenti D, Pierotti MA. Inflammation and cancer: The oncogene-driven connection. Cancer Lett. 2008;267:262–270. doi: 10.1016/j.canlet.2008.03.060. [DOI] [PubMed] [Google Scholar]
- Chodosh LA. Breast cancer: Current state and future promise. Breast Cancer Res. 2011;13:113. doi: 10.1186/bcr3045. [DOI] [PMC free article] [PubMed] [Google Scholar]
- Conant K, Atwood WJ, Traub R, Tornatore C, Major EO. An increase in p50/p65 NF-κB binding to the HIV-1 LTR is not sufficient to increase viral expression in the primary human astrocyte. Virology. 1994;205:586–590. doi: 10.1006/viro.1994.1685. [DOI] [PubMed] [Google Scholar]
- Cooney DA, Jayaram HN, Milman HA, Homan ER, Pittillo R, Geran RI, Ryan J, Rosenbluth RJ. DON, CONV and DONV-III. Pharmacologic and toxicologic studies. Biochem Pharmacol. 1976;25:1859–1870. doi: 10.1016/0006-2952(76)90190-8. [DOI] [PubMed] [Google Scholar]
- Dang CV. Glutaminolysis: Supplying carbon or nitrogen or both for cancer cells? Cell Cycle. 2010;9:3884–3886. doi: 10.4161/cc.9.19.13302. [DOI] [PubMed] [Google Scholar]
- Dang CV, Hamaker M, Sun P, Le A, Gao P. Therapeutic targeting of cancer cell metabolism. J Mol Med (Berl) 2011;89:205–212. doi: 10.1007/s00109-011-0730-x. [DOI] [PMC free article] [PubMed] [Google Scholar]
- de la Rosa V, Campos-Sandoval JA, Martin-Rufian M, Cardona C, Mates JM, Segura JA, Alonso FJ, Marquez J. A novel glutaminase isoform in mammalian tissues. Neurochem Int. 2009;55:76–84. doi: 10.1016/j.neuint.2009.02.021. [DOI] [PubMed] [Google Scholar]
- DeBerardinis RJ, Cheng T. Q’s next: The diverse functions of glutamine in metabolism, cell biology and cancer. Oncogene. 2010;29:313–324. doi: 10.1038/onc.2009.358. [DOI] [PMC free article] [PubMed] [Google Scholar]
- DeBerardinis RJ, Sayed N, Ditsworth D, Thompson CB. Brick by brick: metabolism and tumor cell growth. Curr Opin Genet Dev. 2008;18:54–61. doi: 10.1016/j.gde.2008.02.003. [DOI] [PMC free article] [PubMed] [Google Scholar]
- Dizdar O, Altundag K. Emerging drugs in metastatic breast cancer. Expert Opin Emerg Drugs. 2009;14:85–98. doi: 10.1517/14728210802625671. [DOI] [PubMed] [Google Scholar]
- Erickson JW, Cerione RA. Glutaminase: a hot spot for regulation of cancer cell metabolism? Oncotarget. 2010;1:734–740. doi: 10.18632/oncotarget.208. [DOI] [PMC free article] [PubMed] [Google Scholar]
- Ertel A, Dean JL, Rui H, Liu C, Witkiewicz AK, Knudsen KE, Knudsen ES. RB-pathway disruption in breast cancer: differential association with disease subtypes, disease-specific prognosis and therapeutic response. Cell Cycle. 2010;9:4153–4163. doi: 10.4161/cc.9.20.13454. [DOI] [PMC free article] [PubMed] [Google Scholar]
- Galang CK, Garcia-Ramirez J, Solski PA, Westwick JK, Der CJ, Neznanov NN, Oshima RG, Hauser CA. Oncogenic Neu/ErbB-2 increases ets, AP-1, and NF-kappaB-dependent gene expression, and inhibiting ets activation blocks Neu-mediated cellular transformation. J Biol Chem. 1996;271:7992–7998. doi: 10.1074/jbc.271.14.7992. [DOI] [PubMed] [Google Scholar]
- Gao P, Tchernyshyov I, Chang TC, Lee YS, Kita K, Ochi T, Zeller KI, De Marzo AM, Van Eyk JE, Mendell JT, Dang CV. c-Myc suppression of miR-23a/b enhances mitochondrial glutaminase expression and glutamine metabolism. Nature. 2009;458:762–765. doi: 10.1038/nature07823. [DOI] [PMC free article] [PubMed] [Google Scholar]
- Goldenberg MM. Trastuzumab, a recombinant DNA-derived humanized monoclonal antibody, a novel agent for the treatment of metastatic breast cancer. Clin Ther. 1999;21:309–318. doi: 10.1016/S0149-2918(00)88288-0. [DOI] [PubMed] [Google Scholar]
- Gomez-Fabre PM, Aledo JC, Del Castillo-Olivares A, Alonso FJ, Nunez De Castro I, Campos JA, Marquez J. Molecular cloning, sequencing and expression studies of the human breast cancer cell glutaminase. Biochem J. 2000;345(Pt2):365–375. [PMC free article] [PubMed] [Google Scholar]
- Guarneri V, Barbieri E, Dieci MV, Piacentini F, Conte P. Anti-HER2 neoadjuvant and adjuvant therapies in HER2 positive breast cancer. Cancer Treat Rev. 2010;36(Suppl3):S62–S66. doi: 10.1016/S0305-7372(10)70022-0. [DOI] [PubMed] [Google Scholar]
- Hynes NE, Lane HA. ERBB receptors and cancer: the complexity of targeted inhibitors. Nat Rev Cancer. 2005;5:341–354. doi: 10.1038/nrc1609. [DOI] [PubMed] [Google Scholar]
- Hynes NE, MacDonald G. ErbB receptors and signaling pathways in cancer. Curr Opin Cell Biol. 2009;21:177–184. doi: 10.1016/j.ceb.2008.12.010. [DOI] [PubMed] [Google Scholar]
- Jin HC, Liu X, Wang X, Zhang J, Lam EKY, Shin VY, Cheng ASL, Yu J, Chan FKL, Sung JJY. Warburg effect revisited: an epigenetic link between glycolysis and gastric carcinogenesis. Oncogene. 2010;29:442–450. doi: 10.1038/onc.2009.332. [DOI] [PubMed] [Google Scholar]
- Kawauchi K, Araki K, Tobiume K, Tanaka N. p53 regulates glucose metabolism through an IKK-NF-kappaB pathway and inhibits cell transformation. Nat Cell Biol. 2008;10:611–618. doi: 10.1038/ncb1724. [DOI] [PubMed] [Google Scholar]
- Kita K, Suzuki T, Ochi T. Down-regulation of glutaminase C in human hepatocarcinoma cell by diphenylarsinic acid, a degradation product of chemical warfare agents. Toxicol Appl Pharmacol. 2007;220:262–270. doi: 10.1016/j.taap.2007.01.009. [DOI] [PubMed] [Google Scholar]
- Le A, Lane AN, Hamaker M, Bose S, Gouw A, Barbi J, Tsukamoto T, Rojas CJ, Slusher BS, Zhang H, Zimmerman LJ, Liebler DC, Slebos RJ, Lorkiewicz PK, Higashi RM, Fan TW, Dang CV. Glucose-independent glutamine metabolismvia TCA cycling for proliferation and survival in B cells. Cell Metab. 2012;15:110–121. doi: 10.1016/j.cmet.2011.12.009. [DOI] [PMC free article] [PubMed] [Google Scholar]
- Lebedeva ZI, Kabanova EA, Berezov TT. 6-Diazo-5-oxo-L-norleucine and azaserine as affinity inhibitors of glutamin(asparagin)ase. Biochem Int. 1986;12:413–420. [PubMed] [Google Scholar]
- Levine AJ, Puzio-Kuter AM. The control of the metabolic switch in cancers by oncogenes and tumor suppressor genes. Science. 2010;330:1340–1344. doi: 10.1126/science.1193494. [DOI] [PubMed] [Google Scholar]
- Li W, Tai Y, Zhou J, Gu W, Bai Z, Zhou T, Zhong Z, McCue PA, Sang N, Ji JY, Kong B, Jiang J, Wang C. Repression of endometrial tumor growth by targeting SREBP1 and lipogenesis. Cell Cycle. 2012;11:2348–2358. doi: 10.4161/cc.20811. [DOI] [PMC free article] [PubMed] [Google Scholar]
- Liu M, Ju X, Willmarth NE, Casimiro MC, Ojeifo J, Sakamaki T, Katiyar S, Jiao X, Popov VM, Yu Z, Wu K, Joyce D, Wang C, Pestell RG. Nuclear factor-kappaB enhances ErbB2-induced mammary tumorigenesis and neoangiogenesis in vivo. Am J Pathol. 2009;174:1910–1920. doi: 10.2353/ajpath.2009.080706. [DOI] [PMC free article] [PubMed] [Google Scholar]
- Meng M, Chen S, Lao T, Liang D, Sang N. Nitrogen anabolism underlies the importance of glutaminolysis in proliferating cells. Cell Cycle. 2010;9:3921–3932. doi: 10.4161/cc.9.19.13139. [DOI] [PMC free article] [PubMed] [Google Scholar]
- Merkhofer EC, Cogswell P, Baldwin AS. Her2 activates NF-kappaB and induces invasion through the canonical pathway involving IKKalpha. Oncogene. 2010;29:1238–1248. doi: 10.1038/onc.2009.410. [DOI] [PMC free article] [PubMed] [Google Scholar]
- Neve RM, Sutterluty H, Pullen N, Lane HA, Daly JM, Krek W, Hynes NE. Effects of oncogenic ErbB2 on G1 cell cycle regulators in breast tumour cells. Oncogene. 2000;19:1647–1656. doi: 10.1038/sj.onc.1203470. [DOI] [PubMed] [Google Scholar]
- Olayioye MA, Neve RM, Lane HA, Hynes NE. The ErbB signaling network: receptor heterodimerization in development and cancer. EMBO J. 2000;19:3159–3167. doi: 10.1093/emboj/19.13.3159. [DOI] [PMC free article] [PubMed] [Google Scholar]
- Paris L, Cecchetti S, Spadaro F, Abalsamo L, Lugini L, Pisanu ME, Iorio E, Natali PG, Ramoni C, Podo F. Inhibition of phosphatidylcholine-specific phospholipase C downregulates HER2 overexpression on plasma membrane of breast cancer cells. Breast Cancer Res. 2010;12:R27. doi: 10.1186/bcr2575. [DOI] [PMC free article] [PubMed] [Google Scholar]
- Pianetti S, Arsura M, Romieu-Mourez R, Coffey RJ, Sonenshein GE. Her-2/neu overexpression induces NF-kappaB via a PI3-kinase/Akt pathway involving calpain-mediated degradation of IkappaB-alpha that can be inhibited by the tumor suppressor PTEN. Oncogene. 2001;20:1287–1299. doi: 10.1038/sj.onc.1204257. [DOI] [PubMed] [Google Scholar]
- Pierce JW, Schoenleber R, Jesmok G, Best J, Moore SA, Collins T, Gerritsen ME. Novel inhibitors of cytokine-induced IkappaBalpha phosphorylation and endothelial cell adhesion molecule expression show anti-inflammatory effects in vivo. J Biol Chem. 1997;272:21096–21103. doi: 10.1074/jbc.272.34.21096. [DOI] [PubMed] [Google Scholar]
- Qie S, Liang D, Yin C, Gu W, Meng M, Wang C, Sang N. Glutamine depletion and glucose depletion trigger growth inhibition via distinctive gene expression reprogramming. Cell Cycle. 2012;11:3679–3690. doi: 10.4161/cc.21944. [DOI] [PMC free article] [PubMed] [Google Scholar]
- Raja SM, Clubb RJ, Bhattacharyya M, Dimri M, Cheng H, Pan W, Ortega-Cava C, Lakku-Reddi A, Naramura M, Band V, Band H. A combination of Trastuzumab and 17-AAG induces enhanced ubiquitinylation and lysosomal pathway-dependent ErbB2 degradation and cytotoxicity in ErbB2-overexpressing breast cancer cells. Cancer Biol Ther. 2008;7:1630–1640. doi: 10.4161/cbt.7.10.6585. [DOI] [PMC free article] [PubMed] [Google Scholar]
- Rana A, Rangasamy V, Mishra R. How estrogen fuels breast cancer. Future Oncol. 2010;6:1369–1371. doi: 10.2217/fon.10.112. [DOI] [PubMed] [Google Scholar]
- Rathore MG, Saumet A, Rossi JF, de Bettignies C, Tempe D, Lecellier CH, Villalba M. The NF-kappaB member p65 controls glutamine metabolism through miR-23a. Int J Biochem Cell Biol. 2012;44:1448–1456. doi: 10.1016/j.biocel.2012.05.011. [DOI] [PubMed] [Google Scholar]
- Reitzer LJ, Wice BM, Kennell D. Evidence that glutamine, not sugar, is the major energy source for cultured HeLa cells. J Biol Chem. 1979;254:2669–2676. [PubMed] [Google Scholar]
- Robinson MM, McBryant SJ, Tsukamoto T, Rojas C, Ferraris DV, Hamilton SK, Hansen JC, Curthoys NP. Novel mechanism of inhibition of rat kidney-type glutaminase by bis-2-(5-phenylacetamido-1,2,4-thiadiazol-2-yl)ethyl sulfide (BPTES) Biochem J. 2007;406:407–414. doi: 10.1042/BJ20070039. [DOI] [PMC free article] [PubMed] [Google Scholar]
- Sang N, Stiehl DP, Bohensky J, Leshchinsky I, Srinivas V, Caro J. MAPK signaling up-regulates the activity of hypoxia-inducible factors by its effects on p300. J Biol Chem. 2003;278:14013–14019. doi: 10.1074/jbc.M209702200. [DOI] [PMC free article] [PubMed] [Google Scholar]
- Shanware NP, Mullen AR, DeBerardinis RJ, Abraham RT. Glutamine: pleiotropic roles in tumor growth and stress resistance. J Mol Med (Berl) 2011;89:229–236. doi: 10.1007/s00109-011-0731-9. [DOI] [PubMed] [Google Scholar]
- Slamon DJ, Clark GM, Wong SG, Levin WJ, Ullrich A, McGuire WL. Human breast cancer: correlation of relapse and survival with amplification of the HER-2/neu oncogene. Science. 1987;235:177–182. doi: 10.1126/science.3798106. [DOI] [PubMed] [Google Scholar]
- Srivastava SK, Ramana KV. Focus on molecules: nuclear factor-kappaB. Exp Eye Res. 2009;88:2–3. doi: 10.1016/j.exer.2008.03.012. [DOI] [PMC free article] [PubMed] [Google Scholar]
- Thompson CB, Wise DR, DeBerardinis RJ, Mancuso A, Sayed N, Zhang XY, Pfeiffer HK, Nissim I, Daikhin E, Yudkoff M, McMahon SB. Myc regulates a transcriptional program that stimulates mitochondrial glutaminolysis and leads to glutamine addiction. Proc Natl Acad Sci USA. 2008;105:18782–18787. doi: 10.1073/pnas.0810199105. [DOI] [PMC free article] [PubMed] [Google Scholar]
- Turowski GA, Rashid Z, Hong F, Madri JA, Basson MD. Glutamine modulates phenotype and stimulates proliferation in human colon cancer cell lines. Cancer Res. 1994;54:5974–5980. [PubMed] [Google Scholar]
- Vander Heiden MG, Cantley LC, Thompson CB. Understanding the Warburg effect: the metabolic requirements of cell proliferation. Science. 2009;324:1029–1033. doi: 10.1126/science.1160809. [DOI] [PMC free article] [PubMed] [Google Scholar]
- Wang JB, Erickson JW, Fuji R, Ramachandran S, Gao P, Dinavahi R, Wilson KF, Ambrosio AL, Dias SM, Dang CV, Cerione RA. Targeting mitochondrial glutaminase activity inhibits oncogenic transformation. Cancer Cell. 2010;18:207–219. doi: 10.1016/j.ccr.2010.08.009. [DOI] [PMC free article] [PubMed] [Google Scholar]
- Yarden Y, Sliwkowski MX. Untangling the ErbB signalling network. Nat Rev Mol Cell Biol. 2001;2:127–137. doi: 10.1038/35052073. [DOI] [PubMed] [Google Scholar]
- Yin C, Qie S, Sang N. Carbon source metabolism and its regulation in cancer cells. Crit Rev Eukaryot Gene Expr. 2012;22:17–35. doi: 10.1615/critreveukargeneexpr.v22.i1.20. [DOI] [PMC free article] [PubMed] [Google Scholar]
- Yuneva M, Zamboni N, Oefner P, Sachidanandam R, Lazebnik Y. Deficiency in glutamine but not glucose induces MYC-dependent apoptosis in human cells. J Cell Biol. 2007;178:93–105. doi: 10.1083/jcb.200703099. [DOI] [PMC free article] [PubMed] [Google Scholar]


