

Abstract
Background
The biomarker model of Alzheimer’s disease (AD) hypothesizes a dynamic sequence of amyloidosis, neurodegeneration, and cognitive decline, as an individual progresses from preclinical AD to dementia. Despite supportive evidence from cross-sectional studies, verification with long-term within-individual data is needed.
Methods
Autosomal dominant AD (ADAD) mutation carriers, aged 21 years or older (no cognitive restrictions), were recruited from across the United States via referral by colleagues or ADAD families themselves. Sixteen individuals with mutations in PSEN1, PSEN2 or APP, aged 28 to 56, were assessed longitudinally every one to two years, between March 23, 2003 and August 1, 2014. Participants completed two to eight assessments (total=83), over a period of two to eleven years. We measured global amyloid-beta load with Pittsburgh Compound-B PET, posterior cortical metabolism with [18F]fluorodeoxyglucose PET, hippocampal volume (age-, and gender-corrected) with T1 MRI, verbal memory with 10-item delayed word recall, and general cognition with Mini Mental State Exam. We estimated overall biomarker trajectories across estimated years from symptom onset (EYO) using linear mixed models, and compared ADAD estimates to cross-sectional data from cognitively normal, older controls selected to be negative for amyloidosis, hypometabolism, and hippocampal atrophy. In seven individuals with the longest follow-up (seven/eight assessments spanning six to eleven years), we further examined the within-individual progression of amyloidosis, metabolism, hippocampal volume, and cognition, to identify progressive within-individual change in these markers (increase/decrease of greater than two Z-scores standardized to controls).
Findings
Significant differences in ADAD compared to controls (p<0·01) were detected in the following order: increased amyloidosis (−7.5 EYO), decreased metabolism (0 EYO), decreased hippocampal volume and verbal memory (+7.5 EYO), decreased general cognition (+10 EYO). Within-individual examination of AD markers found three individuals demonstrating active amyloidosis, without progressive neurodegeneration or cognitive decline. Two amyloid-positive individuals showed neither active amyloidosis, nor progressive neurodegeneration or cognitive decline. The two remaining amyloid-positive individuals showed progressive neurodegeneration and cognitive decline, without further progressive amyloidosis.
Interpretation
Our results strongly support amyloidosis as the earliest progressive component of the biomarker model in ADAD. Our within-individual examination further suggests three sequential phases across ADAD development: 1) active amyloidosis, 2) stable amyloid-positive and, 3) progressive neurodegeneration and cognitive decline, indicating that amyloid-beta accumulation is largely complete before progressive neurodegeneration and cognitive decline in our ADAD cohort, supporting efforts to target early amyloid-beta deposition as a means of secondary prevention in this population.
Introduction
Alzheimer’s disease (AD) is the leading cause of dementia, expected to affect 13·8 million Americans by 2050.1 The immense burden on patients, families and healthcare systems highlights the urgent need to develop disease-modifying treatments. Although the aggregation and deposition of amyloid-beta (Aβ) proteins in the brain is postulated to be a central event in AD pathogenesis, trials of anti-Aβ therapy in symptomatic patients failed to produce clinical benefits despite some evidence of Aβ clearance.2 It is believed that targeting Aβ at symptomatic stages of AD may be too late to reverse other downstream neurodegenerative processes.2 Indeed, converging evidence from sporadic and autosomal dominant AD (ADAD) supports the presence of a lengthy preclinical phase in AD development, with Aβ abnormality beginning more than a decade prior to onset of clinical disease.3–5 Understanding the progression of these preclinical processes is therefore critical for successful early detection and intervention.
As part of this effort, a biomarker model was proposed by Jack and colleagues6 to describe the hypothetical sequence of dynamic biomarker changes within a single individual, in the order of brain amyloidosis, neurodegeneration, memory deficits, and clinical dysfunction. Empirical verification of this model in ADAD has largely relied on cross-sectional data.3,4,7 However, recent longitudinal evidence from the Dominantly Inherited Alzheimer Network (DIAN) study found that CSF markers of neuronal injury decreased longitudinally in ADAD mutation carriers after their expected age of onset, rather than continuing to increase as predicted by cross-sectional results.8 This highlights the need for longitudinal studies with long follow-up to accurately elucidate the within-individual progression of AD disease markers. This knowledge becomes especially critical as increasing efforts are directed towards secondary prevention trials in preclinical AD,9 requiring biomarkers to assess individual disease stage for trial enrollment, and to monitor treatment response in the absence of clinical symptoms.
The current study sought to test the hypothetical biomarker model in a longitudinal dataset with the longest follow-up reported to-date (up to eight visits, spanning up to eleven years) from a small ADAD cohort. We examined the progression of biomarker trajectories across the entire group, as well as within individuals with the longest follow-up. We hypothesized that cerebral Aβ deposition would be the first biomarker to demonstrate detectable abnormality in preclinical ADAD, prior to detectable changes in neurodegeneration markers or cognition.
Methods
Study design and participants
This prospective cohort study was conducted between March 23, 2003 and August 1, 2014. It was designed to study the natural history of Aβ deposition, neurodegeneration, and cognition in ADAD, across preclinical to symptomatic stages.
ADAD Mutation Carriers
Individuals who carry autosomal dominant mutations in PSEN1, PSEN2, or APP were recruited from ADAD kindreds available through the University of Pittsburgh Alzheimer Disease Research Center (ADRC), as well as from across the United States via referral by colleagues or ADAD families themselves. As an inclusion criterion, all participants had genotyping performed and chose to be informed of their genotype before entering this study. Participants had to be aged 21 years or older. There were no cognitive restrictions, so long as participants could travel and tolerate the protocol. All participants or their Power-of-Attorney or next-of-kin provided written informed consent before inclusion in the study. Genetic status was independently verified. Participants were evaluated through the ADRC and received an extensive clinical evaluation (see appendix). Neuroimaging assessments included Pittsburgh Compound-B (PiB) and [18F]fluorodeoxyglucose (FDG) PET scans, as well as T1 MRI. All symptomatic subjects met either: 1) NINDS-ADRDA criteria for Probable AD and DSM-IV criteria for Dementia of the Alzheimer’s Type10, or 2) ADRC criteria for mild cognitive impairment (MCI)-amnestic or MCI-other. These diagnoses were made at the ADRC consensus conference attended by clinical staff, neurologists, psychiatrists, and neuropsychologists. Additional study details (including sample size and study duration considerations) and inclusion/exclusion criteria are listed in the appendix.
Stage-0 Controls
Control participants for comparisons to ADAD subjects were selected from a group of older, cognitively normal, community-based controls from the Pittsburgh area, who were participating in a separate biomarker study in normal aging, and had undergone PiB-PET, FDG-PET and structural MRI. Participants were between 65 to 89 years of age, with at least 12 years of education. They were negative for a history of major psychiatric or neurological disorder, and were excluded if their performance on an extensive neuropsychological assessment battery yielded results suggesting MCI or dementia. Out of a total pool of 86 participants from that study, we selected all individuals (n=36) who were determined to be in the normal range for global Aβ load, posterior cortical metabolism, and age-, and gender-corrected hippocampal volume, i.e. they met criteria for “Stage-0” of preclinical AD as defined by Jack et al.,11 as controls for this study.
Hippocampal W-score Calculation
A separate group of younger community-based individuals from the Pittsburgh area (n=84), age-matched to the ADAD subjects, were used solely for calculation of the age-, and gender-corrected hippocampal volumes for the ADAD subjects. These individuals were between the ages of 30 to 50, and negative for cardiovascular or cerebrovascular disease, chronic medical illness, and self-reported psychiatric or neurological disorder. These individuals were solely used for the hippocampal volume normalization process and were not used in any comparisons in this study.
All procedures were approved by the University of Pittsburgh Institutional Review Board (Ethics Committee).
Clinical and neuropsychological evaluation
All participants were evaluated with standard neurological, psychiatric, and neuropsychological examinations through the University of Pittsburgh ADRC as previously described.12 The present study focused on the Consortium to Establish a Registry for Alzheimer’s Disease (CERAD) Word List Learning Delayed Recall Test13 and the Mini Mental State Exam (MMSE).14 Parental age of onset was determined using guidelines from the DIAN study,3 and reflects the age of first progressive cognitive decline. The estimated years from expected symptom onset (EYO) was calculated at each assessment as the age of the individual at the time of the assessment minus his/her parental age of onset. The actual age of onset for participants in this study was determined, where applicable, by a Clinical Dementia Rating Scale15 global score greater than zero, evidence of cognitive decline on neuropsychological testing, and a clinical diagnosis of mild cognitive impairment or dementia at the Pittsburgh ADRC consensus meeting. For participants who were symptomatic at study recruitment, actual age of onset was determined by historical information from participant and study informant on the first onset of progressive memory/cognitive decline.16
Neuroimaging acquisition and analysis
Structural T1-weighted MRI was acquired for MRI/PET image coregistration and for hippocampal volume measurement. Hippocampal segmentation was performed using FIRST from FSL toolbox.17 T2-weighted MRI was acquired to estimate intracranial volume (ICV), to control for variation in hippocampal volume due to head size. All raw images, hippocampal and ICV segmentations were visually inspected for quality. Due to scanner upgrade, we acquired 45 datasets on a 1·5T scanner and 38 datasets on a 3T scanner (sequence details in appendix). To correct for scanner differences on hippocampal volume measurements, a separate group of 37 healthy controls were scanned on both systems (aged 56 to 83, mean age = 73, 11 male), to generate a regression-based correction function, following methods detailed in Pfefferbaum et al.18 (see appendix). Lastly, total hippocampal volumes were divided by ICV and converted to W-scores, as described by Jack and colleagues,19 which are age and gender adjusted Z-scores relative to the group of age-matched individuals specifically employed for hippocampal volume normalization (n=84, aged 30 to 50 years, mean age = 41, 37 male).
Cerebral Aβ deposition was measured using PiB-PET with standard methods described previously.20 PiB data was analyzed using the standardized uptake value (SUV) approach, averaged over 50–70 min post-injection. Anatomical regions-of-interest (ROI) were defined as previously described,21 to calculate regional SUV ratio (SUVR) values using pons as reference. A Global-PiB composite was calculated as the weighted average (by number of voxels) from 6 ROIs previously found to be most sensitive to increased PiB retention in AD: anterior cingulate, frontal, lateral temporal, parietal and precuneus cortices, and anteroventral striatum.22 Cerebral glucose metabolism was measured using FDG-PET with standard methods described previously.21 Regional FDG SUVR values were calculated for the same ROIs from PiB analysis, using cerebellum as reference. Posterior cortical metabolism (PC-FDG) was calculated as the weighted average from lateral temporal, parietal and precuneus cortices. PiB and FDG analyses were performed with and without atrophy correction; the non-corrected values are reported here with reference to the atrophy-corrected results as appropriate.
Statistical analysis
Pooling all available data, we fitted overall trajectories for each marker across EYO using linear mixed models with an unstructured correlation and with random intercept in SAS 9·4. Polynomial basis functions were included to incorporate quadratic smoothing.23 We modeled the trajectories across EYO instead of chronological age, as we expect the biology related to ADAD mutations to be the dominating factor in determining the trajectories of these AD markers. Given this relatively young age span, the chronological age of the participants should have minimal effect on statistical modeling. We checked the models for potential outliers and performed a residual analysis. We computed the estimated values and 99% CI from −15 to +15 EYO (at every 2·5-year intervals).
For each marker, we compared the ADAD model estimates, at 2·5-year intervals, against cross-sectional data from the group of “Stage-0” older controls (n=36, aged 65 to 89, mean age=74, 8 male). These cognitively normal controls were selected, using a cutpoint approach,24 to be normal for PiB, FDG, and age-corrected hippocampal W-score. Global-PiB cutoff was determined using sparse k-means cluster analysis as detailed in Cohen et al.22 (1·51, cerebellum-normalized SUVR, non-atrophy-corrected). Cutoff values for PC-FDG (1·02, non-atrophy-corrected) and hippocampal W-score (-0·92) were determined using logistic regression analysis, selected for 85% sensitivity in AD classification using a group of 86 controls (the full group from which the 36 Stage-0 controls were drawn) and 42 AD patients. Note that the hippocampal W-scores in ADAD were determined using age-matched controls, but were then compared to the W-scores of the older Stage-0 controls. As supplementary post-hoc analyses, we examined regional PiB and FDG differences between ADAD and controls in the six Global-PiB and three PC-FDG subregions.
Seven of the participants had completed seven to eight assessments, allowing for within-individual examination of the AD marker trajectories. Raw data for each marker was converted to Z-scores by standardizing to the Stage-0 controls, which was necessary to visualize and compare the various biomarkers on the same graph. The use of the same control group at each time point for standardization would not alter the within-individual trajectories. For each individual, longitudinal values of Global-PiB, PC-FDG, hippocampal W-score and MMSE score, were plotted on the same graph for comparison. We used age-corrected hippocampal W-score, rather than raw hippocampal volume, to isolate changes due to ADAD progression, from any normal aging related changes (which is minimal given this young age span). In examining these within-individual trajectories, we defined active amyloidosis as an increase of greater than two in Z-scores (i.e., two standard deviations of the Stage-0 control sample) in Global-PiB over the longitudinal study period. Similarly, we defined a progressive decline in cerebral metabolism, hippocampal volume, and cognition as a decrease of greater than two in Z-scores in PC-FDG, hippocampal W-Score, and MMSE score, respectively, over the longitudinal study period.
Role of the funding source
The study sponsors had no role in study design, data collection, analysis and interpretation, or writing of the report. The corresponding author (WEK) had full access to all the data and had final responsibility for the decision to submit for publication.
Results
All ADAD mutation carriers initially considered for this study were included, totaling sixteen participants, from six kindreds. Table 1 summarizes the cohort characteristics. Participants completed two to eight assessments, spanning two to eleven years, for a total of 83 assessments. Variation in the number of assessments across participants is due to staggered recruitment of this rare cohort, in particular, younger individuals aged 21 to 30 years were targeted at latter half of the study, as well as participant dropout when they became too impaired to participate in the study. Global-PiB, hippocampal W-score, and cognitive data were available for all assessments. Only 57 FDG scans were available as FDG scanning was stopped in the latter five years of this study except for those who became participants in the DIAN study. Supplementary Table 1 lists the assessments by study year conducted for each participant (labeled with a unique Family ID), whether FDG scanning was available for each assessment, and reasons for study drop-out if applicable. Supplementary Table 2 lists each participant’s estimated age of symptom onset and their actual age of onset if applicable. Data from the baseline assessment of six participants were previously reported in Klunk et al.12 Data from a single assessment from five participants were included as part of the DIAN study reported in Benzinger et al.4
Table 1.
Characteristics of ADAD cohort
| Mutation (n) | PSEN1 (11) PSEN2 (1) APP (4) |
|---|---|
| Age at baseline - yr ± SD | 39.8 ± 8.4 |
| EYO at baseline - yr ± SD | −2.3 ± 9.3 |
| Male sex - n (%) | 8 (50) |
| Education - yr ± SD | 14.2 ± 1.6 |
| APOE ε4 carrier - no. (%) | 2 (12.5) |
| Parental age of onset - yr ± SD | 42.2 ± 3.6 |
| Assessments completed - no. ± SD | 5.1 ± 2.4 |
| Follow-up period - yr ± SD | 5.0 ± 2.9 |
Figure 1 shows the raw data for each AD marker (top row), as well as the overall biomarker trajectories estimated using mixed models across pooled group data (bottom row). We investigated the residuals of the mixed models using residuals diagnostics and found no major departures from normality. Figure 2 illustrates the PiB SUVR images from a single individual across eight longitudinal assessments, visually demonstrating increasing then plateauing PiB retention over time in this individual.
Figure 1. Raw data and estimated group trajectories of neuroimaging and clinical markers.

Raw data for each neuroimaging and clinical marker is plotted against EYO (top row). Each contiguous colored line represents longitudinal data from a single participant. Raw data is being presented without smoothing or jitter as all participants are aware of their mutation status. The estimated trajectory and 99% CI from the mixed models (blue line + blue shaded area) are plotted against EYO for each marker (bottom row). For the hippocampal W-score trajectories, open diamond markers were used to indicate measurements acquired on the 1·5T scanner. A regression correction function had been applied to these measurements to correct for scanner differences.
Figure 2. Longitudinal PiB SUVR images from a single participant across eight assessments.
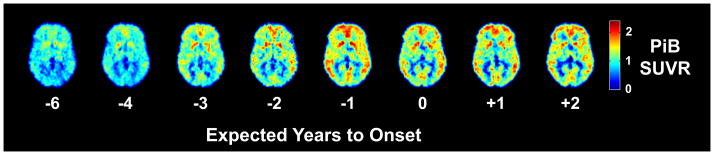
Transaxial PiB SUVR images from a single participant across eight longitudinal assessments, demonstrating increasing then plateauing PiB retention.
For each marker, we compared estimates from the ADAD trajectory (at 2·5-year intervals), against cross-sectional data from 36 “Stage-0” older controls selected to be normal for PiB, FDG, hippocampal W-score, and cognition. Significant differences in ADAD compared to controls (p<0·01) were detected in the following order (figure 3): increased Global-PiB (−7·5 EYO), decreased PC-FDG (0 EYO), decreased hippocampal W-scores and delayed word recall (+7·5 EYO), and decreased MMSE scores (+10 EYO). In addition, our post-hoc analyses found regional variations in the timing of Aβ deposition and FDG hypometabolism in the Global-PiB and PC-FDG subregions (Supplementary figure 1).
Figure 3. Comparison between ADAD and Stage-0 older controls.
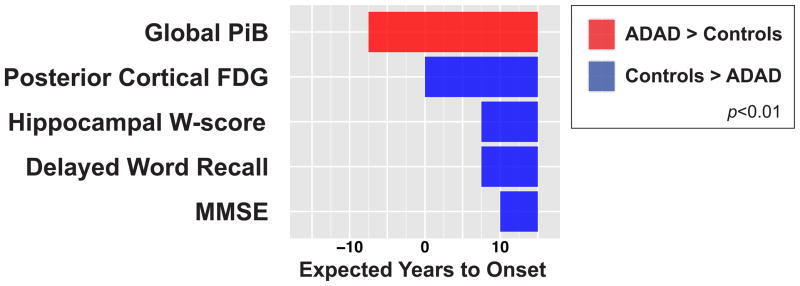
We compared the mixed model estimates for the neuroimaging and clinical markers in ADAD to cross-section data from “Stage-0” older controls who were selected to have normal PiB, FDG, age-corrected hippocampal W-score and cognition. Significant (p<0·01) increases in ADAD are indicated in red while significant decreases are indicated in blue.
We transformed the trajectories of Global-PiB, PC-FDG, hippocampal W-score, and MMSE score, onto a zero to one abnormality scale based on the minimally and maximally abnormal values of each marker within the −15 to +15 EYO period examined in our study. These scaled trajectories are overlaid on the same graph to visualize the evolution of relative AD marker abnormality over time (figure 4).
Figure 4. Temporal evolution of relative abnormality in AD markers.

The ADAD trajectories of Aβ deposition (Global-PiB), neurodegeneration (PC-FDG and hippocampal W-score) and cognition (MMSE scores) were transformed onto a zero to one abnormality scale based on the minimally and maximally abnormal values of each marker within the −15 EYO to +15 EYO period examined in our study. The trajectory for delayed word recall was not included due to the limited dynamic range of this measure leading to an early floor effect.
We further examined the within-individual progression of AD markers (Global-PiB, PC-FDG, hippocampal W-score, and MMSE score) in seven individuals with the longest follow-up (seven to eight assessments, spanning six to eleven years). As shown in figure 5, participants 1-B, 4-B and 3-A showed progressive amyloidosis, without progressive neurodegeneration or cognitive decline. Amyloid-positive participants 2-F and 2-B showed progressive cerebral hypometabolism, hippocampal atrophy (participant 2-B decreased only 1.8 Z-scores), and cognitive decline, without progressive amyloidosis. Amyloid-positive participants 2-D and 2-E did not demonstrate progressive abnormality in any AD markers during their longitudinal study period.
Figure 5. Within-individual trajectories of neuroimaging and clinical markers.

Raw data for each marker was first converted to Z-scores by standardizing to cross-sectional data from the Stage-0 older controls. Each subplot (labeled with the participant’s unique Family ID) presents longitudinal values of Global-PiB, PC-FDG, hippocampal W-score, and MMSE score from a single individual over his/her entire study period. Each horizontal grid line denotes a span of 5 Z-score units. Colored asterisks denote the presence of progressive amyloidosis (increase of greater than two in Z-scores in Global-PiB over the longitudinal study period), and the presence of progressive neurodegeneration and cognitive decline (decrease of greater than two in Z-scores in PC-FDG, hippocampal W-score, or MMSE score, over the longitudinal study period). For the hippocampal W-score trajectories, open diamond markers were used to indicate measurements acquired on the 1·5T scanner. A regression correction function had been applied to these measurements to correct for scanner differences. The trajectory for delayed word recall was not included due to the limited dynamic range of this measure leading to an early floor effect.
Discussion
The dynamic biomarker model predicts that the temporal evolution of biomarker abnormalities in a pure AD pathway follows a sequence of brain amyloidosis, neurodegeneration, and cognitive impairment.25 The clinical and biomarker trajectories estimated from our ADAD cohort support this sequence and add further information regarding the relative timing of biomarker changes on an individual level. Global-PiB was the earliest biomarker to show abnormal change compared to controls, followed by decreased PC-FDG, then decreased hippocampal W-score and delayed word recall, and lastly, decreased MMSE scores. This biomarker abnormality sequence of amyloidosis, hypometabolism, and atrophy is also consistent with the latest cross-sectional findings from large ADAD studies such as DIAN4 and Alzheimer’s Prevention Initiative,7 as well as earlier studies of ADAD.26,27 Of particular interest, Villemagne and colleagues5 estimated the timing of biomarker changes in sporadic AD using longitudinal follow-up, and found a sequence consistent with our current results: increased PiB, hippocampal atrophy, episodic memory deficits, and non-memory cognitive deficits (FDG-PET was not reported). This strong consistency in the sequence of biomarker abnormalities between autosomal dominant and sporadic AD supports the notion that similar pathophysiological processes underlie their disease progression, despite important differences in etiology (increased Aβ production in ADAD versus reduced clearance in sporadic AD).
While statistical comparisons to controls determine the temporal ordering in which AD markers develop detectable abnormality, it is also informative to visualize the evolution of relative biomarker abnormality over time (akin to the hypothetical biomarker curves proposed by Jack and colleagues6,25,28). The scaled AD marker trajectories in figure 4 show early PiB deposition, followed by later changes in neurodegeneration markers, and lastly, cognition. They share similarities with the scaled trajectories presented in Villemagne et al.,5 where early PiB deposition was followed by later changes in neurodegeneration and cognitive markers within three to six years before the onset of dementia. We note near-synchronous progression of our scaled PC-FDG and Hippocampal W-score abnormality trajectories, suggesting that the earlier detection (in EYO) of significant PC-FDG abnormality relative to controls than hippocampal W-score, is likely related to differences in the variance of these measures in the ADAD and control samples, as well as potential baseline differences.
Besides the temporal sequence, the biomarker model predicts a sigmoidal shape for the trajectories.28 Our estimated Global-PiB trajectory displayed a sigmoid shape, reaching a plateau around the estimated age of onset. This is consistent with findings from studies in both ADAD3,7,29 and sporadic AD.5,30,31 However, Benzinger and colleagues4 reported increasing PiB trajectories through +10 EYO in ADAD. This difference may be due to their larger sample size (single assessment from 116 mutation carriers) compared to ours (83 assessments from 16 mutation carriers), potentially providing greater sensitivity. Alternatively, it may reflect inter-individual differences within their cohort due to the cross-sectional nature of the analysis. Our data did not support a plateauing/deceleration of hypometabolism or hippocampal atrophy, consistent with previous findings.3,4,7,32 However, it is important to note that the end-stage of these neurodegeneration trajectories was not studied.
Our consistent observation of a Global-PiB plateau across group and individual trajectories is not likely due to Aβ deposition in the pons reference region or to atrophy. We found no evidence for EYO- or age-related increase in PiB SUV in the pons during the period of plateauing amyloidosis (p>0·5). In addition, three participants demonstrated a PiB plateau with no evidence of ongoing hippocampal atrophy, making progressive atrophy an unlikely confound. We further repeated our analyses with atrophy-corrected PiB and FDG data, and found no notable change to the shape of the group or individual trajectories (data not shown).
The ideal empirical verification of the dynamic biomarker model requires examining the longitudinal progression of these markers within single individuals over the entire length of the AD pathway,28 a virtually unattainable challenge as preclinical to clinical AD development spans multiple decades.3,5,7 The current study performed a piecewise within-individual verification of the biomarker model in seven ADAD participants with the longest follow-up reported to-date (seven to eight assessments spanning six to eleven years). Although each individual covers only a segment of the AD pathway, by comparing and contrasting the within-individual progression of the biomarkers during these different phases of AD development, we were able to infer key features and relationships of the complete trajectories. First, in all three individuals who showed actively increasing Global-PiB, we did not observe a concurrent, progressive decline in neurodegeneration markers or cognition, consistent with the early amyloidosis phase in the biomarker model. On the other hand, in the two individuals who showed progressive neurodegeneration and cognitive decline, this was accompanied by pre-existing amyloidosis that remained stable throughout the study period. In addition, in the remaining two individuals, we observed an intervening stable amyloid-positive period where Global-PiB was elevated/plateaued, and no progressive change in neurodegeneration markers or cognition was detected. The observation of these three sequential phases (1. active amyloidosis, 2. stable amyloid-positive, and 3. progressive neurodegeneration and cognitive decline) over the different periods of AD development demonstrated collectively by these seven individuals, provides strong evidence that amyloidosis is an early event in AD pathogenesis and precedes progressive neurodegeneration in this cohort with a relatively “pure” AD etiology.
The observation of a temporal distinction between amyloidosis and neurodegeneration in our within-individual analysis differs from the greater overlap predicted by the biomarker model,25,28 and remains to be verified in a larger study. This temporal separation is consistent with estimation from Villemagne et al.5 that detectable Aβ deposition precedes abnormal hippocampal atrophy by thirteen years in sporadic AD, and is further consistent with findings that Aβ load is less tightly associated with cognitive outcome than neurodegeneration markers.28 The relative delay in neurodegeneration observed in the current study may reflect neuro-protective effects due to the young age of this ADAD cohort. Alternatively, our neurodegeneration markers may not be sufficiently sensitive to detect the initial onset of hypometabolism and atrophy. Further, the time between PiB-plateau and progressive neurodegeneration appeared to vary greatly between individuals, from no observable lag in one person to the full seven years studied in another. This variability likely reflects additional vulnerability and/or protective factors, leading to variability in brain reserve and the ability to resist neurodegeneration. Additional inter-individual variability may be contributed by differences in specific ADAD mutations, which is only partially muted by modeling trajectories along EYO instead of chronological age. We also observed individual variability in how well the onset of clinical symptoms aligned with parental onset. This may reflect inaccuracies and potential bias in the assessment of parental age of onset based on historical information. Future analysis using mean onset of family members or individuals with the same mutation may improve EYO accuracy.33 Interestingly, the participant who demonstrated early biomarker progression and cognitive decline relative to expected onset (participant 2-F) was a carrier of the APOEε4 allele. Although previous reports associated the APOEε4 allele with earlier age of onset in ADAD, a recent meta-analysis did not find this effect to be significant.33 It will be important to uncover and understand additional vulnerability and protective factors that modify individual disease progression, as they may inform the development of novel neuro-protective therapies.
The major limitation of the current study is the small sample size, constrained by the rarity of the ADAD cohort and by the challenges of conducting a multi-modal longitudinal study with such long follow-up. Although the number of assessments available (n=83) is within the range of recent ADAD studies,3,4,7,29 the small sample size nonetheless presented a limitation for complex statistical modeling. Another major limitation is our use of cross-sectional data from an older control group for comparison, as our study did not allow for concurrent, longitudinal assessment of age-matched, non-mutation-carrying family members. While the temporal ordering of biomarker changes reported here is consistent with prior studies, there is an apparent delay in the absolute time (in EYO) when significant changes in ADAD compared to controls were detected. This is likely due to reduced statistical power due to our small sample size and the variability in our cohort (e.g. different ADAD mutations), as well as inaccuracies in the EYO measure. Our use of an older control group, despite using cognitively normal individuals and further selecting for normal PiB, FDG, and age-corrected hippocampal W-score, likely contributed to the delay in detectable changes, but should have minimal effects on their temporal ordering. Another limitation is the lack of CSF tau measurements to detect the progression of neuronal injury. Additionally, we were unable to control for possible effect of family in the mixed models due to our small sample size. We also acknowledge that since the overall biomarker trajectories were estimated across the entire group, they (and their comparison to controls) are influenced by between-person evidence. In contrast, the conclusions drawn from the within-individual comparisons were purely longitudinal.
In summary, our data from this ADAD cohort supports the general characteristics of the biomarker model of pure AD,25 and extends the understanding of how this model applies to individual subjects studied longitudinally. Our findings clearly support Aβ as the earliest biomarker to show progressive change. Our results also suggest that Aβ accumulation is largely complete prior to the initiation of progressive neurodegeneration and cognitive decline. These findings support efforts to target early Aβ deposition as a means of secondary prevention at least in the ADAD population. How our findings generalize to sporadic AD remains to be verified, as mixed pathology due to aging and non-AD causes is prevalent. However, this knowledge of the biomarker sequence in the pure AD pathway should provide an important foundation to understand the interactions between AD and other neurodegenerative processes.
Research in context
Evidence before this study
We searched PubMed for “autosomal dominant”/”familial” AND “Alzheimer’s” with and without “longitudinal”, as well as “dynamic biomarker” AND “Alzheimer’s”, up to March 1, 2015. Critical review of the literature revealed a growing consensus that the development of Alzheimer’s disease (AD) begins with an extended preclinical stage lasting one to two decades before the onset of cognitive symptoms. Targeting these preclinical processes may offer the best opportunity for disease-modifying treatments. Jack and colleagues6 proposed a biomarker model which hypothesized the sequence of dynamic biomarker abnormality from preclinical AD to dementia within a single individual. Empirical verification of this model in sporadic AD has been challenged by the lack of strong predictive factors to identify which individuals and when they might develop AD. Autosomal dominant AD (ADAD), due to the fully penetrant nature of associated mutations and the relative predictability of symptom onset, has become an important model for studying the preclinical to clinical AD spectrum. Recent studies in ADAD, including the Dominantly Inherited Alzheimer Network (DIAN)3,4 and Alzheimer’s Prevention Initiative (API)7,25 studies, have offered valuable cross-sectional evidence in support of the biomarker model. However, optimal verification requires long-term within-individual examination of these AD markers.
Added value of this study
Our study presents the longest within-individual multi-modal neuroimaging follow-up reported to-date, with up to eight assessments, spanning up to eleven years. Our imaging and clinical marker trajectories, estimated from pooled longitudinal data, provide further empirical evidence for the temporal ordering and the shape of these dynamic AD markers. The observed sequence of abnormality in comparison to controls - amyloidosis, hypometabolism, hippocampal atrophy and memory deficit, and general cognitive deficit - is consistent with the biomarker model proposed for pure AD. Most importantly, our study helps to fill a critical gap in knowledge by presenting within-individual verification of the biomarker model in seven ADAD mutation carriers with the longest follow-up (seven to eight assessments over six to eleven years). These individuals covered different segments of the preclinical to clinical AD pathway, allowing us to study the with-individual progression of amyloidosis, neurodegeneration (hypometabolism and hippocampal atrophy), and general cognition during different periods of AD development. The three sequential phases that we observed: 1) active amyloidosis without progressive neurodegeneration, 2) amyloid-plateau without progressive neurodegeneration, 3) amyloid-plateau with neurodegeneration and cognitive decline, provide very strong support for amyloidosis as the earliest progressive component of the biomarker model, and for the sigmoidal shape of the amyloid-beta trajectory. These temporal profiles further suggest that amyloid-beta accumulation is largely complete before the initiation of progressive neurodegeneration and cognitive decline in this young ADAD cohort. This is a novel finding that differs from the greater overlap predicted by the biomarker model, and may have important implications for treatment timing.
Implications of all the available evidence
Our results add to existing evidence that amyloidosis is an early pathological event in AD. The current novel within-individual comparisons further suggest that, in this relatively young ADAD cohort, there may be greater temporal distinction between dynamic amyloidosis and progressive neurodegeneration and cognitive decline than previously proposed. This supports current efforts to target early amyloid-beta deposition as a means of secondary prevention in this population. The individual variability we observed in the time between amyloid-plateau and progressive neurodegeneration suggests additional vulnerability and/or protective factors that modify disease course. It will be important to uncover and understand these factors, as they may inform the development of novel neuro-protective therapies. Future research should focus on extending these findings to sporadic AD, to understand how mixed pathologies due to aging and non-AD causes interacts with the pure AD pathway. Lastly, our study highlights the importance of longitudinal studies with long follow-up to fully elucidate complex and extended pathogenesis processes such as AD.
Supplementary Material
Acknowledgments
Funding: National Institutes of Health and Howard Hughes Medical Institute
This study was funded by the National Institutes of Health (P50 AG005133, U19 AG032438, P01 AG025204, R37 AG025516, and R01 HL089850), and a Howard Hughes Medical Institute Medical Research Fellowship. We thank our research participants; without their generosity and dedication, this study would not have been possible.
Footnotes
Contributors
HJA, JCP, CAM, OLL, WEK participated in study concept and design. WYY, DLT, EMM, SI, JAJ, DM, WM, LKS, BES, LW, PJG, HJA, JCP, CAM, OLL, and WEK participated in the acquisition, analysis or interpretation of data, and in the critical revision of the manuscript. WYY and WEK drafted the manuscript. WYY, DLT, WM, and LW performed statistical analysis. EMM, PJG, HJA, JCP, CAM, OLL, and WEK obtained funding. SI, JAJ, DM, LKS, BES, PJG, HJA, JCP, CAM, OLL, and WEK provided administrative, technical or material support. EMM, BES, JCP, CAM, OLL, and WEK supervised the study.
Conflicts of interest
GE Healthcare holds a license agreement with the University of Pittsburgh based on the technology described in this manuscript. WEK and CAM are co-inventors of Pittsburgh Compound-B and, as such, have a financial interest in this license agreement. GE Healthcare provided no grant support for this study and had no role in the design or interpretation of results or preparation of this manuscript. EMM receives personal compensation for work on the Dominantly Inherited Alzheimer Network Trial Unit (DIAN-TU) therapeutics trial committee. OLL served as a consultant to Lundbeck and Grifols. All other authors have no conflicts of interest with this work. Once all clinical evaluations and image analyses were complete (each blinded to the other) and the data frozen, all authors had full access to all of the data in the study and take responsibility for the integrity of the data and the accuracy of the data analysis (with the exception of specific genetic testing results accessible only to WEK due to confidentiality reasons).
Publisher's Disclaimer: This is a PDF file of an unedited manuscript that has been accepted for publication. As a service to our customers we are providing this early version of the manuscript. The manuscript will undergo copyediting, typesetting, and review of the resulting proof before it is published in its final citable form. Please note that during the production process errors may be discovered which could affect the content, and all legal disclaimers that apply to the journal pertain.
References
- 1.Alzheimer’s Association. 2014 Alzheimer’s disease facts and figures. Alzheimers Dement. 2014;10:e47–92. doi: 10.1016/j.jalz.2014.02.001. [DOI] [PubMed] [Google Scholar]
- 2.Sperling RA, Jack CR, Aisen PS. Testing the right target and right drug at the right stage. Science Translational Medicine. 2011;3:111cm33. doi: 10.1126/scitranslmed.3002609. [DOI] [PMC free article] [PubMed] [Google Scholar]
- 3.Bateman RJ, Xiong C, Benzinger TLS, et al. Clinical and biomarker changes in dominantly inherited Alzheimer’s disease. N Engl J Med. 2012;367:795–804. doi: 10.1056/NEJMoa1202753. [DOI] [PMC free article] [PubMed] [Google Scholar]
- 4.Benzinger TLS, Blazey T, Jack CR, et al. Regional variability of imaging biomarkers in autosomal dominant Alzheimer’s disease. Proceedings of the …. 2013 doi: 10.1073/pnas.1317918110. [DOI] [PMC free article] [PubMed] [Google Scholar]
- 5.Villemagne VL, Burnham S, Bourgeat P, et al. Amyloid β deposition, neurodegeneration, and cognitive decline in sporadic Alzheimer’s disease: a prospective cohort study. Lancet Neurol. 2013;12:357–67. doi: 10.1016/S1474-4422(13)70044-9. [DOI] [PubMed] [Google Scholar]
- 6.Jack CR, Knopman DS, Jagust WJ, et al. Hypothetical model of dynamic biomarkers of the Alzheimer’s pathological cascade. Lancet Neurol. 2010;9:119–28. doi: 10.1016/S1474-4422(09)70299-6. [DOI] [PMC free article] [PubMed] [Google Scholar]
- 7.Fleisher AS, Chen K, Quiroz YT, et al. Associations Between Biomarkers and Age in the Presenilin 1 E280A Autosomal Dominant Alzheimer Disease Kindred: A Cross-sectional Study. JAMA Neurol. 2015 doi: 10.1001/jamaneurol.2014.3314. [DOI] [PMC free article] [PubMed] [Google Scholar]
- 8.Fagan AM, Xiong C, Jasielec MS, et al. Longitudinal change in CSF biomarkers in autosomal-dominant Alzheimer’s disease. Science Translational Medicine. 2014;6:226ra30. doi: 10.1126/scitranslmed.3007901. [DOI] [PMC free article] [PubMed] [Google Scholar]
- 9.Sperling RA, Karlawish J, Johnson KA. Preclinical Alzheimer disease-the challenges ahead. Nat Rev Neurol. 2013;9:54–8. doi: 10.1038/nrneurol.2012.241. [DOI] [PMC free article] [PubMed] [Google Scholar]
- 10.Physicians AAOF, Association AP. Diagnostic and Statistical Manual of Mental Disorders. 4. American Psychiatric Pub; 1995. [Google Scholar]
- 11.Jack CR, Knopman DS, Weigand SD, et al. An operational approach to National Institute on Aging-Alzheimer’s Association criteria for preclinical Alzheimer disease. Ann Neurol. 2012;71:765–75. doi: 10.1002/ana.22628. [DOI] [PMC free article] [PubMed] [Google Scholar]
- 12.Klunk WE, Price JC, Mathis CA, et al. Amyloid deposition begins in the striatum of presenilin-1 mutation carriers from two unrelated pedigrees. J Neurosci. 2007;27:6174–84. doi: 10.1523/JNEUROSCI.0730-07.2007. [DOI] [PMC free article] [PubMed] [Google Scholar]
- 13.Welsh KA, Butters N, Mohs RC, et al. The Consortium to Establish a Registry for Alzheimer’s Disease (CERAD) Part V. A normative study of the neuropsychological battery. Neurology. 1994;44:609–9. doi: 10.1212/wnl.44.4.609. [DOI] [PubMed] [Google Scholar]
- 14.Folstein MF, Folstein SE, McHugh PR. ‘Mini-mental state’. A practical method for grading the cognitive state of patients for the clinician. J Psychiatr Res. 1975;12:189–98. doi: 10.1016/0022-3956(75)90026-6. [DOI] [PubMed] [Google Scholar]
- 15.Morris JC. The Clinical Dementia Rating (CDR): current version and scoring rules. Neurology. 1993;43:2412–4. doi: 10.1212/wnl.43.11.2412-a. [DOI] [PubMed] [Google Scholar]
- 16.Lopez OL, Becker JT, Klunk W, et al. Research evaluation and diagnosis of probable Alzheimer’s disease over the last two decades: I. Neurology. 2000;55:1854–62. doi: 10.1212/wnl.55.12.1854. [DOI] [PubMed] [Google Scholar]
- 17.Patenaude B, Smith SM, Kennedy DN, Jenkinson M. A Bayesian model of shape and appearance for subcortical brain segmentation. NeuroImage. 2011;56:907–22. doi: 10.1016/j.neuroimage.2011.02.046. [DOI] [PMC free article] [PubMed] [Google Scholar]
- 18.Pfefferbaum A, Rohlfing T, Rosenbloom MJ, Sullivan EV. Combining atlas-based parcellation of regional brain data acquired across scanners at 1.5 T and 3. 0 T field strengths. NeuroImage. 2012;60:940–51. doi: 10.1016/j.neuroimage.2012.01.092. [DOI] [PMC free article] [PubMed] [Google Scholar]
- 19.Jack CR, Petersen RC, Xu YC, et al. Medial temporal atrophy on MRI in normal aging and very mild Alzheimer’s disease. Neurology. 1997;49:786–94. doi: 10.1212/wnl.49.3.786. [DOI] [PMC free article] [PubMed] [Google Scholar]
- 20.Klunk WE, Engler H, Nordberg A, et al. Imaging brain amyloid in Alzheimer’s disease with Pittsburgh Compound-B. Ann Neurol. 2004;55:306–19. doi: 10.1002/ana.20009. [DOI] [PubMed] [Google Scholar]
- 21.Cohen AD, Price JC, Weissfeld LA, et al. Basal cerebral metabolism may modulate the cognitive effects of Abeta in mild cognitive impairment: an example of brain reserve. J Neurosci. 2009;29:14770–8. doi: 10.1523/JNEUROSCI.3669-09.2009. [DOI] [PMC free article] [PubMed] [Google Scholar]
- 22.Cohen AD, Mowrey W, Weissfeld LA, et al. Classification of amyloid-positivity in controls: comparison of visual read and quantitative approaches. NeuroImage. 2013;71:207–15. doi: 10.1016/j.neuroimage.2013.01.015. [DOI] [PMC free article] [PubMed] [Google Scholar]
- 23.Pedan A. Smoothing with SAS Proc Mixed. Seattle SAS Users Group International Proceedings; March 2003; p. 30. [Google Scholar]
- 24.Jack CR, Vemuri P, Wiste HJ, et al. Evidence for ordering of Alzheimer disease biomarkers. Arch Neurol. 2011;68:1526–35. doi: 10.1001/archneurol.2011.183. [DOI] [PMC free article] [PubMed] [Google Scholar]
- 25.Jack CR, Holtzman DM. Biomarker modeling of Alzheimer’s disease. Neuron. 2013;80:1347–58. doi: 10.1016/j.neuron.2013.12.003. [DOI] [PMC free article] [PubMed] [Google Scholar]
- 26.Mosconi L, Sorbi S, de Leon MJ, et al. Hypometabolism exceeds atrophy in presymptomatic early-onset familial Alzheimer’s disease. J Nucl Med. 2006;47:1778–86. [PubMed] [Google Scholar]
- 27.Villemagne VL, Ataka S, Mizuno T, et al. High striatal amyloid beta-peptide deposition across different autosomal Alzheimer disease mutation types. Arch Neurol. 2009;66:1537–44. doi: 10.1001/archneurol.2009.285. [DOI] [PubMed] [Google Scholar]
- 28.Jack CR, Knopman DS, Jagust WJ, et al. Tracking pathophysiological processes in Alzheimer’s disease: an updated hypothetical model of dynamic biomarkers. Lancet Neurol. 2013;12:207–16. doi: 10.1016/S1474-4422(12)70291-0. [DOI] [PMC free article] [PubMed] [Google Scholar]
- 29.Fleisher AS, Chen K, Quiroz YT, et al. Florbetapir PET analysis of amyloid-β deposition in the presenilin 1 E280A autosomal dominant Alzheimer’s disease kindred: a cross-sectional study. Lancet Neurol. 2012;11:1057–65. doi: 10.1016/S1474-4422(12)70227-2. [DOI] [PMC free article] [PubMed] [Google Scholar]
- 30.Caroli A, Frisoni GB. The dynamics of Alzheimer‘s disease biomarkers in the Alzheimer’s Disease Neuroimaging Initiative cohort. Neurobiol Aging. 2010;31:1263–74. doi: 10.1016/j.neurobiolaging.2010.04.024. [DOI] [PMC free article] [PubMed] [Google Scholar]
- 31.Jack CR, Wiste HJ, Lesnick TG, et al. Brain -amyloid load approaches a plateau. Neurology. 2013;80:890–6. doi: 10.1212/WNL.0b013e3182840bbe. [DOI] [PMC free article] [PubMed] [Google Scholar]
- 32.Ridha BH, Barnes J, Bartlett JW, et al. Tracking atrophy progression in familial Alzheimer’s disease: a serial MRI study. Lancet Neurol. 2006;5:828–34. doi: 10.1016/S1474-4422(06)70550-6. [DOI] [PubMed] [Google Scholar]
- 33.Ryman DC, Acosta-Baena N, Aisen PS, et al. Symptom onset in autosomal dominant Alzheimer disease: a systematic review and meta-analysis. Neurology. 2014;83:253–60. doi: 10.1212/WNL.0000000000000596. [DOI] [PMC free article] [PubMed] [Google Scholar]
Associated Data
This section collects any data citations, data availability statements, or supplementary materials included in this article.