

Abstract
Purpose
Previous studies have shown a bidirectional relationship between diabetes and pancreatic cancer (PC). In particular, new-onset diabetes might be induced by PC, and people with long-term diabetes might be at increased risk for the development of PC. The purpose of our study was to examine whether long-term diabetes represented an independent risk factor for PC development.
Methodology
A literature search was performed by searching electronic databases for studies published before July 1, 2014, and relative risks (RRs) and corresponding 95% confidence intervals (CIs) were calculated. Data pertaining to diabetes were recorded at both individual and study levels, with RRs calculated separately to analyze the relationship between the duration of diabetes and the development of PC.
Results
Forty-four studies were included in this meta-analysis, including 18 studies with a case-control design, 5 with a nested case-control design and 21 with a cohort design. The overall summary estimate for the relationship between the population with a duration of diabetes ≥2 years and PC was 1.64 (1.52-1.78). The pooled RR (95% CI) of PC for the population with a duration of diabetes ≥5 years was 1.58 (1.42-1.75). For the population with a duration of diabetes ≥10 years, the RR (95% CI) of PC was 1.50 (1.28-1.75).
Conclusions
Our study suggests that long-term diabetes mellitus is associated with an increased risk of PC. However, the level of risk is negatively correlated with increasing diabetes mellitus duration.
Introduction
Diabetes and cancer are common diseases, the incidences of which are increasing rapidly worldwide. The International Diabetes Federation (IDF) estimated the prevalence of diabetes in adults (20–79 years old) to be 9.6% in 2013, and this number is projected to grow from 8.0% to 9.9% by 2035 in North America and the Caribbean [1]. Furthermore, the IDF expects the prevalence of this disease to reach 9.8% by 2035 in South and Central America [2]. In the European region, the overall prevalence was estimated to be 8.5% in 2013 [3]. Additionally, the WHO has projected that the global cancer incidence will increase from 14 million in 2012 to 22 million in 2032 [4].
Diabetes and cancer have been closely linked epidemiologically and biologically. Convincing evidence has indicated that diabetes (mainly type 2) is associated with an increased risk for several cancers (colorectal, breast, endometrium, liver, pancreas, and bladder) [5] and that diabetes can advance the cancer stage and increase mortality [6–7]. The risk of pancreatic cancer (PC) is increased among individuals with glucose intolerance, including those with excess weight, diabetes mellitus (DM), and high serum glucose. The mechanisms of these associations include the tumorigenic effect of hyperglycemia, the mitogenic effect of obesity-associated hyperinsulinemia and the chronic, subclinical inflammation caused by fat infiltration of the pancreas. However, there has been little direct evidence supporting these mechanisms.
PC is a highly aggressive cancer, with a 5-year overall survival rate of less than 1.0%, and is one of the most frequent causes of cancer deaths worldwide [8]. Surgical resection is considered the best potentially curative treatment for PC, and major advances in this field have successfully lowered the mortality from this disease. However, the impact of surgical resection on overall survival remains minimal, and the local failure rate might remain as high as 50% to 80% in patients who successfully undergo surgical resection, resulting in poor quality of life [9].
Several risk factors such as older age, genetic predisposition, and smoking have been identified as contributors to the burden of PC. Diabetes is also widely considered to be associated with PC, although whether diabetes is a cause or a consequence of PC remains controversial. New-onset diabetes could be a symptom caused by PC development, and people with long-term diabetes might be at increased risk for PC.
Several previously published articles have focused on the incidence and mortality of PC associated with diabetes; however, few studies have clearly demonstrated a relationship between the duration of diabetes and PC. Three meta-analyses showed an association between PC and diabetes [10–12]. First, Batabyal et al. performed an analysis focusing on individual categories of disease duration, including <1, 1–4, 5–9 and ≥10 years. This group found that the risk of PC was greatest early after the diagnosis of DM but that it remained elevated long after the diagnosis; the individual relative risk (RR) ranged from 6.69 at <1 year to 1.36 at 10 years [12]. The other two meta-analyses did not study the association between PC and the duration of diabetes.
The aim of our analysis was to examine the influence of long-term diabetes on PC incidence. If a long-term history of diabetes is an independent risk factor for PC, health professionals and clinical doctors should consider patients with this disease to be at high risk and should strongly encourage PC screening and provide appropriate prevention guidelines.
Methods
Search strategy and selection criteria
We searched the PubMed, EMBASE and Web of Science databases using the terms “diabetes mellitus,” “pancreas” and “cancer,” as well as the corresponding individual free terms, to acquire articles that were published before July 1, 2014. Furthermore, we reviewed studies in the references of the retrieved articles to search for additional potentially eligible studies.
The inclusion criteria of the meta-analysis were as follows: (1) the study was defined as a case-control study, a nested case-control study or a cohort study and was published before June 2014; (2) the exposure of interest was diabetes, and the outcome of interest was the incidence of PC; (3) the odds ratios (ORs), RRs, incidence rate ratios (IRRs), hazard ratios (HRs) or standardized incidence rates (SIRs), with their 95% confidence intervals (CIs), were reported; and (4) in case-control studies, the participants were diagnosed with diabetes mellitus at least 2 years before participating in the studies, whereas in nested case-control and cohort studies, the participants with a history of diabetes were followed up for at least 2 years prior to the diagnosis of PC. The exclusion criteria were as follows: (1) publications with incomplete data; (2) studies that only focused on the mortality or survival ratio, with death as the outcome instead of the PC incidence; and (3) the study population recruitment overlapped (in which case we only included the most recent study or the study with the largest number of participants).
Data extraction
Two investigators independently performed the data extraction using a standardized protocol and a data-recording form, and the extractions were then checked by the other authors. The data were independently examined and adjudicated after being extracted and assessed.
The extracted data included the following information: author, year of publication, region, year in which the study was conducted, age, source and number of subjects, gender, mean number of follow-up years, cases/controls with or without DM, elected diabetes duration, sampling scheme, adjusted factors and adjusted ORs/RRs/SIRs/HRs with 95% CIs.
Quality assessment
The quality of each study was independently evaluated by two investigators according to the Newcastle-Ottawa Scale (NOS), which comprises three parameters for quality assessment: selection, comparability and exposure for case-control studies; and selection, comparability and outcome for cohort studies [13]. The NOS measurements use four stars for selection: two stars for comparability and three stars for exposure or outcome.
The standards of quality assessment using the NOS in case-control and nested case-control studies are as follows, with each item able to receive one star: 1. Case definition adequate: PC cases with independent diagnosis validation; 2. Representativeness of the cases: consecutive or obviously representative series of PC cases; 3. Selection of controls: controls were from community; 4. Definition of controls: controls had no PC history; 5. Comparability of cases and controls on the basis of the design or analysis with a major factor: study controls for age; 6. Comparability with an additional factor: study controls for any additional factor, for example, sex; 7. Ascertainment of exposure: DM diagnosis with plasma glucose concentration criteria and secure records; 8. Same method of ascertainment for cases and controls: exposure of cases and controls with same ascertainment method; and 9. Non-Response rate: same rate for both groups.
The standards of quality assessment using the NOS in cohort studies are as follows, with each item able to receive one star: 1. Representativeness of the exposed cohort: representative of the average DM incidence in the community from which the group was selected; 2. Selection of the non-exposed cohort: drawn from the same community as the exposed cohort. 3. Ascertainment of exposure: DM diagnosis with plasma glucose concentration criteria and secure records. 4. Outcome not present at start: demonstration that PC was not present at the start of the study. 5. Comparability of cases and controls on the basis of the design or analysis with a major factor: study controls for age. 6. Comparability with an additional factor: study controls for any additional factor, for example, sex. 7. Assessment of outcome: with PC diagnosis certification or record. 8. Follow-up length: follow-up length ≥2 years was considered adequate. 9. Adequacy of follow up: complete follow up that accounted for all subjects or that lost only a small number of subjects.
We defined studies with NOS scores of 1–3 as low quality, those with scores of 4–6 as medium quality, and those with scores of 7–9 as high quality. Studies with discrepancies were simultaneously re-evaluated by the two investigators.
Statistical analyses
We included different measurements in this meta-analysis, ORs were included for the case-control studies, whereas RRs, IRRs, SIRs and HRs were included for the nested case-control studies and cohort studies. Because of the low worldwide incidence of PC, in practice, these effect measures are assumed to be approximately equivalent to the RR. Therefore, we used the pooled RR and its 95% CI to estimate the risk of PC in long-term DM patients in the present study.
Heterogeneity across the studies was checked with the Q-test, which was considered significant when P<0.1. The I2 statistic presented the percentage of total variation across studies as a result of heterogeneity. If I2>50%, obvious heterogeneity was demonstrated, and a random-effect model was used. Otherwise, a fixed-effect model was used to pool the data [14].
Summary estimates of the population diagnosed with DM and followed up for at least 2, 5 and 10 years before participating in the studies were all calculated using a random-effect model.
We conducted sensitivity analysis to investigate the influence of a single study on the overall meta-analysis estimate. Additionally, subgroup analyses that stratified the data separately by gender, study design and region with different DM durations were performed to examine how the strengths of the association varied.
Publication bias was evaluated using Begg’s test [15], and bias was considered to exist when P<0.05. Subsequently, Begg’s funnel plot was created. All of the statistical analyses were performed using Stata software, version 11.0.
Results
Study characteristics and quality assessment results
We identified 2,614 relevant titles through electronic searches and screened them based on our search criteria, resulting in 630 potentially relevant full-text articles. Of these articles, 44 studies from 36 articles were analyzed (Fig 1). Of the 44 studies included in this meta-analysis, 18 used a case-control design (Table 1), 5 used a nested case-control design (Table 2), and 21 were cohort studies (Table 3).
Fig 1. Flow chart showing the study selection process.
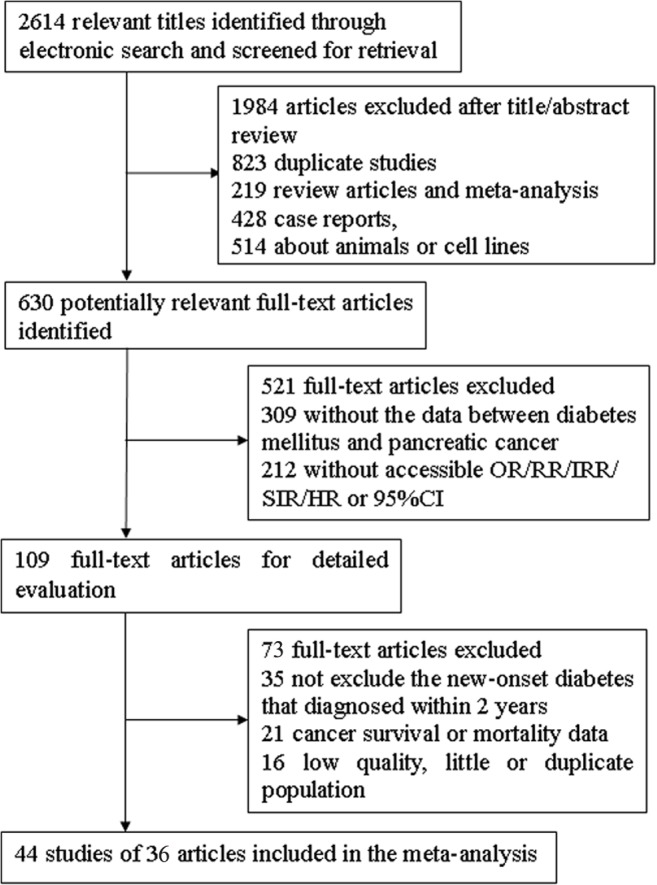
Table 1. Characteristics of 18 case-control studies.
| Author/year/region | Age | Gender (% male) | Case (DM with elected duration/ Non-DM), N | Control (DM with elected duration/ Non-DM), N | Elected DM duration, years | Sampling scheme a [70] | Adjusted factors | |||||
|---|---|---|---|---|---|---|---|---|---|---|---|---|
| ≥2-year | ≥5-year | ≥10-year | ≥2-year | ≥5-year | ≥10-year | Control selection | Interpretation of reported effect measure | |||||
| Cuzick/1989/England [16] | NA | Both (48.5) | 9/188 | 9/188 | NA | 3/274 | 3/274 | NA | >5 | Patients with non-tumor disease, the same hospital and period | Prevalence OR | Age and gender |
| Farrow/1990/America [17] | 20–74 | Male | 12/156 | NA | NA | 3/192 | NA | NA | ≥3 | Population | Prevalence OR | Age, smoking and education |
| Jain/1991/Canada [18] | 35–79 | Both (54.5) | 21/190 | 21/190 | 12/190 | 35/458 | 35/458 | 24/458 | >5 | Population | Prevalence OR | Smoking, calories and fiber intake |
| Bueno de Mesquita/1992/the Netherlands (M) [19] | 35–79 | Male | 3/85 | 3/85 | NA | 12/213 | 12/213 | NA | ≥5 | Population | Prevalence OR | Age, response status and smoking |
| Bueno de Mesquita/1992/the Netherlands (F) [19] | 35–80 | Female | 4/64 | 4/64 | NA | 13/224 | 13/224 | NA | ≥5 | Population | Prevalence OR | Age, response status and smoking |
| Gullo/1994/Italy [20] | 22–79 | Both (NA) | 83/556 | 61/556 | 34/556 | 56/660 | 36/660 | 32/660 | ≥2 | Patients with non-tumor disease, the same hospital and period | Prevalence OR | NA |
| Lee/1996/China [21] | NA | Both (78.7) | 54/201 | NA | NA | 28/247 | NA | NA | >3 | Physical checkup, the same hospital and period | Prevalence OR | Smoking, alcohol, history of cholecystectomy and gastric resection |
| Frye/2000/New Zealand [22] | NA | Both (50.0) | 9/88 | 9/88 | NA | 7/107 | 7/107 | NA | >5 | Patients with non-tumor disease, the same hospital and period | Prevalence OR | NA |
| Bonelli/2003/Italy [23] | 18–75 | Both (57.4) | 21/165 | 16/165 | NA | 22/374 | 18/374 | NA | ≥3 | Patients with non-tumor disease, the same hospital and period | Prevalence OR | Age, gender, smoking, alcohol, center, education and occupation |
| Lo/2007/Egypt [24] | 14–90 | Both (57.7) | 13/139 | 13/139 | 13/139 | 3/168 | 3/168 | 3/168 | ≥10 | Patients with non-tumor disease, the same hospital and period | Prevalence OR | Age, gender, and residence |
| Anderson/2009/Canada [25] | <80 | Both (55.7) | 50/371 | NA | NA | 34/274 | NA | NA | >2 | Population | Prevalence OR | Age |
| Kuang/2009/China [26] | 61.5 | Both (65.7) | 43/319 | 29/319 | 10/319 | 29/702 | 19/702 | 6/702 | ≥2 | Patients with non-tumor disease, the same hospital and period | Prevalence OR | NA |
| Maisonneuve/2010/Australia, Canada, the Netherlands and Poland [27] | NA | Both (52.5) | 39/679 | 39/679 | 39/679 | 54/1546 | 54/1546 | 54/1546 | ≥10 | Population | Prevalence OR | Age, gender, smoking, education, center, and type of interview |
| Li/2011/USA [28] | NA | Both (57.8) | 276/1744 | 186/1744 | 108/1744 | 456/4552 | 350/4552 | 229/4552 | >2 | Population | Prevalence OR | Age, gender, race, education, smoking, alcohol, body mass index (BMI) and study site |
| Lipworth/2011/Italy [29] | NA | Both (65.9) | 76/585 | 51/585 | 23/585 | 108/2077 | 86/2077 | 59/2077 | ≥2 | Patients with non-tumor disease, the same hospital and period | Prevalence OR | Age, gender, smoking, BMI, center, year of interview and education |
| Ben/2011/China [30] | NA | Both (66.9) | 96/1055 | NA | NA | 63/1377 | NA | NA | ≥2 | Patients with non-tumor disease, the same hospital and period | Prevalence OR | Age, smoking, alcohol, family history of pancreatic cancer |
| Bosetti/2012/Italy and Switzerland [31] | NA | Both (53.4) | 57/269 | NA | NA | 37/615 | NA | NA | ≥2 | Patients with non-tumor disease, the same hospital and period | Prevalence OR | Age, gender, center, year of interview, education, alcohol, smoking and BMI |
| Henry/2013/USA (1) [32] | ≥20 | Both (57.6) | 28/172 | 19/172 | 11/172 | 42/631 | 36/631 | 22/631 | ≥2 | Population | Prevalence OR | Age, gender, race, education, smoking, alcohol and pack-years |
a. The cases of the case-control studies are all prevalent cases.
Table 2. Characteristics of 6 nested case-control studies.
| Author/year/region | Age | Gender (% male) | Case (DM with elected duration/ Non-DM), N | Control (DM with elected duration/ Non-DM), N | Elected DM duration, years | Sampling Scheme [70] | Adjusted factors | ||||||||
|---|---|---|---|---|---|---|---|---|---|---|---|---|---|---|---|
| ≥2-year | ≥5-year | ≥10-year | ≥2-year | ≥5-year | ≥10-year | Case selection | Population | Control selection | Assumptions a | Interpretation of reported effect measure | |||||
| Hiatt/1988/USA [33] | >25 | Both (44.1) | 5/44 | NA | NA | 230/11874 | NA | NA | ≥5.7 | Incidentcases | Closed population | End of follow-up | Rare disease | RR | Age |
| Attner/2012/Sweden [34] | All ages | Both (53) | 51/265 | NA | NA | 180/2185 | NA | NA | ≥4 | Incidentcases | Dynamic population | Matched on time | NA | RR | Age, sex, domicile |
| Elena/2013/Finland, USA, Europe and China [35] | 37–94 | Both (47.8) | 141/1339 | NA | NA | 112/1495 | NA | NA | ≥2 | Incidentcases | Dynamic population | Matched on time | NA | RR | Age, sex, race, education, smoking, alcohol, BMI, PC family history |
| Henry/2013/USA [32] | ≥30 | Female | 53/237 | 45/237 | 29/237 | 268/2629 | 218/2629 | 153/2629 | ≥2 | Incident cases | Closed population | Concurrently | Analysis matched on time | RR | Age, education, smoking, pack-years, BMI |
| Eijgenraam/2013/Netherlands [36] | 55–69 | Both (48.2) | 23/421 | 23/421 | 10/421 | 127/3835 | NA | NA | ≥5 | Incident cases | Closed cohort | Beginning of follow-up | Censoring unrelated to exposure | RR | Age, gender, smoking, BMI, education, alcohol, PC family history |
a. Assumptions were the characteristics of each study, used to evaluate the interpretation of reported effect measure. The evaluations were based on the case selection, population and control selection.
Table 3. Characteristics of 20 cohort studies.
| Author/year/region | Age | Source and no. of subjects | Gender (% male) | PC cases (DM/ non-DM), N | Person-years (Y)/Numbers (N) of DM/ non-DM | Follow-up (mean years) | Elected diabetes mellitus duration, years | Sampling scheme [70] | Adjusted factors | ||||
|---|---|---|---|---|---|---|---|---|---|---|---|---|---|
| Case selection | Population | Non-exposure selection | Assumptions a | Interpretation of reported effect measure | |||||||||
| Adami/1991/Sweden [37] | All ages | Population of Uppsala, 51,008 | Both (45.4) | 56/- | - | NA | ≥5 | Incident cases | Closed population | NA | NA | NA | Age, gender |
| Shibata/1994/USA [38] | All ages | Retired residents, 13,976 | Both (NA) | 4/38 | 2410/44787(Y) | NA | >4 | Incident cases | Closed population | Beginning of follow-up | Censoring unrelated to exposure | RR | Age, gender, smoking |
| Chow/1995/Sweden [39] | All ages | Population hospitalized for diabetes, 134,096 | Both (47.7) | 650/- | 901137/-(Y) | 6.8 (male)6.7 (female) | ≥2 | Incident cases | Closed population | Beginning of follow-up | Censoring unrelated to exposure | RR | Age, gender |
| Jee/2005/Korea (M) [40] | 30–95 | The Korean population, 829,770 | Male | 212/529 | - | 10 | ≥5 | Incident cases | Dynamic population | Matched on time | NA | RR | Age, age squared, smoking, alcohol |
| Jee/2005/Korea (F) [40] | 30–95 | Korean population,468,615 | Female | 60/324 | - | 10 | ≥5 | Incident cases | Dynamic population | Matched on time | NA | RR | Age, age squared, smoking, alcohol |
| Stolzenberg-Solomon/2002/Finland [41] | 50–69 | Male Finnish smokers, 29,048 | Male | 14/158172 | 10669/266896(Y) | 10.2 | ≥5 | Incident cases | Closed population | Beginning of follow-up | Censoring unrelated to exposure | RR | Age, smoking, physical activity, blood pressure, bronchial asthma history |
| Khan/2006/Japan (M) [42] | 40–79 | Japanese inhabitants, 23,378 | Male | 54/1753 | 12812.8/176754.5(Y) | NA | ≥2 | Incident cases | Dynamic population | Matched on time | NA | RR | Age, BMI, smoking, alcohol |
| Khan/2006/Japan (F) [42] | 40–79 | Japanese inhabitants, 33,503 | Female | 69/1554 | 11176.3/256864.9(Y) | NA | ≥2 | Incident cases | Dynamic population | Matched on time | NA | RR | Age, BMI, smoking, alcohol |
| Luo/2007/Japan (M) [43] | 40–69 | Japanese inhabitants, 47,499 | Male | 18/110 | 30273/ 461608(Y) | 11 | >4 | Incident cases | Dynamic population | Matched on time | NA | RR | Age, BMI, smoking, alcohol, physical activity, study area, history of cholelithiasis |
| Luo/2007/Japan (F) [43] | 40–69 | Japanese inhabitants, 52,171 | Female | 6/90 | 16254/ 555100(Y) | 11 | >4 | Incident cases | Dynamic population | Matched on time | NA | RR | Age, BMI, smoking, alcohol, physical activity, study area, history of cholelithiasis |
| Stevens/2009/England and Scotland [44] | 55.9 | Middle-aged women, 129,000 | Female | 49/1021 | - | 7.2 | >2 | Incident cases | Closed population | Beginning of follow-up | Censoring unrelated to exposure | RR | Age, region, socioeconomic status, smoking, BMI, height |
| Arnold/2009/USA (B) [45] | >30 | Population, 48,525 | Both (36.3) | 35/325 | - | 20 | >2 | Incident cases | Dynamic population | Matched on time | NA | RR | Age, sex, smoking, BMI, PC family history, cholecystectomy |
| Arnold/2009/USA (W) [45] | >30 | Population, 1,011,864 | Both (43.9) | 344/5539 | - | 20 | >2 | Incident cases | Dynamic population | Matched on time | NA | RR | Age, sex, smoking, BMI, PC family history, cholecystectomy |
| Chodick/2010/Israel (M) [46] | ≥21 | Population, 52,913 | Male | 25/78 | 8795/44118(N) | 8 | ≥3 | Prevalent cases | NA | NA | NA | Prevalence OR | Age, region, BMI, SES level, use of healthcare services a year prior to index date, history of cardiovascular diseases |
| Chodick/2010/Israel (F) [46] | ≥21 | Population, 47,682 | Female | 23/91 | 7926/39756(N) | 8 | ≥3 | Prevalent cases | NA | NA | NA | RR | Age, region, BMI, SES level, use of healthcare services a year prior to index date, history of cardiovascular diseases |
| Hemmminki/2010/Sweden [47] | >39 | Hospitalized type 2 diabetes patients, 125,126 | Both (NA) | 133/24324 | 125126/922796(N) | 15 | 8/9 | Incident cases | Dynamic population | Matched on time | NA | RR | Obesity |
| Wotton/2011/England (1) [48] | ≥30 | Hospitalized population in National Health Service (NHS) hospitals, 291462 | Both (54.6) | 24/23779 | 15898/275564(N) | NA | ≥5 | Incident cases | Closed population | Beginning of follow-up | Censoring unrelated to exposure | RR | Age in 5-year bands, gender, time period in single calendar years, district of residence |
| Wotton/2011/England (2) [48] | ≥30 | Hospitalized population in National Health Service (NHS) hospitals, 192,894 | Both (53.1) | 5/9770 | 7771/185123(N) | NA | ≥5 | Incident cases | Closed population | Beginning of follow-up | Censoring unrelated to exposure | RR | Age in 5-year bands, gender, time period in single calendar years, district of residence |
| Atchison/2011/USA [49] | 18–100 | Male veterans from 142 nationwide Veterans Affairs (VA) hospitals, 4,501,578 | Male | 1656/5983 | 594815/3906763(N) | 10.5 | ≥2 | Incident cases | Closed population | Beginning of follow-up | Censoring unrelated to exposure | RR | Age, time, latency, race, number of visits, diagnoses of alcohol-related conditions, obesity and chronic obstructive pulmonary disease |
| Yeh/2012/USA [50] | ≥30 | Adult population of Maryland, 18,280 | Both (42.7) | 6/63 | 599/17681(N) | NA | ≥2 | Incident cases | Closed population | Beginning of follow-up | Censoring unrelated to exposure | RR | Age, the square of age, gender, BMI, smoking, education, hypertension treatment, and high cholesterol treatment |
| Luo/2013/USA [51] | 50–79 | Postmenopausal women, 161,808 | Female | 19/378 | 27670/1497335(Y) | 10.3 | ≥10 | Incident cases | Closed population | Beginning of follow-up | Censoring unrelated to exposure | RR | Age, ethnicity, education, smoking, BMI physical activity, alcohol, energy intake, percent of daily dietary calories from fat, history of hormone therapy |
a. Assumptions were the characteristics of each study, used to evaluate the interpretation of reported effect measure. The evaluations were based on the case selection, population and control selection.
The details of quality evaluation for every study are shown in Tables 4–6. The included studies had NOS scores of 4–8.
Table 4. Quality of included case-control studies (Newcastle-Ottawa Scale, NOS).
| Study | Selection | Comparability | Exposure | Final score | ||||||
|---|---|---|---|---|---|---|---|---|---|---|
| Case definition adequate | Representativeness of the cases | Selection of controls | Definition of controls | Main factor | Additional factor | Ascertainment of exposure | Same method of ascertainment for cases and controls | Non-response rate | ||
| Cuzick[16] | * | * | 0 | * | * | * | 0 | * | 0 | 6/9 |
| Farrow[17] | * | * | * | 0 | * | * | 0 | * | * | 7/9 |
| Jain[18] | * | * | * | 0 | * | * | 0 | * | 0 | 6/9 |
| Bueno de Mesquita[19] | * | * | * | 0 | * | * | 0 | * | 0 | 6/9 |
| Gullo[20] | * | * | 0 | * | * | * | * | * | 0 | 7/9 |
| Lee[21] | * | * | * | * | * | * | 0 | * | 0 | 7/9 |
| Frye[22] | * | * | 0 | * | 0 | 0 | * | * | 0 | 5/9 |
| Bonelli[23] | * | * | 0 | * | * | * | * | * | 0 | 7/9 |
| Lo[24] | * | * | 0 | * | * | * | * | * | 0 | 7/9 |
| Anderson[25] | * | * | * | * | 0 | 0 | 0 | * | 0 | 5/9 |
| Kuang[26] | * | * | 0 | * | * | * | * | * | 0 | 7/9 |
| Maisonneuve[27] | * | * | * | 0 | 0 | 0 | 0 | * | 0 | 4/9 |
| Li[28] | * | * | * | * | * | * | 0 | * | * | 8/9 |
| Lipworth[29] | * | * | 0 | * | 0 | 0 | 0 | * | * | 5/9 |
| Ben[30] | * | * | 0 | * | * | * | * | * | 0 | 7/9 |
| Bosetti[31] | * | * | 0 | * | * | * | 0 | * | 0 | 6/9 |
| Henry[32] | * | * | * | 0 | * | * | 0 | * | 0 | 6/9 |
Table 6. Quality of included cohort studies (Newcastle-Ottawa Scale, NOS).
| Study | Selection | Comparability | Outcome | Final score | ||||||
|---|---|---|---|---|---|---|---|---|---|---|
| Representativeness of exposure | Selection of the non-exposed | Ascertainment of exposure | Outcome not present at start | Main factor | Additional factor | Assessment a | Follow-up length | Adequacy of follow-up | ||
| Adami[37] | * | * | * | * | * | * | * | * | 0 | 8/9 |
| Shibata[38] | * | * | 0 | * | * | * | * | * | 0 | 7/9 |
| Chow[39] | * | * | 0 | * | * | * | * | * | 0 | 7/9 |
| Jee[40] | * | * | * | * | * | * | * | * | 0 | 8/9 |
| Stolzenberg-Solomon[41] | 0 | * | 0 | * | * | * | * | * | 0 | 6/9 |
| Khan[42] | * | * | 0 | * | * | * | * | * | 0 | 8/9 |
| Luo[43] | * | * | 0 | * | * | * | * | * | * | 8/9 |
| Stevens[44] | 0 | * | 0 | * | * | * | * | * | 0 | 7/9 |
| Arnold[45] | * | * | 0 | * | * | * | * | * | * | 8/9 |
| Chodick[46] | * | * | * | * | * | * | * | * | 0 | 8/9 |
| Hemmminki[47] | * | * | * | * | * | 0 | * | * | 0 | 7/9 |
| Wotton[48] | * | * | * | * | * | * | * | * | 0 | 8/9 |
| Atchison[49] | 0 | * | * | * | * | * | * | * | 0 | 7/9 |
| Yeh[50] | * | * | 0 | * | * | * | * | * | 0 | 7/9 |
| Luo[51] | 0 | * | 0 | * | * | * | * | * | * | 7/9 |
a The outcome assessors were not blinded to the interventions implemented in any of the studies.
Table 5. Quality of included nested case-control studies (Newcastle-Ottawa Scale, NOS).
| Study | Selection | Comparability | Exposure | Final score | ||||||
|---|---|---|---|---|---|---|---|---|---|---|
| Case definition adequate | Representativeness of the cases | Selection of controls | Definition of controls | Main factor | Additional factor | Ascertainment of exposure | Same method of ascertainment for cases and controls | Non-response rate | ||
| Hiatt[33] | * | * | * | * | 0 | 0 | 0 | * | 0 | 5/9 |
| Attner[34] | * | * | * | * | * | * | * | * | 0 | 8/9 |
| Elena[35] | * | * | * | * | * | * | * | * | 0 | 8/9 |
| Henry[32] | * | * | * | * | * | * | 0 | * | 0 | 7/9 |
| Eijgenraam[36] | * | * | * | 0 | * | * | * | * | 0 | 7/9 |
Meta-analysis results
Pooled RRs for the population with a diabetes duration ≥2 years were calculated using a random-effect model, and the results are shown in Fig 2. For PC patients with long-term diabetes compared with controls without diabetes, we obtained a statistically significant RR of 1.64 (95% CI, 1.52–1.78). We detected heterogeneity among the 44 studies (P<0.001, I2 = 52.1%).
Fig 2. Forest plots of the association between a diabetes duration ≥2 years and the risk of PC.

For the population with a diabetes duration ≥5 years, a significant association among the studies was shown by an average RR of 1.58 (95% CI, 1.42–1.75), which was calculated using a random-effect model (Fig 3). We also detected heterogeneity among the 26 studies (P<0.001, I2 = 57.8%).
Fig 3. Forest plots of the association between a diabetes duration ≥5 years and the risk of PC.

Additionally, for the population with a diabetes duration ≥10 years, the average RR (95% CI) was 1.50 (1.28–1.75), which was calculated using a random-effect model (Fig 4). Significant heterogeneity was detected among the 14 studies (P = 0.015, I2 = 50.9%).
Fig 4. Forest plots of the association between a diabetes duration ≥10 years and the risk of PC.

The results from the pooled studies showed that long-term DM was associated with a 1.5- to 1.7-fold increased risk of PC. However, compared with the DM duration category of ≥2 years, the RR of the category of ≥5 years was decreased; with a DM duration of ≥10 years, the RR was further decreased.
Sensitivity analysis and subgroup
Due to significant heterogeneity identified among the studies of each DM duration group, sensitivity analysis was performed. The heterogeneity and effect size were calculated by omitting one study in each round. The results suggested that no single study influenced the overall pooled estimates in each group. The results of the sensitivity analysis are presented in Figs 5–7.
Fig 5. Sensitivity analyses of the studies of patients with diabetes durations ≥2 years.

Fig 7. Sensitivity analyses of the studies of patients with diabetes durations ≥10 years.

Fig 6. Sensitivity analyses of the studies of patients with diabetes durations ≥5 years.

Next, we conducted subgroup meta-analyses by gender, study design and region (Table 7). In a total of 7 subgroups among the 3 DM durations, consistent results were found in all subgroups with the pooled effect estimates of the overall analysis; however, inconsistent, nonsignificant outcomes were found when analysis was restricted to 3 nested case-control studies of DM duration ≥10 years. Because I2 was not powered to detect heterogeneity with so few included cases, only the P value was used to estimate the heterogeneity in this type of study. According to the I2 statistic and P value, significant heterogeneities had a less apparent tendency toward variation.
Table 7. Subgroup analysis of included studies.
| Criteria | ≥2 years | ≥5 years | ≥10 years | |||||||||||||
|---|---|---|---|---|---|---|---|---|---|---|---|---|---|---|---|---|
| No. of studies | Effect model | Heterogeneity (P / I2) | RR (95%CI) | No. of studies | Effect model | Heterogeneity (P / I2) | RR (95%CI) | No. of studies | Effect model | Heterogeneity (P / I2) | RR (95%CI) | |||||
| Gender | Male | 15 | Random | 0.003 / 56.9% | 1.63 (1.46–1.81) | 5 | Random | 0.017 / 67.0% | 1.53 (1.19–1.97) | 2 | Fixed | 0.803 / - | 1.33 (1.21–1.47) | |||
| Female | 16 | Random | <0.001 / 62.3% | 1.72 (1.48–2.01) | 5 | Fixed | 0.239 / 27.3% | 1.89 (1.54–2.32) | 3 | Fixed | 0.459 / - | 1.96 (1.47–2.63) | ||||
| Study design | Case-control study | 18 | Random | 0.004 / 52.9% | 1.75 (1.44–2.12) | 12 | Fixed | 0.130 / 32.5% | 1.49 (1.27–1.75) | 7 | Fixed | 0.403 / 3.0% | 1.40 (1.15–1.70) | |||
| Nested case-control study | 5 | Fixed | 0.679 / - | 1.88 (1.53–2.30) | 4 | Random | 0.091 / 53.7% | 1.74 (1.26–2.41) | 3 | Random | 0.019 / 74.9% | 1.69 (0.96–3.00) | ||||
| Cohort study | 21 | Random | 0.001 / 54.6% | 1.56 (1.43–1.71) | 10 | Random | <0.001 / 74.6% | 1.56 (1.36–1.79) | 4 | Random | 0.008 / 74.6% | 1.48 (1.14–1.93) | ||||
| Region | Eastern countries | 11 | Fixed | 0.183 / 27.5% | 1.75 (1.56–1.97) | 1 | - | - | - | 1 | - | - | - | |||
| Western countries | 32 | Random | <0.001 / 54.8% | 1.61 (1.47–1.76) | 22 | Random | 0.001 / 56.3% | 1.56 (1.39–1.75) | 12 | Random | 0.023 / 50.5% | 1.47 (1.26–1.71) | ||||
Publication bias
Finally, to assess publication bias of the included studies, we created Begg’s funnel plot. In Begg’s test. Z was 0.13 (P = 0.895) for a DM duration of ≥2 years, 0.40 (P = 0.692) for a DM duration of ≥5 years and 0.33 (P = 0.743) for a DM duration of ≥10 years. We found a low probability of publication bias and small study effects, indicated by P values >0.05 (Figs 8–10).
Fig 8. Funnel plot for publication bias of the studies of patients with diabetes durations ≥2 years.

Fig 10. Funnel plot for publication bias of the studies of patients with diabetes durations ≥10 years.

Fig 9. Funnel plot for publication bias of the studies of patients with diabetes durations ≥5 years.

Discussion
Our research included 44 studies, which were conducted in different parts of the world and included different populations. This meta-analysis showed a significantly increased risk of PC in diabetes patients who had been diagnosed and followed up for more than 2 years. Using pooled data from the included studies, we found that long-term DM was associated with a 1.5- to 1.7-fold increased risk of PC. The results from the pooled cohort studies and nested case-control studies were consistent with those from the pooled case-control studies. In the subgroup analysis by gender, the risk estimation changed slightly, and gender differences had less influence on the strength of the positive association between diabetes and the risk of PC.
Our findings did not reveal an increased risk of PC with an increasing diabetes duration; in contrast, the RRs were decreased at durations of ≥5 and ≥10 years. The PC risk was negatively correlated with increasing disease duration in the long-term DM category.
Epidemiological studies have reported a bidirectional relationship between diabetes and PC. In previously published systematic reviews [10–12], the studies in which the populations were either diagnosed with new-onset or long-term diabetes were directly pooled. Those results indicated an overall 1.5-fold increased risk of PC among diabetic patients, with a slightly stronger association between diabetes and PC than that observed in our analysis. This finding might suggest that the strength of the association between long-term diabetes and PC development is equal to or slightly weaker than that between new-onset diabetes and PC development.
The mechanism by which diabetes increases the risk of PC development remains controversial. However, this mechanism is likely related to increased insulin-like growth factor 1 (IGF-1) levels, hyperglycemia, insulin resistance and compensatory hyperinsulinemia.
Under physiological conditions, IGF-1 peptides are synthesized mainly by the liver and act as major stimulators of tissue and cellular growth through the induction of proliferation and the inhibition of apoptosis in target tissues [52]. IGF-1 shares 50% amino acid sequence homology with insulin, and as a result, it elicits nearly the same hypoglycemic response [53]. The observed effect of pituitary growth hormone (GH) has been to counteract the action of insulin, leading to insulin resistance in insulin target tissues [54]. The IGF-1-GH axis is believed to play a prominent role in glucose tolerance and type 2 DM.
In particular, studies have shown that IGF receptors are frequently overexpressed in cancer [55], with corresponding changes in the circulating levels of IGF peptides [56–57]. The IGF system and insulin signaling pathway simultaneously play important roles in hyperinsulinemia, insulin resistance and tumor pathogenesis, which are more likely to be the potential mechanisms in a variety of human cancers.
In a Korean study that evaluated a 10-year follow-up period, linear trends in mortality with increasing fasting serum glucose levels were observed for PC. Participants with fasting serum glucose levels of 110 to 125 mg/dL had a significantly elevated risk of PC mortality compared with those with in the reference category (serum glucose levels of 90 mg/dL) [40]. Hyperinsulinemia has been cited as a possible risk factor for PC with the emergence of hyperglycemia. In their research, Li et al. reported that hyperglycemia could lead to oxidative stress, which is caused by an imbalance in reactive oxygen species (ROS) antioxidants. Most patients with PC suffer from diabetes or hyperglycemia, and high glucose can cause ROS production, which can in turn increase the invasiveness of cancer cells [58].
A hyperglycemic state has various indicators; of these indicators, hemoglobinA1c (HbA1c) reflects long-term glycemic control and is a more stable measurement than fasting plasma glucose levels. Cheon et al. undertook research that that a high HbA1c level might be associated with worse survival in patients with advanced PC undergoing antidiabetic treatment [59].
Adiponectin is a hormone that is primarily secreted by adipose tissue; it is inversely correlated with plasma insulin and is reduced in individuals with insulin-resistant conditions such as obesity and type 2 DM [60]. Many case-control and prospective studies have shown that serum adiponectin concentrations are decreased in breast cancer, hepatocellular carcinoma (HCC) and colorectal cancer [61–63]. Bao et al. measured total adiponectin and found that the effects of total plasma adiponectin on PC development might differ from those of high- or low-molecular-weight adiponectin. Interpretation of Bao et al.’s data could warrant the consideration that high/low-molecular-weight adiponectin levels might be more closely associated with the PC risk than total adiponectin [64].
Moreover, large numbers of diabetic patients require life-long drug therapy, which could influence the development of cancer. Insulin, metformin and thiazolidinediones (TZDs) are among the major diabetic therapies shown to improve the control of hyperglycemia through effects on molecular targets such as the insulin receptor and insulin-like growth factor pathways, adenosine monophosphate-activated kinase and peroxisome proliferator-activated receptor γ (PPARγ) [65]. According to recent observational studies, the use of metformin was associated with a reduced risk of PC in patients with diabetes [66]. In addition, TZD demonstrated potent inhibitory effects on the growth of PC cells via the PPARγ-dependent induction of ductal differentiation [67], and the use of insulin glargine was not associated with an increased risk of all cancers or site-specific cancers in Scotland over a 4-year time period [68]. No convincing evidence supports a carcinogenic role of any insulin derivative currently used in therapy. However, the potential contribution of insulin therapy to the hypothetical mitogenic effects of endogenous insulin cannot be fully excluded [69]
Nevertheless, further investigation into the influence of DM drug therapy on cancer development is warranted. Therapeutic strategies should be generally reevaluated, and future research should address these important questions.
This study had several limitations that should be recognized. First, the potential for information and selection biases could not be completely excluded because all of the included studies were observational. Second, some of the included studies did not distinguish between type 1 and type 2 diabetes (although most of the studies included elderly populations and excluded type 1 diabetes); therefore, we could not distinguish the relationships among different types of diabetes, insulin resistance and PC development. Third, the association between long-term DM and the risk of PC is not solely due to DM directly; a theory that DM and PC generation and development share common risk factors has been proposed. More research focusing on these two viewpoints is required. Fourth, none of the included studies considered the role of anti-diabetic drugs in PC development. Finally, in a few of the included studies, the presence of diabetes was self-reported rather than identified from secure records, which could have affected the ascertainment of exposure and distorted the relationships.
In conclusion, our analysis demonstrated that diabetes lasting more than 2 years was associated with an increased risk of PC, after excluding the relationship between PC and new-onset diabetes. Therefore, regular examinations of patients with long-term diabetes could be meaningful for the prediction, early diagnosis and treatment of PC. However, further investigations into the mechanism by which long-term diabetes promotes PC are required.
Data Availability
All relevant data are within the paper.
Funding Statement
This work was supported by a grant from the Science and Technology Department of Liaoning Province (2013225021). The funders had no role in study design, data collection and analysis, decision to publish, or preparation of the manuscript.
References
- 1. Yisahak SF, Beagley J, Hambleton IR, Narayan KM (2014). Diabetes in North America and the Caribbean: An update. Diabetes Res Clin Pract 103:223–230. 10.1016/j.diabres.2013.11.009 [DOI] [PubMed] [Google Scholar]
- 2. Aschner P, Aguilar-Salinas C, Aguirre L, Franco L, Gagliardino JJ, de Lapertosa SG, et al. (2014). Diabetes in South and Central America: An update. Diabetes Res Clin Pract, 103:238–243. 10.1016/j.diabres.2013.11.010 [DOI] [PubMed] [Google Scholar]
- 3. Tamayo T, Rosenbauer J, Wild SH, Spijkerman AM, Baan C, Forouhi NG, et al. (2014). Diabetes in Europe: An update. Diabetes Res Clin Pract 103:206–217. 10.1016/j.diabres.2013.11.007 [DOI] [PubMed] [Google Scholar]
- 4. Xu Y, Wang L, He J, Bi Y, Li M, Wang T, et al. (2013) Prevalence and control of diabetes in Chinese adults. JAMA 310:948–959 10.1001/jama.2013.168118 [DOI] [PubMed] [Google Scholar]
- 5. Giovannucci E, Harlan DM, Archer MC, Bergenstal RM, Gapstur SM, Habel LA, et al. (2010) Diabetes and cancer: a consensus report. Diabetes Care 33:1674−1685 10.2337/dc10-0666 [DOI] [PMC free article] [PubMed] [Google Scholar]
- 6. Griffiths RI, Danese MD, Gleeson ML, Valderas JM (2012) Epidemiology and outcomes of previously undiagnosed diabetes in older women with breast cancer: an observational cohort study based on SEER-Medicare. Biomedcentral Cancer 12:613–626 [DOI] [PMC free article] [PubMed] [Google Scholar]
- 7. Toriola AT, Stolzenberg-Solomon R, Dalidowitz L, Linehan D, Colditz G (2014) Diabetes and pancreatic cancer survival: a prospective cohort-based study. Br J Cancer 111:181–185 10.1038/bjc.2014.224 [DOI] [PMC free article] [PubMed] [Google Scholar]
- 8. Gudjonsson B (2009) Pancreatic cancer: survival, errors and evidence. Eur J Gastroenterol Hepatol 21:1379–1382 10.1097/MEG.0b013e328323aab7 [DOI] [PubMed] [Google Scholar]
- 9. Asiyanbola B, Gleisner A, Herman JM, Choti MA, Wolfgang CL, Swartz M, et al. (2009) Determining pattern of recurrence following pancreaticoduodenectomy and adjuvant 5-flurouracil-based chemoradiation therapy: effect of number of metastatic lymph nodes and lymph node ratio. J Gastrointest Surg 13:752–759 10.1007/s11605-008-0762-x [DOI] [PubMed] [Google Scholar]
- 10. Ben Q, Xu M, Ning X, Liu J, Hong S, Huang W, et al. (2011) Diabetes mellitus and risk of pancreatic cancer: A meta-analysis of cohort studies. Eur J Cancer 47:1928–1937 10.1016/j.ejca.2011.03.003 [DOI] [PubMed] [Google Scholar]
- 11. Huxley R, Ansary-Moghaddam A, Berrington de Gonzalez A, Barzi F, Woodward M (2005) Type-II diabetes and pancreatic cancer: a meta-analysis of 36 studies. Br J Cancer 92:2076–2083 [DOI] [PMC free article] [PubMed] [Google Scholar]
- 12. Batabyal P, Vander Hoorn S, Christophi C, Nikfarjam M (2014) Association of diabetes mellitus and pancreatic adenocarcinoma: a meta-analysis of 88 studies. Ann Surg Oncol 21:2453–2462 10.1245/s10434-014-3625-6 [DOI] [PubMed] [Google Scholar]
- 13.Wells G, Shea B, O’connell D, Peterson J, Welch V, Losos M, et al (2000) The Newcastle-Ottawa Scale (NOS) for assessing the quality of nonrandomized studies in meta-analyses. In 3rd Symposium on Systematic Reviews: Beyond the Basics; July 3–5, Oxford, UK. Available: http://www.ohri.ca/programs/clinical_epidemiology/oxford.htm
- 14. Alderson P, Creen S, Higgins JPT, editor (2004) Cochrane reviewer’s handbook4. 2.2 (update MSTVH2004) Cochrane Library; (1):102–153 [Google Scholar]
- 15. Egger M, Smith GD, Schneider M, Minder C (1997) Bias in meta-analysis detected by a simple, graphical test. Bmj 315:629–634 [DOI] [PMC free article] [PubMed] [Google Scholar]
- 16. Cuzick J, Babiker AG (1989) Pancreatic cancer, alcohol, diabetes mellitus and gall-bladder disease. Int. J. Cancer 43:415–421 [DOI] [PubMed] [Google Scholar]
- 17. Farrow DC, Davis S (1990) Risk of pancreatic cancer in relation to medical history and the use of tobacco, alcohol and coffee. Int. J. Cancer 45:816–820 [DOI] [PubMed] [Google Scholar]
- 18. Jain M, Howe GR, Lours PS, Miller AB (1991) Coffee and alcohol as determinants of risk of pancreas cancer: a case-control study from Toronto. Int. J. Cancer, 47:384–389 [DOI] [PubMed] [Google Scholar]
- 19. Bueno De Mesquita HB, Maisonneuve P, Moerman CJ, Walker AM (1992) Aspects of medical history and exocrine carcinoma of the Netherlands pancreas: a population-based case-control study in the Netherlands. Int. J. Cancer 52:17–23 [DOI] [PubMed] [Google Scholar]
- 20. Gullo L, Pezzilli R, Morselli-Labate AM, Italian Pancreatic Cancer Study Group (1994) Diabetes and the risk of pancreatic cancer. The new England journal of medicine 331:81–84 [DOI] [PubMed] [Google Scholar]
- 21. Lee CT, Chang FY, Lee SD (1996) Risk factors for pancreatic cancer in Orientals. Journal of Gastroenterology and Hepatology 11:491–495 [DOI] [PubMed] [Google Scholar]
- 22. Frye JNR, Inder WJ, Dobbs BR, Frizelle FA (2000) Pancreatic cancer and diabetes: is there a relationship? A case-controlled study. Aust. N.Z. J. Surg 70:722–724 [DOI] [PubMed] [Google Scholar]
- 23. Bonelli L, Aste H, Bovo P, Cavallini G, Felder M, Gusmaroli R, et al. (2003) Exocrine pancreatic cancer, cigarette smoking, and diabetes mellitus: a case-control study in northern Italy. Pancreas 27:143–149 [DOI] [PubMed] [Google Scholar]
- 24. Lo AC, Soliman AS, El-Ghawalby N, Abdel-Wahab M, Fathy O, Khaled HM, et al. (2007) Lifestyle, occupational, and reproductive factors in relation to pancreatic cancer risk. Pancreas 35:120–129 [DOI] [PubMed] [Google Scholar]
- 25. Anderson LN, Cotterchio M, Gallinger S (2009) Lifestyle, dietary, and medical history factors associated with pancreatic cancer risk in Ontario, Canada. Cancer Causes Control 20:825–834 10.1007/s10552-009-9303-5 [DOI] [PMC free article] [PubMed] [Google Scholar]
- 26. Kuang TT, Jin DY, Wang DS, Xu XF, Ni XL, Wu WC, et al. (2009) Clinical epidemiological analysis of the relationship between pancreatic cancer and diabetes mellitus: data from a single institution in China. J Dig Dis 10:26–29. 10.1111/j.1751-2980.2008.00359.x [DOI] [PubMed] [Google Scholar]
- 27. Maisonneuve P, Lowenfels AB, Bueno-de-Mesquita HB, Ghadirian P, Baghurst PA, Zatonski WA, et al. (2010) Past medical history and pancreatic cancer risk: Results from a multicenter case-control study. Ann Epidemiol 20:92–98 10.1016/j.annepidem.2009.11.010 [DOI] [PubMed] [Google Scholar]
- 28. Li D, Tang H, Hassan MM, Holly EA, Bracci PM, Silverman DT (2011) Diabetes and risk of pancreatic cancer: a pooled analysis of three large case-control studies. Cancer Causes Control 22:189–197 10.1007/s10552-010-9686-3 [DOI] [PMC free article] [PubMed] [Google Scholar]
- 29. Lipworth L, Zucchetto A, Bosetti C, Franceschi S, Talamini R, Serraino D, et al. (2011) Diabetes mellitus, other medical conditions and pancreatic cancer: a case-control study. Diabetes Metab Res Rev 27:255–261 10.1002/dmrr.1162 [DOI] [PubMed] [Google Scholar]
- 30. Ben Q, Cai Q, Li Z, Yuan Y, Ning X, Deng S, et al. (2011) The relationship between new-onset diabetes mellitus and pancreatic cancer risk: a case-control study. Eur J Cancer 47:248–254 10.1016/j.ejca.2010.07.010 [DOI] [PubMed] [Google Scholar]
- 31. Bosetti C, Rosato V, Polesel J, Levi F, Talamini R, Montella M, et al. (2012) Diabetes mellitus and cancer risk in a network of case-control studies. Nutrition and Cancer 64:643–651 10.1080/01635581.2012.676141 [DOI] [PubMed] [Google Scholar]
- 32. Henry SA, Prizment AE, Anderson KE (2013) Duration of diabetes and pancreatic cancer in a case-control study in the Midwest and the Iowa Women’s Health Study (IWHS) cohort. Journal of the Pancreas 14:243–249 10.6092/1590-8577/1317 [DOI] [PMC free article] [PubMed] [Google Scholar]
- 33. Hiatt RA, Klatsky AL, Armstrong MA (1988) Pancreatic cancer, blood glucose and beverage consumption. Int. J. Cancer 41:794–797 [DOI] [PubMed] [Google Scholar]
- 34. Attner B, Landin-Olsson M, Lithman T, Noreen D, Olsson H (2012) Cancer among patients with diabetes, obesity and abnormal blood lipids: a population-based register study in Sweden. Cancer Causes Control 23:769–777 10.1007/s10552-012-9946-5 [DOI] [PubMed] [Google Scholar]
- 35. Elena JW, Steplowski E, Yu K, Hartge P, Tobias GS, Brotzman MJ, et al. (2013) Diabetes and risk of pancreatic cancer: a pooled analysis from the pancreatic cancer cohort consortium. Cancer Causes Control 24:13–25 10.1007/s10552-012-0078-8 [DOI] [PMC free article] [PubMed] [Google Scholar]
- 36. Eijgenraam P, Heinen MM, Verhage BA, Keulemans YC, Schouten LJ, van den Brandt PA (2013) Diabetes type II, other medical conditions and pancreatic cancer risk: a prospective study in the Netherlands. Br J Cancer 109:2924–2932 10.1038/bjc.2013.629 [DOI] [PMC free article] [PubMed] [Google Scholar]
- 37. Adami HO, McLaughlin J, Ekbom A, Berne C, Silverman D, Hacker D, et al. (1991) Cancer risk in patients diabetes mellitus. Cancer Causes and Control 2:307–314 [DOI] [PubMed] [Google Scholar]
- 38. Shibata A, Mack TM, Paganini-Hill A, Ross RK, Henderson BE (1994) A prospective study of pancreatic cancer in the elderly. Int. J. Cancer 58:46–49 [DOI] [PubMed] [Google Scholar]
- 39. Chow WH, Gridley G, OlofNyren, Linet MS, Ekbom A, Fraumeni JF Jr, et al. (1995) Risk of pancreatic cancer following diabetes mellitus: a nationwide cohort study in Sweden. Journal of the National Cancer Institute 87:930–931 [DOI] [PubMed] [Google Scholar]
- 40. Jee SH, Ohrr H, Sull JW, Yun JE, Ji M, Samet JM (2005) Fasting serum glucose level and cancer risk in Korean men and women. JAMA 293:194–202 [DOI] [PubMed] [Google Scholar]
- 41. Stolzenberg-Solomon RZ, Pietinen P, Taylor PR, Virtamo J, Albanes D (2002) A prospective study of medical conditions, anthropometry, physical activity, and pancreatic cancer in male smokers (Finland). Cancer Causes and Control 13:417–426 [DOI] [PubMed] [Google Scholar]
- 42. Khan MMH, Mori M, Fujino Y, Shibata A, Sakauchi F, Washio M, et al. (2006) Site-specific cancer risk due to diabetes mellitus history: evidence from the Japan Collaborative Cohort (JACC) study. Asian Pacific J Cancer Prev 7:253–259 [PubMed] [Google Scholar]
- 43. Luo J, Iwasaki M, Inoue M, Sasazuki S, Otani T, Ye W, et al. (2007) Body mass index, physical activity and the risk of pancreatic cancer in relation to smoking status and history of diabetes: a large-scale population-based cohort study in Japan—the JPHC study. Cancer Causes Control 18:603–612 [DOI] [PubMed] [Google Scholar]
- 44. Stevens RJ, Roddam AW, Spencer EA, Pirie KL, Reeves GK, Green J, et al. (2009) Factors associated with incident and fatal pancreatic cancer in a cohort of middle-aged women. Int J Cancer 124:2400–2405 10.1002/ijc.24196 [DOI] [PubMed] [Google Scholar]
- 45. Arnold LD, Patel AV, Yan Y, Jacobs EJ, Thun MJ, Calle EE, et al. (2009) Are racial disparities in pancreatic cancer explained by smoking and overweight/obesity? Cancer Epidemiol Biomarkers Prev 18:2397–2405 10.1158/1055-9965.EPI-09-0080 [DOI] [PMC free article] [PubMed] [Google Scholar]
- 46. Chodick G, Heymann AD, Rosenmann L, Green MS, Flash S, Porath A, et al. (2010) Diabetes and risk of incident cancer: a large population-based cohort study in Israel. Cancer Causes Control, 21:879–887 10.1007/s10552-010-9515-8 [DOI] [PubMed] [Google Scholar]
- 47. Hemminki K, Li X, Sundquist J, Sundquist K (2010) Risk of cancer following hospitalization for type 2 diabetes. Oncologist 15:548–555 10.1634/theoncologist.2009-0300 [DOI] [PMC free article] [PubMed] [Google Scholar]
- 48. Wotton CJ, Yeates DG, Goldacre MJ (2011) Cancer in patients admitted to hospital with diabetes mellitus aged 30 years and over: record linkage studies. Diabetologia 54:527–534 10.1007/s00125-010-1987-2 [DOI] [PubMed] [Google Scholar]
- 49. Atchison EA, Gridley G, Carreon JD, Leitzmann MF, McGlynn KA (2011) Risk of cancer in a large cohort of U.S. veterans with diabetes. Int J Cancer 128:635–643 10.1002/ijc.25362 [DOI] [PMC free article] [PubMed] [Google Scholar]
- 50. Yeh HC, Platz EA, Wang NY, Visvanathan K, Helzlsouer KJ, Brancati FL (2012) A prospective study of the associations between treated diabetes and cancer outcomes. Diabetes Care 35:113–118 10.2337/dc11-0255 [DOI] [PMC free article] [PubMed] [Google Scholar]
- 51. Luo J, Chlebowski R, Liu S, McGlynn KA, Parekh N, White DL, (2013) Diabetes mellitus as a risk factor for gastrointestinal cancers among postmenopausal women. Cancer Causes Control 24:577–585 10.1007/s10552-012-9996-8 [DOI] [PMC free article] [PubMed] [Google Scholar]
- 52. Pollak M (2008) Insulin, insulin-like growth factors and neoplasia. Best Practice & Research Clinical Endocrinology & Metabolism 22:625–638 [DOI] [PubMed] [Google Scholar]
- 53. Boulware SD, Tamborlane WV, Rennert NJ, Gesundheit N, Sherwin RS (1994) Comparison of the metabolic effects of recombinant human insulin-like growth factor-I and insulin.Dose–response relationships in healthy young and middle-aged adults. J Clin Invest 93:1131–9. [DOI] [PMC free article] [PubMed] [Google Scholar]
- 54. Coschigano KT, Clemmons D, Bellush LL, Kopchick JJ (2000) Assessment of growth parameters and life span of GHR/BP gene-disrupted mice. Endocrinology 141:2608–13.) [DOI] [PubMed] [Google Scholar]
- 55. Baserga R, Peruzzi F, Reiss K (2003) The IGF-1 receptor in cancer biology. International journal of cancer 107:873–877 [DOI] [PubMed] [Google Scholar]
- 56. Ollberding NJ, Cheng I, Wilkens LR, Henderson BE, Pollak MN, Kolonel LN, et al. (2012) Genetic variants, prediagnostic circulating levels of insulin-like growth factors, insulin, and glucose and the risk of colorectal cancer: the Multiethnic Cohort study. Cancer Epidemiology Biomarkers & Prevention 21:810–820 [DOI] [PMC free article] [PubMed] [Google Scholar]
- 57. Giovannucci E, Pollak MN, Platz EA, Willett WC, Stampfer MJ, Majeed N, et al. (2000) A prospective study of plasma insulin-like growth factor-1 and binding protein-3 and risk of colorectal neoplasia in women. Cancer Epidemiology Biomarkers & Prevention 9:345–349 [PubMed] [Google Scholar]
- 58. Li W, Ma QY, Li JH, Guo K, Liu H, Han L, et al. (2011) Hyperglycemia enhances the invasive and migratory activity of pancreatic cancer cells via hydrogen peroxide. Oncology Reports 25: 1279–1287 10.3892/or.2011.1150 [DOI] [PubMed] [Google Scholar]
- 59. Cheon YK, Koo JK, Lee YS Lee TY, Shim CS (2014) Elevated Hemoglobin A1c Levels Are Associated with Worse Survival in Advanced Pancreatic Cancer Patients with Diabetes. Gut and Liver 8:205–214 10.5009/gnl.2014.8.2.205 [DOI] [PMC free article] [PubMed] [Google Scholar]
- 60. Weyer C, Funahashi T, Tanaka S, Hotta K, Matsuzawa Y, Pratley RE, et al. (2001) Hypoadiponectinemia in obesity and type 2 diabetes: close association with insulin resistance and hyperinsulinemia. J Clin Endocrinol Metab 86:1930–1935. [DOI] [PubMed] [Google Scholar]
- 61. Barb D, Pazaitou-Panayiotou K, Mantzoros CS. (2006) Adiponectin: a link between obesity and cancer. Expert Opin Investig Drugs 15:917–31. [DOI] [PubMed] [Google Scholar]
- 62. Arano T, Nakagawa H, Tateishi R, Ikeda H, Uchino K, Enooku K, et al. (2011) Serum level of adiponectin and the risk of liver cancer development in chronic hepatitis C patients. International Journal of Cancer 129:2226–2235. [DOI] [PubMed] [Google Scholar]
- 63. Otake S (2010). Decreased levels of plasma adiponectin associated with increased risk of colorectal cancer. World Journal of Gastroenterology 16:1252 [DOI] [PMC free article] [PubMed] [Google Scholar]
- 64. Bao Y, Giovannucci EL, Kraft P, Qian ZR, Wu C, Ogino S, et al. (2013) Inflammatory plasma markers and pancreatic cancer risk: a prospective study of 5 U.S. cohorts. Cancer Epidemiol Biomarkers Prev 22:855–861. 10.1158/1055-9965.EPI-12-1458 [DOI] [PMC free article] [PubMed] [Google Scholar]
- 65. Li C and Kong D (2014) Cancer risks from diabetes therapies: Evaluating the evidence. Pharmacol Ther 14:101–106 [DOI] [PubMed] [Google Scholar]
- 66. Wang Z, Lai ST, Xie L, Zhao JD, Ma NY, Zhu J, et al. (2014) Metformin is associated with reduced risk of pancreatic cancer in patients with type 2 diabetes mellitus: A systematic review and meta-analysis. Diabetes Res Clin Pract 14:190–199 [DOI] [PubMed] [Google Scholar]
- 67. Ceni E, Mello T, Tarocchi M, Crabb DW, Caldini A, Invernizzi P, et al. (2005) Antidiabetic thiazolidinediones induce ductal differentiation but not apoptosis in pancreatic cancer cells. World Journal of Gastroenterology 11:1122–1130 [DOI] [PMC free article] [PubMed] [Google Scholar]
- 68. Colhoun HM, Group SE (2009) Use of insulin glargine and cancer incidence in Scotland: a study from the Scottish Diabetes Research Network Epidemiology Group. Diabetologia 52:1755–1765 10.1007/s00125-009-1453-1 [DOI] [PMC free article] [PubMed] [Google Scholar]
- 69. Chari ST (2014) Mechanism(s) of pancreatic cancer-induced diabetes. J Pancreas 15:528 [Google Scholar]
- 70. Knol MJ, Vandenbroucke JP, Scott P, Egger M (2008) What do case-control studies estimate? survey of methods and assumptions in published case-control research. Am J Epidemiol 168:1073–1081 10.1093/aje/kwn217 [DOI] [PubMed] [Google Scholar]
Associated Data
This section collects any data citations, data availability statements, or supplementary materials included in this article.
Data Availability Statement
All relevant data are within the paper.