

Abstract
Background and Purpose
Cerebral microinfarcts (CMI) are important contributors to vascular cognitive impairment. MRI diffusion-weighted imaging (DWI) hyperintensities have been suggested to represent acute CMI. We aim to describe a mathematical method for estimating total number of CMI based on the presence of incidental DWI lesions.
Methods
We reviewed MRI scans of subjects with cognitive decline, cognitively normal subjects and previously reported subjects with past intracerebral hemorrhage (ICH). Based on temporal and spatial characteristics of DWI lesions we estimated the annual rate of CMI needed to explain the observed rate of DWI lesion detection in each group. To confirm our estimates we performed extensive sampling for CMI in the brain of a deceased subject with past lobar ICH who found to have a DWI lesion during life.
Results
Clinically silent DWI lesions were present in 13 of 343 (3.8%) cognitively impaired, and 10 of 199 (5%) cognitively intact normal non-ICH patients, both lower than the incidence in the past ICH patients (23 of 178, 12.9%, p<0.0006). The predicted annual incidence of CMI ranges from 16 to 1566 for non-ICH and 50 to 5041 for ICH individuals. Histologic sampling revealed a total of 60 lesions in 32 sections. Based on previously reported methods, this density of CMI yields an estimated total brain burden MLE of 9321 CMIs (95% CI 7255–11990).
Conclusions
Detecting even a single DWI lesion suggests an annual incidence of hundreds of new CMI. The cumulative effects of these lesions may directly contribute to small-vessel-related vascular cognitive impairment
Background and Purpose
Cerebral microinfarcts (CMI), small ischemic lesions seen microscopically during pathologic examination of cerebral tissue, have been implicated as important contributors to vascular cognitive impairment 1. Estimating an individual’s total CMI burden would be an important step towards defining the impact of these lesions. This effort is hampered, however, by our inability to reliably detect CMI or CMI-related changes with conventional neuroimaging because of their microscopic size. Postmortem analysis of CMI is also limited by the practical impossibility of microscopically sectioning through the whole brain. To address this limitation, we recently reported a method for estimating total CMI burden from brain tissue sampled at autopsy 2.
An alternative approach applicable to living subjects is to estimate CMI burden from the presence of hyperintense lesions on MRI diffusion-weighted imaging (DWI). These DWI hyperintensities have been suggested to represent relatively large acute/subacute CMI 1 and remain detectable for approximately 1 to 2 weeks 3,4. DWI hyperintense lesions occur with increased incidence in patients with primary intracerebral hemorrhage (ICH) 5–11, suggesting that severe small vessel disease (SVD), causing ICH, might also give rise to silent CMI.
We now describe a simple mathematical method for estimating total number of CMI based on the presence of incidental DWI hyperintense lesions, using data on the incidence of these lesions in individuals with ICH 8, cognitive decline, or cognitively intact elderly controls. To test the plausibility of our estimates, we measured the number of CMI in brain tissue sections from a subject with a DWI lesion during life.
Methods
Study participants
To obtain data on the incidence of DWI lesions in different patient groups, we reviewed 398 subjects with documented cognitive decline and 204 similar aged cognitively normal subjects. The cognitive decline group was enrolled in an ongoing prospective longitudinal study at the Massachusetts Alzheimer’s Disease Research Center (MADRC) between 2007 and 2010 12 and underwent at least one MRI scan. For the present study, we excluded subjects with only subjective cognitive complaints and mean global Clinical Dementia Rating (CDR) 13 Scale of 0 and subjects with a history of ICH. Of the 398 MADRC patients, we excluded 31 lacking adequate quality DWI images, 13 with other incidental brain pathologies, 9 with global mean CDR =0 and 2 with potential stroke symptoms at time of scanning, leaving 343 subjects for analysis, including 173 (50%) diagnosed with mild cognitive impartment (MCI), 103 (30%) with Alzheimer disease (AD), 20 (6%) with mixed or vascular dementia (VaD) and 47 (14%) with cognitive impairment due to other etiologies including frontotemporal dementia, Parkinson’s disease, and diffuse Lewy body dementia. The cognitively normal subjects are community-dwelling participants in the ongoing longitudinal Harvard Aging Brain Study previously described 14. As part of the selection process for this study 14, participants were excluded for previously diagnosed neurological or psychiatric conditions including ICH. Of the 204 cognitively normal subjects, we excluded 3 lacking DWI sequences and 2 with other incidental brain lesions, leaving 199 for analysis. A third group of subjects was comprised of patients with past ICH, described previously in detail 8. Of 392 subjects with history of ICH, we analyzed 178 subjects with DWI scans performed at least 2 weeks after the most recent ICH (median post-ICH interval 128 days, interquartile range 46–367 days) to avoid the acute effects of ICH on appearance of new DWI lesions. For patients who underwent more than 1 scan, we selected the chronologically first scan performed at least 2 weeks post-ICH.
Demographic and clinical data including age, gender and presence of vascular risk factors at the time point closest to MRI were obtained by chart review for the cognitive decline group and from a study questionnaire completed by control subjects. Data regarding CDR and type of dementia were determined by the MADRC treating physician. Control subjects underwent neuropsychological testing as described 14. Numbers of missing covariates are indicated in table 1. All aspects of the study were approved by the hospital Institutional Review Board and all participants provided informed consent.
Table 1.
Subjects with cognitive impairment, controls and past ICH. Significance, after Bonferroni correction, was set at p<0.016.
| Cognitive impairment (n=343) | Cognitively normal (n=199) | Past ICH (n=178)8 | |
|---|---|---|---|
| Age | 73.3±8.5 | 74.5±6 | 70.6±11.2* |
| Gender (female) | 194 (56.6) | 107 (53.7) | 80 (44.9) |
| DWI lesion present | 13 (3.8) | 10 (5) | 23 (12.9)* |
| Hypertension | 181 (52.7) | 105 (52.7) | 123 (69.1) |
| Diabetes | 36 (10.5) | 22 (11%) | 22 (12.5) |
| Hyperlipidemia | 171 (49.9) | 105 (52.7) | 75 (43.1) |
| CMB, median (interquartile range) | 0 (0,1) | 0 (0,0) | 2 (0,16)* |
| Severe WMH | 44 (13.3) | 18 (9.1) | 59 (33) |
p<0.001 compared to either cognitive impairment or normal control group
Values are mean±SD or n (%).; CMB-cerebral microbleeds; WMH-white matter hyperintensity.
Missing variables: CMB=49, WMH=15, hyperlipidemia=5, Diabetes=3, Hypertension=1
MRI acquisition and analysis
Cognitive decline and past ICH subjects underwent brain MRI on a 1.5 Tesla (T) Signa scanner (GE Medical Systems, Milwaukee, WI) using DWI, FLAIR, and GRE as previously described 8. A subset of cognitive decline subjects (n=89) had MRI performed on a 3T Trio scanner (Siemens, Munich, Germany), using DWI (repetition time/echo time 8040/84 msec, slice thickness 5 mm, interslice gap 1 mm, 128 × 128; b value = 700 s/mm^2), FLAIR and GRE images as described 15. Cognitively normal subjects underwent MRI on the same 3T scanner, using DWI (repetition time/echo time = 6230/84 msec, slice thickness = 3.0 mm, interslice gap = 0, 160 × 160, b-value = 1000 s/mm^2), FLAIR and GRE sequences as described (Hedden et al., 2012).
All images were reviewed for the presence, number and distribution of hyperintensities on DWI as well as cerebral microbleeds (CMB) on GRE and severe 16 white matter hyperintensities (WMH) as previously reported 8. We previously reported high interrater reliability for DWI lesion detection (kappa=1). A composite image of the spatial distribution of DWI lesions was created as described 8.
Estimating CMI incidence from DWI lesions
We developed mathematical models to estimate the underlying incidence of all CMI from detection of the subset of new lesions visible to DWI. For the purposes of our model we assumed that detectability of CMI on DWI depends on CMI size, spatial resolution of the scan, location of the CMI relative to MRI slices, and timing of the scan relative to CMI genesis. With these in mind, we further assumed: 1) Incidental small DWI lesions correspond to acute CMI,1 2) only lesions that occur within 10 days preceding MRI are detectable 3, yielding a probability that a new lesion will occur within the detectability time window on a randomly timed MRI scan of p=10/365=0.0274, 3) the annual rate of lesions (n) is an independent variable, and 4) CMI lesions, modeled as small spheres, can be detected only if their cross-sectional profile that falls within an imaged MRI slice is large enough to be detected as a DWI hyperintensity. We defined the variable γ, the proportion of all CMI with large enough imaged profiles to be detectable on MRI, to reflect the proportion of CMI that are large enough for MRI detection (α) multiplied by the probability that a detectably large CMI actually falls into an imaged MRI slice (δ). Based on slice thicknesses parameters in the analyzed DWI scans, we calculated that δ would range between 0.8 and 1 under all conditions and therefore made the simplifying assumption that γ≈α i.e. that essentially all CMI large enough to be detectable would fall within an imaged slice.
Previous pathological studies reported a mean CMI diameter of approximately 0.2 mm 17,18, whereas the in-plane resolution of DWI-MRI is at least an order of magnitude larger. Even allowing for some enlargement or “blooming” of the DWI lesion relative to the underlying size of the lesion 19, a CMI would likely need to be on the order of 1.0 mm diameter to be detectable. Based on data from the Religious Orders Study 2,17, the percentage of CMI’s expected to have diameters >1.0 mm is approximately 0.5% (Figure I). We therefore considered values for γ down to a lower limit of 0.1% and up to an upper limit of 10% to allow for analysis of very conservative assumptions (i.e. that would yield lower estimates for CMI incidence). See Supplementary Methods for further details.
Figure 1.
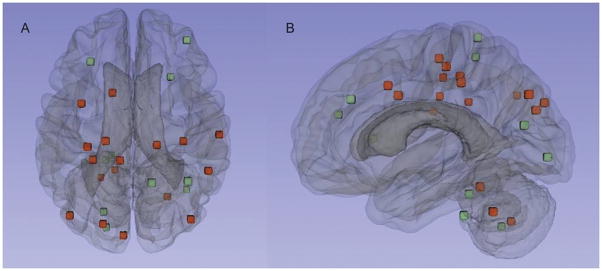
Distribution of DWI lesions. The axial (A) and sagittal (B) images display the composite cerebral and cerebellar locations of the DWI lesions in the cognitively impaired (red) and normal control subjects (green). Each spot represents the center of the lesion.
A similar approach was applied to determine the maximum likelihood estimate (MLE) for the underlying rate of incident CMI expected to generate one or more DWI lesions on a single scan as well as the impact of negative scans on annual lesion rate (see Supplementary Methods for details).
Pathologic examination for CMI
To test the plausibility of our estimations we performed extensive sampling for CMI of the brain of a 56 year old man enrolled to a prospective cohort study of cerebral amyloid angiopathy (CAA) 20. Seven years prior to his death he had spontaneous left parietal ICH and gradually developed cognitive decline since. Imaging revealed 10 lobar CMB. Two years prior to death, the subject was found to have one incidental DWI lesion on a research scan. No lesions were detected on a DWI scans performed 10 month prior to and 14 months following the DWI-positive scan. Following autopsy, the left hemisphere was systematically sampled in 32 sections, which were examined for the presence and number of CMI (see Supplementary Methods for details).
Statistical analysis
Comparisons between subjects with ICH, cognitive decline and controls were performed by one-way ANOVA and t-test respectively (for age), Wilcoxon rank-sum (for WMH, CDR, CMB), and chi-square or Fisher’s exact tests (for categorical variables). Bonferroni-corrected threshold for the 3 between-group comparisons was set at 0.016. Multivariable models were analyzed by logistic regression. The MLE analysis was done with software written by the authors using Matlab (Natick, MA).
Results
Lesion Incidence and Distribution
The cognitively impaired and cognitively normal non-ICH patients were of similar age to each other (Table 1) and slightly older than the past ICH patients 8. Clinically silent DWI lesions were present in 13 of 343 (3.8%) cognitively impaired, and 10 of 199 (5%) cognitively normal non-ICH patients, both lower than the incidence in the past ICH patients (23 of 178, 12.9%, p<0.0006 for both comparisons). Four (1.2 %) cognitively impaired and 3 (1.5%) cognitively intact patients had a corresponding low ADC signal suggesting an acute time course, while the remainder were isointense on ADC consistent with subacute infarcts. The differences between lesion incidence in the ICH and two non-ICH groups remained independent in analyses controlling for age, sex and hypertension (p<0.0013 for both comparisons). The incidence of DWI lesions did not differ between cognitively impaired subjects and normal controls (p=0.49) or between subjects with mild (CDR=0.5) or more severe (CDR ≥ 1) cognitive impairment (p=0.6). No association was found between presence of DWI lesions and severe WMH (p=0.32).
Five of the non-ICH subjects had multiple (2 to 3) lesions, yielding a total of 30 lesions, primarily in the cortical gray matter or gray/white border (14 lesions, 47%) or subcortical white matter (6 lesions, 20%). Of the remainder, 7 (23%) were cerebellar, 2 (6.7%) brainstem and 1 deep hemispheric (3.3%, Fig. 1). The 20 lobar lesions were slightly overrepresented in the occipital and underrepresented in the temporal lobes relative to the expected random distribution by lobar volume (p=0.046; Table 2) and did not differ between the cognitive impairment group and controls (Fig. 1, p=0.9).
Table 2.
DWI lesions distribution by cerebral lobe in non-ICH subjects.
| Observed distribution of lobar DWI lesions n (%) | Lobar volume %21 | Ratio Observed/Expected | P value | |
|---|---|---|---|---|
| Frontal | 8 (40) | 40.6 | 1.0 | |
| Parietal | 6 (30) | 22.6 | 1.3 | |
| Temporal | 0 | 22.8 | 0 | |
| Occipital | 6 (30) | 13.9 | 2.2 | 0.046 |
DWI=diffusion weighted imaging
Estimation Model
Our mathematical model estimates the likely annual rates of new CMI that would produce the observed fraction of subjects with at least 1 incident DWI lesion. As shown in the curves in Figure 2, the estimate depends on the parameter γ, representing the proportion of all CMI that are detectable by DWI. The three curves in Figure 2 correspond to three plausible values for this parameter, ranging from 0.1% to 10%. To generate the observed proportions of 4.2% (for elderly subjects without ICH) or 12.9 % (for subjects with past ICH), the predicted annual incidence of CMI ranges from 16 to 1566 for non-ICH and 50 to 5041 for ICH individuals. An estimate for total CMI burden can then be calculated by multiplying these annual rates by the years an individual can be expected to live at a given state. At γ=1%, for example, a non-ICH patient would be predicted to accumulate 1570, 3140, 4710 CMIs over 1, 2 or 3 decades respectively.
Figure 2.
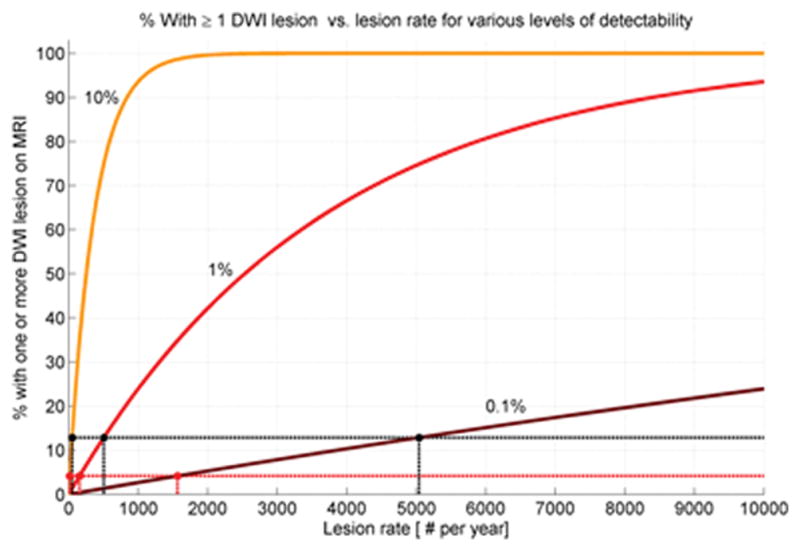
Predicted proportion of DWI-positive scans as function of CMI incidence. The percentage of subjects with DWI lesions is plotted against the underlying annual rate of new CMI lesions at three plausible values of lesion detection (γ=0.1%, 1%, and 10%).
The same mathematical approach can be used to calculate MLE for annual CMI incidence based on the presence and number of observed DWI lesions (Fig. 3). At γ=1%, for example, would be predicted to have an annual incidence of 3649 (95% CI 193–16422) new CMI per year for individuals with 1 DWI lesion on a single scan and 7299 (95% CI 1399–21270) for the presence of 2 DWI lesions. For γ<1% (i.e. less than 1% of incident CMI detectable as DWI lesions), the predicted range for new CMI per year would be correspondingly greater.
Figure 3.
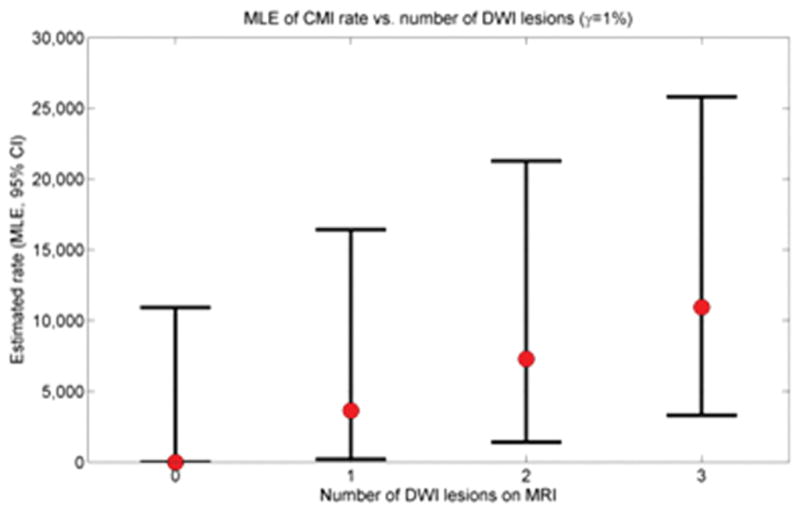
Estimated CMI rate as function of number of DWI lesions. Maximum likelihood estimates (with 95% CIs) are shown for 0, 1, 2, and 3 DWI lesions detected on a single scan (γ=1%).
Neuropathologic Validation
A subject with a single DWI lesion on 1 of 3 scans during life had autopsy with extensive tissue sampling two years after the DWI-positive scan (see Methods). Extensive histologic sampling revealed a total of 60 lesions (Fig. 4) in 32 sections, corresponding to a mean lesion per slide density of 1.9±1.3 with approximately normal distribution across the examined slides (Figure II). Based on previously reported methods,2 this density of CMI in the sampled tissue yields an estimated total brain burden MLE of 9321 CMIs (95% CI 7255–11990). For comparison, the 95% confidence interval range of annual predicted CMI incidences at γ=1% for a single DWI lesion, adjusted for the 2 additional negative DWI scans during life (Table I), is 1051 to 2529. The estimate for total CMI burden obtained from pathologic sampling is thus compatible with the estimate for annual incidence obtained from neuroimaging over a 3.7 to 8.9 years period of lesion accumulation, a timeframe supported by a recent survival analysis of patients diagnosed with advanced CAA.22
Figure 4.
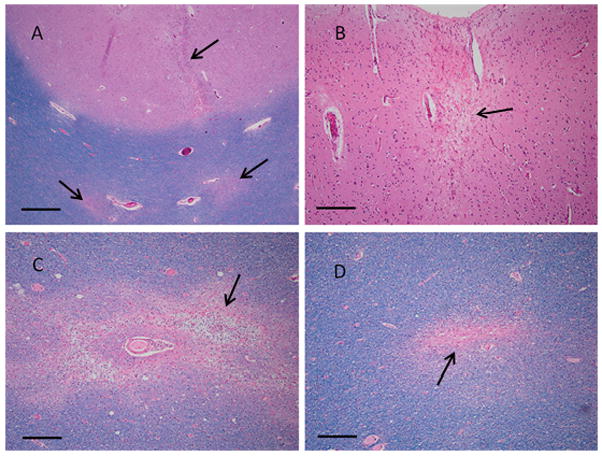
CMI (arrows) in DWI-positive CAA patient. Tissue sections from a 56 year old man with a DWI lesion detected during life show a linear cortical microinfarct and two distinct white matter infarcts (A), a single remote cortical infarct (B), a subacute white matter infarct with presence of myelin-laden macrophages (C), and a remote white matter microinfarct (D). A, C & D: LH&E; B: H&E; scale bar is 500 um in A, 200 um in B–D.
Discussion
In this study we found that subclinical DWI lesions occur at appreciable frequency in cognitively normal or impaired elderly individuals, though at lower frequency (and somewhat different location) relative to subjects with past ICH. A second notable finding from the current analysis is that because of the limited spatial and temporal sensitivity of diffusion-weighted MRI, the chance detection of even 1 or 2 DWI lesions suggests an annual incidence of hundreds of new CMI. These findings add data from living patients to the growing evidence for the sizable burden posed by CMI in the aging brain.
Measuring the full burden of CMI has been challenging. High field-strength (7Tesla) structural imaging 23 is a promising approach, but has so far been validated (via ex vivo imaging-pathological correlation) to detect only the largest CMI in the range of 1 to 2 mm diameter. The currently described approach of DWI suffers similar limitations of spatial resolution as well as limited temporal resolution, and further has yet to be validated as detecting pathological CMI. It is nonetheless notable that our estimate of total CMI burden expected to accumulate over one decade in non-ICH patients (1570 at γ=1%) are in the same range as the estimates arrived at independently based on finding 1 or 2 CMI in routine neuropathologic specimens (552 to 1,104) 2. The subset of individuals with DWI lesions detected on an MRI scan are predicted to have even greater CMI burden, with annual incidences in the range of 3649 to 7299 for those with 1 or 2 lesions (Fig. 3). This very high rate of CMI accumulation is supported by the single extensively sampled post-mortem brain from a patient who was DWI-positive during life, estimated to have more than 9000 total microinfarcts. Another support for our estimation was recently shown by Conklin et al 24. In that study, five patients with WMH underwent brain MRI scans for 16 consecutive weeks. Nine new DWI lesions were detected during the study period in 3 of the 5 subjects.
The prevalence of DWI lesions in our study is greater than previously reported. In a study of 16,206 consecutive patients who underwent MRI, the reported prevalence was 0.37% 25. This study, however, looked at both, young and elderly patients, and therefore substantially differs from our cohort. Another study of 649 subjects recruited from a memory cohort reported a prevalence of 0.9% 26. Both studies focused on acute DWI lesions only and required DWI lesions to be dark on ADC, considerably shortening the time window of detectability 3,4.
The exact mechanism and underlying pathophysiology leading to small silent ischemic lesions is not yet well understood. These lesions may be caused by SVD (arteriolosclerosis or CAA), microemboli, cerebral hypoperfusion, endothelial dysfunction, vaconstriction or chronic inflammation. As our analysis did not include subjects with acute ICH, immediate post-ICH factors such as aggressive blood pressure reduction, failure of autoregulation or increased intracranial pressure 5,6,27 are less likely to play a role. The greater prevalence of lesions in patients with past (non-acute, >14d) ICH thus suggests an important role for the SVDs associated with ICH.
Strengths of our study include the number of subjects analyzed. All scans across the groups [including ICH subjects from our previous study 8] were reviewed by the same two assessors blinded to clinical data. Our pathological method for sampling to detect CMI was selected as a rough histologic approximation of neuroimaging, in that the samples were drawn from approximately evenly space slabs cut along the anterior-posterior axis of the hemisphere and sampled without regard for evident lesions or anatomic targets. In this manner, we have attempted to perform an unbiased sampling. In addition, the degree of sampling exceeded that routinely performed in neuropathologic assessment.
Major limitations included our study’s retrospective, cross-sectional design and the absence of MR-pathologic correlation to confirm that DWI-positive lesions indeed represent CMI. However we recently showed 28 that these lesions nonetheless caused substantial changes on diffusion tensor imaging, lasting after their disappearance, consistent with the interpretation that they represent CMI. A limitation of the retrospective neuroimaging data was the mix of 1.5T and 3T magnetic field strengths among the study subjects. DWI lesion detection did not differ between the cognitive decline subjects scanned at 1.5T vs 3T (p=0.2) or between individuals within a patient group scanned with different interslice gaps (p=0.74), however, consistent with a previous analysis showing no gain in DWI sensitivity at the higher field strength 29. Another area of limitation is the large number of simplifying assumptions required for this type of mathematical modeling of biological phenomena. We assumed, for example, that CMI lesions occur independently over time. A tendency of CMI to cluster in time, such as during the timeframe immediately following ICH 6–8,11, may lead to overestimation, if the scan is taken during a time of increased DWI occurrence, or underestimation if during a relatively quiescent period. It is nonetheless reassuring that scans of the controls (n=199) were performed strictly for research purposes and were not triggered by any clinical event, reducing the possibility of scanning in proximity to such a precipitating event. Another limitation is the unknown fraction (α) of CMI large enough for detection by MRI. Based on the very small reported size distribution of pathologically detected CMI (average diameter approximately 0.2mm) 2,30,31, the 1 to 10% estimates appear unlikely to be too low and may indeed be conservatively high (leading to underestimation rather than overestimation of total CMI burden). As the real value of γ is unknown, we tested a wide range of values and all of them produced high estimates for total burden. The large number of CMI counted in our pathological sample also argues for the validity (and conservative parameter estimates) of the current model. Finally, we note that the similar frequencies of DWI-positive scans among cognitively impaired and intact elderly subjects does not support the suspected role for these lesions in promoting cognitive impairment 31,32. A possible explanation for the lack of correlation with cognitive impairment is the very wide range of total CMI burdens compatible with the finding of a single DWI lesion, evidenced by the 95% confidence intervals surrounding the above maximum-likelihood estimates. We also note that the cognitively impaired group included very few subjects (n=20) diagnosed with VaD or mixed dementia, potentially the likeliest groups to demonstrate aggressive SVD as contributor to their impairments.
The accumulating evidence for large burdens of CMI in the aging brain highlights the importance of determining these small lesions’ impact on neurologic function. Silent DWI lesions have been linked to cerebrovascular events or vascular death 9 or poor long-term functional outcome 10,26 following acute ICH and with increased risk of recurrent ischemic stroke, transient ischemic attack, and vascular death following acute ischemic stroke 33. Future studies will determine whether DWI lesions might be incorporated (along with lacunes, WMH, perivascular spaces and CMB) to the proposed SVD Score 34 or contribute independent information on SVD severity for longitudinal studies or interventional trials.
Supplementary Material
Acknowledgments
Sources of Funding
This project was supported in part by R01AG026484 and from the National Institutes of Health. The funding entities had no involvement in study design, data collection, analysis, and interpretation, writing of the manuscript, or the decision to submit for publication.
Footnotes
Statement of contribution
Study design: SMG, EA, MBW, MB, MEG
Data acquisition: EA, MEG, AV, YDR, SMR, MPF, RAS, KAJ, APY, TH, PF
Data Analysis: EA, MBW, MB, SMG
Study management: SMG, KS, AV
Manuscript preparation: EA, SMG, MBW, MB
Manuscript review: All authors
Disclosures
E Auriel: None; YD Reijmer: None; P Fotiadis: None; S. Martinez-Ramirez: None; J Ni: None; AK Reed: None; K Schwab: None; A Vashkevich: None; J Rosand: Research support NIH; Consultant Boehringer-Ingelheim; A Viswanathan: Consultant Athena Diagnostics, Data safety monitoring board Genentech, Research support NIH (P50AG005134, K23AG028726); ME Gurol: None; SM Greenberg: Scientific advisory board/Data safety monitoring board Hoffman-La Roche, Quintiles; Publishing royalties UpToDate, Medlink; Research support NIH (R01AG026484, R01NS070834, U10NS077360).
References
- 1.Smith EE, Schneider JA, Wardlaw JM, Greenberg SM. Cerebral microinfarcts: the invisible lesions. Lancet Neurol. 2012;11:272–282. doi: 10.1016/S1474-4422(11)70307-6. [DOI] [PMC free article] [PubMed] [Google Scholar]
- 2.Westover MB, Bianchi MT, Yang C, Schneider JA, Greenberg SM. Estimating cerebral microinfarct burden from autopsy samples. Neurology. 2013;80:1365–1369. doi: 10.1212/WNL.0b013e31828c2f52. [DOI] [PMC free article] [PubMed] [Google Scholar]
- 3.Muir KW, Buchan A, von Kummer R, Rother J, Baron J-C. Imaging of acute stroke. Lancet Neurol. 2006;5:755–768. doi: 10.1016/S1474-4422(06)70545-2. [DOI] [PubMed] [Google Scholar]
- 4.Burdette JH, Ricci PE, Petitti N, Elster AD. Cerebral infarction: time course of signal intensity changes on diffusion-weighted MR images. AJR Am J Roentgenol. 1998;171:791–795. doi: 10.2214/ajr.171.3.9725318. [DOI] [PubMed] [Google Scholar]
- 5.Menon RS, Burgess RE, Wing JJ, Gibbons MC, Shara NM, Fernandez S, et al. Predictors of highly prevalent brain ischemia in intracerebral hemorrhage. Ann Neurol. 2012;71:199–205. doi: 10.1002/ana.22668. [DOI] [PMC free article] [PubMed] [Google Scholar]
- 6.Gregoire SM, Charidimou A, Gadapa N, Dolan E, Antoun N, Peeters A, et al. Acute ischaemic brain lesions in intracerebral haemorrhage: multicentre cross-sectional magnetic resonance imaging study. Brain. 2011;134:2376–2386. doi: 10.1093/brain/awr172. [DOI] [PubMed] [Google Scholar]
- 7.Kimberly WT, Gilson A, Rost NS, Rosand J, Viswanathan A, Smith EE, et al. Silent ischemic infarcts are associated with hemorrhage burden in cerebral amyloid angiopathy. Neurology. 2009;72:1230–1235. doi: 10.1212/01.wnl.0000345666.83318.03. [DOI] [PMC free article] [PubMed] [Google Scholar]
- 8.Auriel E, Gurol ME, Ayres A, Dumas AP, Schwab KM, Vashkevich A, et al. Characteristic distributions of intracerebral hemorrhage-associated diffusion-weighted lesions. Neurology. 2012;79:2335–2341. doi: 10.1212/WNL.0b013e318278b66f. [DOI] [PMC free article] [PubMed] [Google Scholar]
- 9.Kang D-W, Han M-K, Kim H-J, Yun S-C, Jeon S-B, Bae H-J, et al. New ischemic lesions coexisting with acute intracerebral hemorrhage. Neurology. 2012;79:848–855. doi: 10.1212/WNL.0b013e3182648a79. [DOI] [PubMed] [Google Scholar]
- 10.Garg RK, Liebling SM, Maas MB, Nemeth AJ, Russell EJ, Naidech AM. Blood pressure reduction, decreased diffusion on MRI, and outcomes after intracerebral hemorrhage. Stroke. 2012;43:67–71. doi: 10.1161/STROKEAHA.111.629493. [DOI] [PMC free article] [PubMed] [Google Scholar]
- 11.Prabhakaran S, Gupta R, Ouyang B, John S, Temes RE, Mohammad Y, et al. Acute brain infarcts after spontaneous intracerebral hemorrhage: a diffusion-weighted imaging study. Stroke. 2010;41:89–94. doi: 10.1161/STROKEAHA.109.566257. [DOI] [PubMed] [Google Scholar]
- 12.Morris JC, Weintraub S, Chui HC, Cummings J, Decarli C, Ferris S, et al. The Uniform Data Set (UDS): clinical and cognitive variables and descriptive data from Alzheimer Disease Centers. Alzheimer Dis Assoc Disord. 2006;20:210–216. doi: 10.1097/01.wad.0000213865.09806.92. [DOI] [PubMed] [Google Scholar]
- 13.Morris JC. The Clinical Dementia Rating (CDR): current version and scoring rules. Neurology. 1993;43:2412–2414. doi: 10.1212/wnl.43.11.2412-a. [DOI] [PubMed] [Google Scholar]
- 14.Hedden T, Mormino EC, Amariglio RE, Younger AP, Schultz AP, Becker JA, et al. Cognitive profile of amyloid burden and white matter hyperintensities in cognitively normal older adults. J Neurosci. 2012;32:16233–16242. doi: 10.1523/JNEUROSCI.2462-12.2012. [DOI] [PMC free article] [PubMed] [Google Scholar]
- 15.Martinez-Ramirez S, Pontes-Neto OM, Dumas AP, Auriel E, Halpin A, Quimby M, et al. Topography of dilated perivascular spaces in subjects from a memory clinic cohort. Neurology. 2013;80:1551–1556. doi: 10.1212/WNL.0b013e31828f1876. [DOI] [PMC free article] [PubMed] [Google Scholar]
- 16.Fazekas F, Chawluk JB, Alavi A, Hurtig HI, Zimmerman RA. MR signal abnormalities at 1.5 T in Alzheimer’s dementia and normal aging. AJR Am J Roentgenol. 1987;149:351–356. doi: 10.2214/ajr.149.2.351. [DOI] [PubMed] [Google Scholar]
- 17.Arvanitakis Z, Leurgans SE, Wang Z, Wilson RS, Bennett DA, Schneider JA. Cerebral amyloid angiopathy pathology and cognitive domains in older persons. Ann Neurol. 2011;69:320–327. doi: 10.1002/ana.22112. [DOI] [PMC free article] [PubMed] [Google Scholar]
- 18.Okamoto Y, Ihara M, Fujita Y, Ito H, Takahashi R, Tomimoto H. Cortical microinfarcts in Alzheimer’s disease and subcortical vascular dementia. Neuroreport. 2009;20:990–996. doi: 10.1097/WNR.0b013e32832d2e6a. [DOI] [PubMed] [Google Scholar]
- 19.Baird AE, Benfield A, Schlaug G, Siewert B, Lövblad KO, Edelman RR, et al. Enlargement of human cerebral ischemic lesion volumes measured by diffusion-weighted magnetic resonance imaging. Ann Neurol. 1997;41:581–589. doi: 10.1002/ana.410410506. [DOI] [PubMed] [Google Scholar]
- 20.Gurol ME, Irizarry MC, Smith EE, Raju S, Diaz-Arrastia R, Bottiglieri T, et al. Plasma beta-amyloid and white matter lesions in AD, MCI, and cerebral amyloid angiopathy. Neurology. 2006;66:23–29. doi: 10.1212/01.wnl.0000191403.95453.6a. [DOI] [PubMed] [Google Scholar]
- 21.Mesker DJ, Poels MMF, Ikram MA, Vernooij MW, Hofman A, Vrooman HA, et al. Lobar distribution of cerebral microbleeds: the Rotterdam Scan Study. Arch Neurol. 2011;68:656–659. doi: 10.1001/archneurol.2011.93. [DOI] [PubMed] [Google Scholar]
- 22.van Etten ES, Auriel E, Haley KE, Ayres AM, Vashkevich A, Schwab KM, et al. Incidence of symptomatic hemorrhage in patients with lobar microbleeds. Stroke. 2014;45:2280–5. doi: 10.1161/STROKEAHA.114.005151. [DOI] [PMC free article] [PubMed] [Google Scholar]
- 23.Van Veluw SJ, Zwanenburg JJM, Engelen-Lee J, Spliet WGM, Hendrikse J, Luijten PR, et al. In vivo detection of cerebral cortical microinfarcts with high-resolution 7T MRI. J Cereb Blood Flow Metab. 2013;33:322–329. doi: 10.1038/jcbfm.2012.196. [DOI] [PMC free article] [PubMed] [Google Scholar]
- 24.Conklin J, Silver FL, Mikulis DJ, Mandell DM. Are acute infarcts the cause of leukoaraiosis? Brain mapping for 16 consecutive weeks. Ann Neurol. 2014;76:899–904. doi: 10.1002/ana.24285. [DOI] [PubMed] [Google Scholar]
- 25.Yamada K, Nagakane Y, Sasajima H, Nakagawa M, Mineura K, Masunami T, et al. Incidental acute infarcts identified on diffusion-weighted images: a university hospital-based study. AJNR Am J Neuroradiol. 2008;29:937–940. doi: 10.3174/ajnr.A1028. [DOI] [PMC free article] [PubMed] [Google Scholar]
- 26.Saini M, Ikram K, Hilal S, Qiu A, Venketasubramanian N, Chen C. Silent stroke: not listened to rather than silent. Stroke. 2012;43:3102–3104. doi: 10.1161/STROKEAHA.112.666461. [DOI] [PubMed] [Google Scholar]
- 27.Prabhakaran S, Naidech AM. Ischemic brain injury after intracerebral hemorrhage: a critical review. Stroke. 2012;43:2258–2263. doi: 10.1161/STROKEAHA.112.655910. [DOI] [PubMed] [Google Scholar]
- 28.Auriel E, Edlow BL, Reijmer YD, Fotiadis P, Ramirez-Martinez S, Ni J, et al. Microinfarct disruption of white matter structure: a longitudinal diffusion tensor analysis. Neurology. 2014;83:182–188. doi: 10.1212/WNL.0000000000000579. [DOI] [PMC free article] [PubMed] [Google Scholar]
- 29.Rosso C, Drier A, Lacroix D, Mutlu G, Pires C, Lehéricy S, et al. Diffusion-weighted MRI in acute stroke within the first 6 hours: 1.5 or 3. 0 Tesla? Neurology. 2010;74:1946–1953. doi: 10.1212/WNL.0b013e3181e396d1. [DOI] [PubMed] [Google Scholar]
- 30.Okamoto Y, Ihara M, Fujita Y, Ito H, Takahashi R, Tomimoto H. Cortical microinfarcts in Alzheimer’s disease and subcortical vascular dementia. Neuroreport. 2009;20:990–996. doi: 10.1097/WNR.0b013e32832d2e6a. [DOI] [PubMed] [Google Scholar]
- 31.White L, Petrovitch H, Hardman J, Nelson J, Davis DG, Ross GW, et al. Cerebrovascular pathology and dementia in autopsied Honolulu-Asia Aging Study participants. Ann N Y Acad Sci. 2002;977:9–23. doi: 10.1111/j.1749-6632.2002.tb04794.x. [DOI] [PubMed] [Google Scholar]
- 32.Sonnen JA, Larson EB, Crane PK, Haneuse S, Li G, Schellenberg GD, et al. Pathological correlates of dementia in a longitudinal, population-based sample of aging. Ann Neurol. 2007;62:406–413. doi: 10.1002/ana.21208. [DOI] [PubMed] [Google Scholar]
- 33.Kang D-W, Lattimore SU, Latour LL, Warach S. Silent ischemic lesion recurrence on magnetic resonance imaging predicts subsequent clinical vascular events. Arch Neurol. 2006;63:1730–1733. doi: 10.1001/archneur.63.12.1730. [DOI] [PubMed] [Google Scholar]
- 34.Staals J, Makin SD, Doubal FN, Dennis MS, Wardlaw JM. Stroke subtype, vascular risk factors, and total MRI brain small-vessel disease burden. Neurology. 2014;83:1228–34. doi: 10.1212/WNL.0000000000000837. [DOI] [PMC free article] [PubMed] [Google Scholar]
Associated Data
This section collects any data citations, data availability statements, or supplementary materials included in this article.