Abstract
A sensitive and expeditious capillary electrophoresis-electrospray ionization mass spectrometry(CE-ESIMS) method for the separation, identification and determination of succinic, citric, salicylic, malic, benzoic, sorbic, ascorbic, and tartaric acid in blueberry juices has been developed. In order to obtain the analytical separation, CE-MS interface parameters(e.g., buffer pH and composition, sheath liquid and gas flow rates, sheath liquid composition, electrospray voltage, etc.) were carefully optimized. Eight organic acids were baseline separated in 8 min under optimum experimental conditions. The precisions for eight replicate separations of a standard mixture solution were 2.54–4.12 % for peak area and 0.85–2.12 % for migration time respectively. The linear ranges were 10.0–1000.0, 8.0–1000.0, 13.0–1000.0, 6.0–1000.0, 9.0–1000.0, 3.2–600.0, 6.0–1000.0 and 18.0–1000.0 μg/L for succinic, citric, salicylic, malic, benzoic, sorbic, ascorbic, and tartaric acid with detection limits of 2.5, 2.0, 3.4, 1.5, 2.2, 0.8, 1.5, 4.5 μg/L, respectively. The average recoveries of the eight components were between 86.8 and 99.8 % with RSDs of 1.8–5.3 %. The proposed method was applied to the simultaneous analysis of eight analytes in Blueberry Juice samples with satisfactory results.
Keywords: CE-ESIMS, Pseudostationary phase, Blueberry juice, Organic acids
Introduction
Blueberry, as a Ericaceae (Hashim 2004), is rich in anthocyanins (Yuan et al. 2009; Song et al. 2010; Chen et al. 2010), phenolic acids (Weng et al. 2006; Matthew et al. 2010; Agnieszka and Borowska 2008), organic acids (Melissa et al. 2010; Hu et al. 2012) and other active ingredients, which has the efficacy of decreasing lipid, anticancer and anti-aging (Yi et al. 2006; Prior et al. 2008; Suh et al. 2007). Malic acid, succinic and tartaric acid are the main ingredients in blueberry juice, which decided the taste, color and biological stability of blueberry juice. Citric acid is widely used as food additives in many kinds of juices, beverages, soft drinks and wines due to its mild and refreshing sourness. Salicylic acid is deleterious to human body and has been forbidden to use as additive in food in China. Benzoic acid and sorbic acid are used as chemical preservatives, and excessive consumption may be harmful to the human body. Ascorbic acid is a water-soluble vitamin and works as regulator in redox metabolic reactions. Appropriate organic acids can promote appetite, help digestion, and are beneficial to human health (Cameron and Campbell 1974). The maximum concentrations of these food additives in food are limited by legislation. So appropriate qualitative and quantitative analysis of these species in food is of great importance.
Various organic acids have been successfully separated and detected by chromatographic techniques such as gas chromatography (GC) (Shruti et al. 2010; Manuela et al. 2012; Ren 2002), high-performance liquid chromatography (HPLC) (Kranthi et al. 2012; Pilar et al. 2012; Gonçalves et al. 2013), ion chromatography (IC) (Naama et al. 2011; Wang et al. 2013) and so on. Compared with these methods, capillary electrophoresis (CE) is a well-know microanalysis technique for its simplicity, high efficiency, rapid analysis and low sample consumption. Capillary electrophoresis-electrospray ionization mass spectrometry (CE-ESIMS) method can effectively improve sensitivity and qualitative ability, and obtain migration time of components, molecular weight and pieces feature information in an analysis (Zheng et al. 2009). But it may decrease the efficiency of electrospray ionization of ESI and pollute ion source due to the common used non-volatile surfactant and buffer system in capillary electrophoresis (Liang et al. 2003; Zhou and Luo 1993). Hexadimethrine bromide as a modifier can form a solid adsorbed layer with capillary wall, and not easy to be washed by buffer, which can reduce the effect of surfactant on ionization of samples (Xu et al. 2002).
In this work, we developed a simple, efficient and sensitive method for the analysis of eight organic acids in blueberry juice using hexadimethrine bromide as Pseudostationary phase (PSPs) in CE-ESIMS. In the present case, eight organic acids including succinic, citric, salicylic, malic, benzoic, sorbic, ascorbic, and tartaric acid were rapidly separated with high column performance. Compared with other CE/CEC methods on the separation and determination of organic acids, this method had some obvious advantages, such as fast and efficient separation, no EOF modifiers (e.g., organic reagents and surfactants) used in the analysis process, no time-consuming column fabrication and no severe detection interference etc. (Flottmann et al. 2004; Li et al. 2013; Kuban and Karlberg 1997; Saavedra et al. 2000; Zhu et al. 2012). To the best of our knowledge, this was the first report on the separation and detection of organic acids in real blueberry juice samples by using hexadimethrine bromide as PSPs in CE-ESIMS.
Experimental
Chemicals and materials
Succinic, citric, salicylic, malic, benzoic, sorbic, ascorbic, tartaric acid standards, DTAB, TTAB, CTAB and hexadimethrine bromide was supplied by Sigma-Aldrich. Methanol, acetonitrile and isopropanol (HPLC grade) were supplied by Fisher (USA). Ammonia, acetic acid and ammonium acetate were analytical reagent grade and obtained from Sinopharm Chemical Reagents (Shanghai, China). All the water used was deionized water purified with a Milli-Q purification system (Millipore, Bedford, MA, USA).
CE-ESI-MS instrumentation
All CE-ESI-MS experiments were performed on an Agilent HP3DCE system coupled with an Agilent 1100 series ion trap mass spectrometer (1100 series LC/MSD; Agilent Technologies, Waldbronn, Germany). The sheath liquid was delivered at 1/100 split flow by an LC pump (1100 series Agilent Technologies). The instrument control, data acquisition, and data analysis were all performed in Agilent CE/MSD ChemStation with CE-MS mode.
MS detection was conducted in the ESI negative ionization mode with 4.0 kV of electrospray voltage in all experiments. Full scan mode (m/z range from 50 to 200) was operated at 150 V of fragment voltage. Nitrogen was employed as nebulizer gas and drying gas, With 12 psi of nebulizing gas, the drying gas (350 °C) flowed at a rate of 10.0 L/min. The sheath liquid was consisted of isopropanol-water (70:30, v/v) in presence of 7.5 mmol/L acetic acid and pumped at a rate of 6.0 μL/min.
Preparation of standard and buffer solution
Stock solutions of the eight organic acid (1.0 mg/mL) in deionized water were stored away from light at 4 °C in refrigerator. The working standard solutions were prepared by stepwise diluting the stock solutions with buffer solution to the desired concentrations just before use.
Buffer solution was prepared by dissolving a certain amount of ammonium acetate in deionized water and adjusted to the appropriate pH value with 1.0 mol/L acetic acid. All buffer were passed through a 0.22 μm membrane filter before used. Standard solutions and running buffer were degassed by ultrasonication for 5 min before used.
Sample preparation
The proposed method was applied to determinate the organic acids in five blueberry juice (1# is produced from Liaoning East Star Wine Co., LTD; 2# is produced from Harbin the Rand Biological Technology Development Co., LTD; 3# is produced from Dalian Green Beads Food Co., LTD; 4# is produced from Qingdao Blueberry Biological Technology Co., LTD; 5# is produced from Dalian Lanjian Agricultural Development Co., LTD) samples.
All the samples were purchased from local supermarkets. Juice samples were diluted with buffer solution to 1:10 directly. Removing the water insoluble substance by centrifuged with 10,000 r/min (25,152 g) for 10 min, filtered with a 0.22 μm membrane and diluted with buffer solution to the desired volume and pH before injection. All samples were filtered with a 0.22 μm membrane and injected directly without any other treatment.
Capillary precondition
Analysis was conducted in a bare fused-silica capillary (50 μm i.d × 70 cm, Yongnian Optical Fiber Factory, Hebei, China). New capillaries were pre-treated by sequentially rinsing for 30 min with deionized water, 1.0 M NaOH, deionized water, 1.0 M HCl, deionized water, respectively. Between runs the capillary was flushed for 5 min with deionized water and 6 min with operating electrolyte. At last, these capillaries were put in a thermostat for drying at 25 °C.
All experimental solutions were prepared in doubly distilled water and passed through a polypropylene filter (0.22 μm) prior to use, then degassed for 5 min by ultrasound. The same buffer solution should be replaced after running 3–4 times.
Results and discussion
Determination of CE parameters
The effect of kind and concentration of surfactant on separation
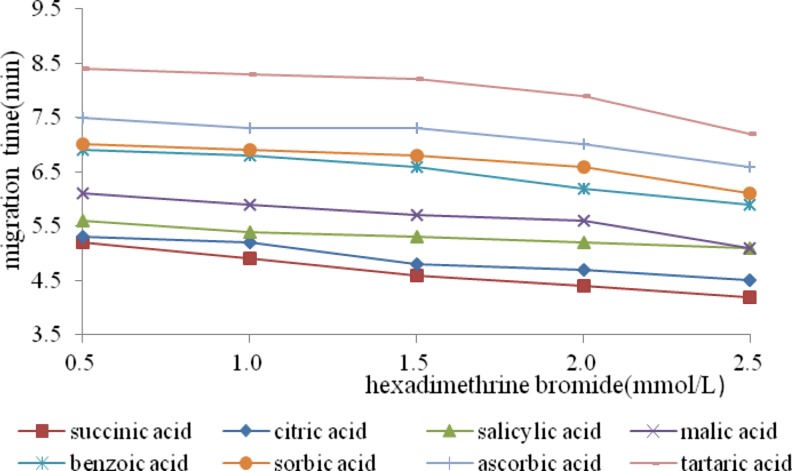
DTAB, TTAB and CTAB were the common surfactants used in capillary electrophoresis, but the difficult volatilize which affected the ionization of MS on samples and decreased the detection sensitivity of MS limited their applications. Hexadimethrine bromide as a modifier, can form a solid adsorbed layer with capillary wall, and not easy to be washed by buffer. Here, we usd hexadimethrine bromide to wash capillary before inserting capillary into MS, that significantly reduced the effect of surfactant on ionization of samples. This study investigated the effect of different concentrations of hexadimethrine bromide on migration time of organic acids. Figure 1 showed that, the migration time of organic acid reduced with the increase of hexadimethrine bromide concentration. When concentration of hexadimethrine bromide was less than 2.0 mmol/L, the part of benzoic acid and sorbic acid overlapped. However, when concentration of hexadimethrine bromide was equal to 2.0 mmol/L, the separation degree and ionization of each acid were all good.
Fig. 1.
Effect of hexadimethrine birmide concentration on the migration times
The effect of kind and concentration of buffer on separation
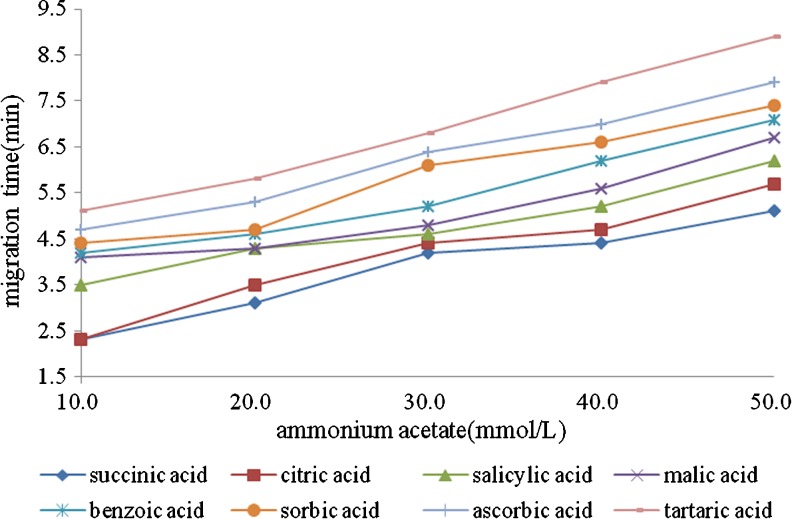
The volatile buffer solutions should try to avoid being used in MS, because they may block fog nozzle easily, pollute spray chamber and affect samples ionization. Herein, we selected volatile ammonium salt such as ammonium formate and acetic acid as buffer solutions, and found that the ammonium acetate had a better effect than ammonium formate. In this experiment, the effect of a series of buffer solution prepared with different concentrations (10.0–50.0 mmol/L) of ammonium acetate buffer solutions was studied. Figure 2 showed the separation effect was improved with the increasing buffer concentration. Nevertheless, higher concentration of buffer solution led to longer retention time, broadened peaks and lower signal intensity because of the influence of Joule heating. Consequently, concentration (40 mmol/L) was adopted for further work.
Fig. 2.
Effect of buffer solution concentration on the migration times
The effect of pH value of buffer solution on separation
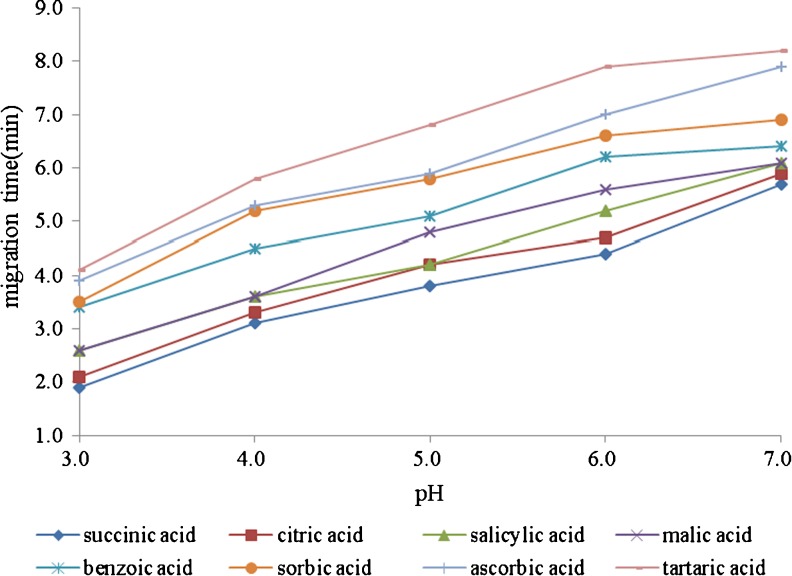
pH of buffer had the influence on the magnitude of the EOF as well as the ionization of each individual analyte, thereby affecting the separation and response. In this work, the effect of pH (3.0–7.0) was investigated. It was observed from Fig. 3 that pH = 6.0 was considered as the suitable acidity to achieve the best baseline separation and the signal intensity.
Fig. 3.
Effect of pH on the migration times of the organic acid
The Effect of separation voltage
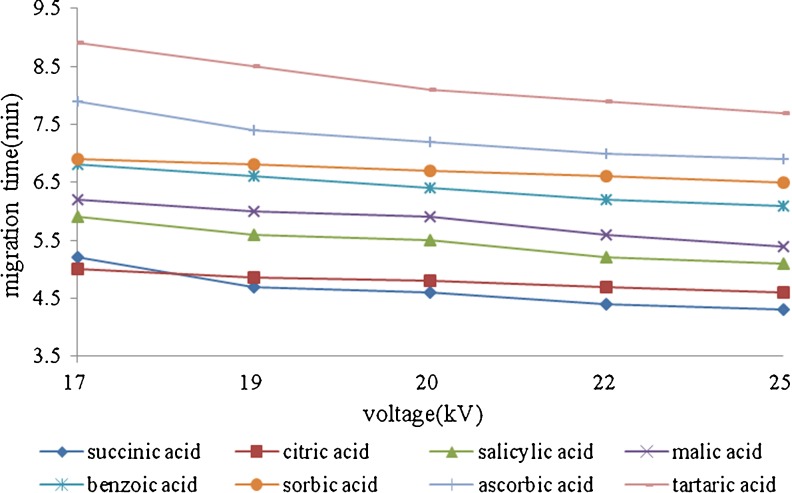
Separation voltage on the separation of eight organic acids was also investigated form 17 to 25 kV in the above chosen buffer. As shown in Fig. 4, higher the separation voltage, shorter analysis time was needed and sharper pack shapes was obtained. However, excessive voltages were not suitable due to Joule heating and bubble formation. Considering resolution, analysis time and system stability, a voltage of 22 kV was chosen for separaton.
Fig. 4.
Effect of separation voltageon the migration times
Selection of sheath liquid parameters
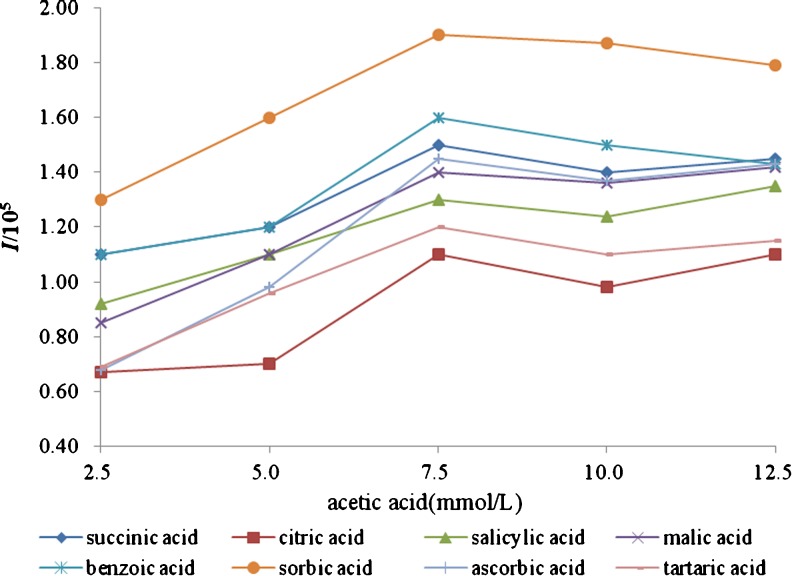
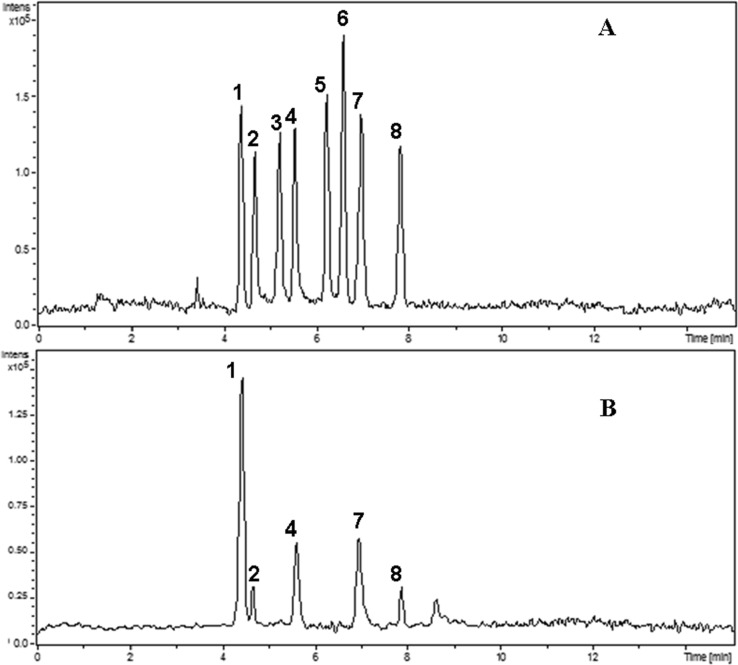
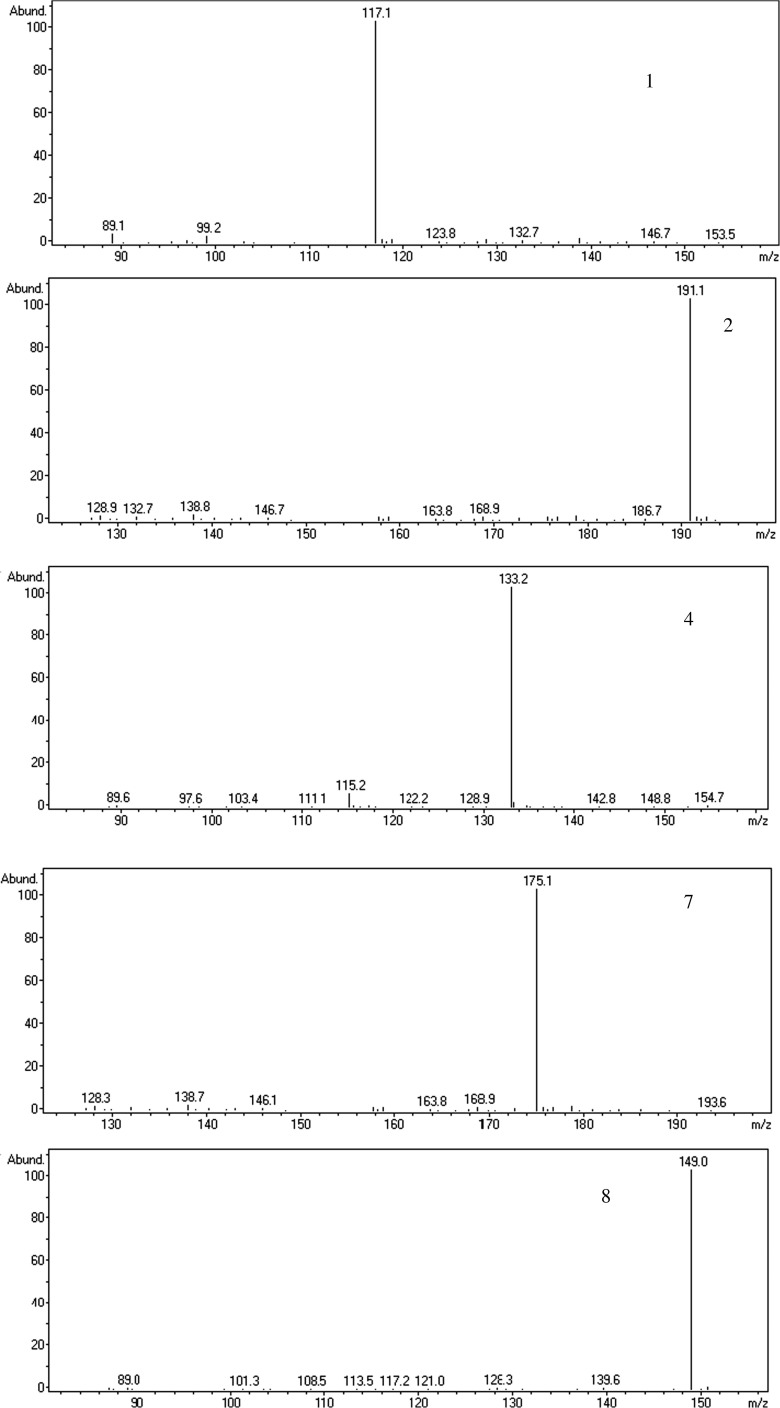
For coupling CE with ESIMS by sheath liquid interface, the sheath liquid was essential to enhance the ionization efficiency and make the electrospray stable. Based on previous study, isopropanol/water which was mostly used as sheath liquid systems in CE-ESIMS, usually showed higher ionization efficiency than methanol/water. Furthermore, low amounts of volatile reagents, such as formic acid or acetic acid, help to stabilize the spray and increase the ionization efficiency of analytes in the positive mode. In this study, different concentrations of formic and acetic acid in isopropanol/water (70/30 %, v/v) were studied, respectively. The better signal intensity and separation efficiency were obtained when 7.5 mmol/L acetic acid presented in sheath liquid, as shown in Fig. 5. In addition, the ratio of isopropanol/water (40/60 %, 50/50 %, 60/40 %, 70/30 %, 80/20 %, v/v) and the flow rate of sheath liquid (from 3.0 to 7.0 μL/min) were also investigated. When isopropanol/water ((70/30 %, v/v) containing 7.5 mmol/L acetic acid was pumped at a flow rate of 6.0 μL/min, the best signal response of all analytes was achieved. As shown in Fig. 6, the analytes succinic acid (1), citric acid (2), malic acid (4), ascorbic acid (7) and tartaric acid (8) were observed and identified by retention time and mass spectra (Fig. 7) in 1# blueberry juice sample.
Fig. 5.
Effect of the concentration of the acetic acid in sheath liquid on ionization
Fig. 6.
Total ion electropherograms for CE-ESIMS analysis of a standard solution of the eight organic acid (a) and a 1# blueberry juice sample (b). Experimental conditions: capillary 50 μm × 70 cm; separation voltage:22 kV; buffer solution: 40.0 mmol/L ammonium acetate (pH 6.0); sheath liquid, 70:30,(v/v) isopropanol/water containing 7.5 mmol/L acetic acid with a flow rate of 6.0 μL/min; flow of drying gas: 10.0 L/min; temperature of drying gas: 350 °C; nebulizing gas pressure:12 psi; Analyte identification: succinic acid (1), citric acid (2), salicylic acid (3), malic acid (4), benzoic acid (5), sorbic acid (6), ascorbic acid (7), tartaric acid (8)
Fig. 7.
Full scan mass spectra of the peaks appearing in Fig. 6 (B)
Validation of the method
The linearity of the method was determined by constructing a calibration curve with different concentrations of the eight organic acids. A series of standard mixture solutions of organic acids with concentrations from 0.8 to 1,000.0 μg/L were prepared. All studies were performed on CE-ESIMS with optimized conditions for five replicate measurements and the results were listed in Table 1.
Table 1.
Regression equation, linearity, the detection limits and repeatability of CE-ESI-MS for the analysis eight organic acidsa
| Organic acid | Regression equationb | Linear range (μg/L) | r | LOD (μg/LS/N = 3) | LOQ (μg/L S/N = 10) | Migration time (n = 5 RSD %) | Peak area (n = 5 RSD %) |
|---|---|---|---|---|---|---|---|
| Succinic acid | y = 1.6 × 10⁴x–1.3 × 10³ | 10.0–1,000.0 | 0.9989 | 2.5 | 10.0 | 1.71 | 2.54 |
| Citric acid | y = 4.5 × 10⁴x + 2.1 × 10³ | 8.0–1,000.0 | 0.9975 | 2.0 | 8.0 | 2.12 | 3.47 |
| Salicylic acid | y = 2.7 × 10⁴x + 3.9 × 10³ | 13.0–1,000.0 | 0.9995 | 3.4 | 13.0 | 0.98 | 2.89 |
| Malic acid | y = 5.1 × 10⁴x–6.2 × 10³ | 6.0–1,000.0 | 0.9968 | 1.5 | 6.0 | 1.56 | 4.12 |
| Benzoic acid | y = 2.8 × 10⁴x + 4.1 × 10³ | 9.0–1,000.0 | 0.9957 | 2.2 | 9.0 | 1.43 | 3.64 |
| Sorbic acid | y = 3.4 × 10⁴x–8.2 × 10³ | 3.2–600.0 | 0.9964 | 0.8 | 3.2 | 2.04 | 3.21 |
| Ascorbic acid | y = 8.1 × 10⁴x + 5.7 × 10³ | 6.0–1,000.0 | 0.9979 | 1.5 | 6.0 | 1.24 | 2.68 |
| Tartaric acid | y = 3.2 × 10⁴x–4.2 × 10³ | 18.0–1,000.0 | 0.9996 | 4.5 | 18.0 | 0.85 | 3.01 |
a Experimental conditions were the same as in Fig. 6a
b y:peak area of MS detection (counts); x:concentration of analytes (μg/L)
The calibration curves exhibited a good linearity with correlation coefficients(r) in the range of 0.9957–0.9996. The LOD (defined as S/N = 3) ranged from 0.8 to 4.5 μg/L, The LOQ(defined as S/N = 10) ranged from 3.2 to 18.0 μg/L, indicating that the analytical assay was sensitive to organic acids in blueberry juice sample. Practical repeatability was obtained for all analytes with RSD values (n = 5) better than 2.12 % for migration times and for less than 4.12 % peak areas, which indicating good precision of this method.
To verify the reliability of the method, recovery experiments were also performed. Under optimized conditions, three different concentrations of organic acids mix standard solutions were added into blank blueberry juice sample. As shown in Table 2, the recoveries of eight organic acids were in the range of 86.8–99.8 % with the RSD less than 5.3 %.
Table 2.
Recoveries of spiked blueberry juice samplesa
| Organic acid | Original (μg/L) | Added (μg/L) | Measured (μg/L) | Recovery (%) | RSD (%) |
|---|---|---|---|---|---|
| Succinic acid | 78.4 | 50.0 | 122.1 | 87.3 | 4.3 |
| 100.0 | 168.2 | 89.8 | 3.5 | ||
| 200.0 | 277.4 | 99.5 | 3.3 | ||
| Citric acid | 327.9 | 50.0 | 371.4 | 86.9 | 5.3 |
| 100.0 | 420.6 | 92.7 | 3.6 | ||
| 200.0 | 525.1 | 98.6 | 3.2 | ||
| Salicylic acid | — | 50.0 | 43.4 | 86.8 | 2.7 |
| 100.0 | 90.2 | 90.2 | 2.2 | ||
| 200.0 | 192.6 | 96.3 | 1.8 | ||
| Malic acid | 365.4 | 50.0 | 410.5 | 90.2 | 5.3 |
| 100.0 | 464.4 | 99.0 | 4.9 | ||
| 200.0 | 564.6 | 99.6 | 2.6 | ||
| Benzoic acid | — | 50.0 | 44.8 | 89.6 | 4.5 |
| 100.0 | 90.4 | 90.4 | 3.8 | ||
| 200.0 | 196.0 | 98.0 | 3.3 | ||
| Sorbic acid | — | 50.0 | 43.8 | 87.5 | 4.2 |
| 100.0 | 89.7 | 89.7 | 3.5 | ||
| 200.0 | 185.6 | 92.8 | 3.1 | ||
| Ascorbic acid | 289.6 | 50.0 | 333.1 | 86.9 | 3.7 |
| 100.0 | 386.4 | 96.8 | 3.2 | ||
| 200.0 | 487.0 | 98.7 | 3.1 | ||
| Tartaric acid | 450.6 | 50.0 | 495.9 | 90.6 | 3.7 |
| 100.0 | 549.2 | 98.6 | 3.5 | ||
| 200.0 | 650.2 | 99.8 | 2.9 |
Analysis of real blueberry juice samples
Under conditions determined to, the blueberry juice samples collected from local supermarket were analyzed (Table 3). Succinic acid, malic acid, tartaric acid as most likely coexisting, citric acid as acidulants, ascorbic acid as nutriment were detected in all the samples. Salicylic acid was forbidden to use as additive in food in China. No salicylic acid was found in samples by this method. Benzoic acid and sorbic acid as preservatives were detected only in 1# sample, but the concentration of them are less than LODs, other samles were not found.
Table 3.
Analytical results of organic acids in blueberry juice samplesa (μg/L)
| Organic acid | Sample1# | Sample2# | Sample3# | Sample4# | Sample5# |
|---|---|---|---|---|---|
| Succinic acid | 78.4 | 65.7 | 30.8 | 100.2 | 60.8 |
| Citric acid | 327.9 | 87.0 | 165.8 | 289.6 | 254.7 |
| Salicylic acid | NDb | ND | ND | ND | ND |
| Malic acid | 365.4 | 156.3 | 298.0 | 318.6 | 165.8 |
| Benzoic acid | NDc | ND | ND | ND | ND |
| Sorbic acid | NDc | ND | ND | ND | ND |
| Ascorbic acid | 289.6 | 165.3 | 215.8 | 354.2 | 322.4 |
| Tartaric acid | 450.6 | 432.7 | 379.8 | 337.6 | 426.8 |
Conclusions
In this study, hexadimethrine bromide was successfully used as PSPs in CE-ESIMS for the separation of eight organic acids, which were of great interest as nutriments or food additives or most likely coexisting organic acids in real samples. The influences of several factors, such as kind and concentration of surfactant, pH and concentration of running buffer on the separation were investigated. Under optimal co-EOF conditions, eight organic acids could be baseline separated with high column performance within 10 min, which exhibited some advantages over traditional CE/LCMS methods, such as simplicity, enhanced separation selectivity and high column efficiency. The proposed method was also successfully applied to the quantitative analysis of these analytes in real blueberry juice samples. The method would promise to application in the field of pharmaceutical and biochemical analysis with the development of other techniques.
Acknowledgments
The authors are grateful for the National Ministry of Science and Technology “twelfth five” support program (2012BAD31B05-3), the tackle key problems of Liaoning province (2011205001), the Special Research Foundation of Young Teachers Shenyang Agricultural University (20121013).
References
- Agnieszka S, Borowska E. Bioactive compounds and health-promoting properties of berry fruits: a review. Plant Foods Hum Nutr. 2008;63:147–156. doi: 10.1007/s11130-008-0097-5. [DOI] [PubMed] [Google Scholar]
- Cameron E, Campbell A. The orthomolecular treatment of cancer II. Clinical trial of high-dose ascorbic acid supplements in advanced human cancer. Chem Biol Interact. 1974;9:285–315. doi: 10.1016/0009-2797(74)90019-2. [DOI] [PubMed] [Google Scholar]
- Chen JP, Li YD, Xu Z. Chemical principles and bioactivities of blueberry. Acta Pharmacol Sin. 2010;45(4):422–429. [PubMed] [Google Scholar]
- Flottmann D, Hins J, Meissner T, Dietrich C, Gredilla E. Enhancing sensitivity of CZE by on-line isotachophoretic sample pretreatment. Chromatographia. 2004;60:5253–5256. [Google Scholar]
- Gonçalves J, Catarina S, Paula C. An attractive, sensitive and high-throughput strategy based on microextraction by packed sorbent followed by UHPLC-PDA analysis for quantification of hydroxybenzoic and hydroxycinnamic acids in wines. Microchem J. 2013;106:129–138. doi: 10.1016/j.microc.2012.05.037. [DOI] [Google Scholar]
- Hashim J. Blueberry production gaining in California. Texas: West Farm Press; 2004. [Google Scholar]
- Hu XL, Liu H, Lu N. Determination of 9 organic acids in bluberry juice and wine by HPLC. Food Sci. 2012;33(16):229–232. [Google Scholar]
- Kranthi C, Jayaprakasha K, Yoo K, Jifon L, Bhimanagouda S. An improved sample preparation method for quantification of ascorbic acid and dehydroascorbic acid by HPLC. LWT Food Sci Technol. 2012;47:443–449. [Google Scholar]
- Kuban P, Karlberg B. on-line dialysis coupled to a capillary electrophoresis system for determination of small anion. Anal Chem. 1997;69:1169–1173. doi: 10.1021/ac960921l. [DOI] [Google Scholar]
- Li X, Li X, Ju YY, Xu YY, Wang WF, Dong YL, Ma YH, Chen XG. On-line capillary electrophoresis enrichment by combining chitosan trapping with surfactant assisted sample stacking for the ultratrace determination of organic acids in Platrau alfalfa roots. Anal Chim Acta. 2013;789:100–106. doi: 10.1016/j.aca.2013.06.031. [DOI] [PubMed] [Google Scholar]
- Liang Z, Duan JC, Zhang WB. Evaluation of the Effects of the pH Value of Buf fer on Capillary Electrophoresis-Electrospray Ionization-Mass Spectrometry Signal Intensity. Chin J Chromatogr. 2003;21(1):9–12. [Google Scholar]
- Manuela C, José M, Enrique S. Gas chromatography coupled to mass spectrometry analysis of volatiles, sugars, organic acids and aminoacids in Valencia Late orange juice and reliability of the automated mass spectral deconvolution and identification system for their automatic identification and quantification. J Chromatogr A. 2012;1241:84–95. doi: 10.1016/j.chroma.2012.04.014. [DOI] [PubMed] [Google Scholar]
- Matthew O, Paulina G, Nicholas H. Phenolic contents of lettuce, strawberry, raspberry, and blueberry crops cultivated under plastic films varying in ultraviolet transparency. Food Chem. 2010;119:1224–1227. doi: 10.1016/j.foodchem.2009.08.039. [DOI] [Google Scholar]
- Melissa P, Ryan C, Catherine R. Determination of organic acids in Vaccinium berry standard reference materials. Anal Bio Chem. 2010;398:425–434. doi: 10.1007/s00216-010-3916-0. [DOI] [PubMed] [Google Scholar]
- Naama K, Dicinoski W, Melissa H, Paul H. Determination of pharmaceutically related compounds by suppressed ion chromatography: I. Effects of organic solvent on suppressor performance. J Chromatogr A. 2011;1218:9037–9045. doi: 10.1016/j.chroma.2011.10.011. [DOI] [PubMed] [Google Scholar]
- Pilar F, Pilar H, José F. Determination of organic acids in fruits and vegetables by liquid chromatography with tandem-mass spectrometry. Food Chem. 2012;132:1049–1054. doi: 10.1016/j.foodchem.2011.10.064. [DOI] [Google Scholar]
- Prior L, Wu XL, Gu LW. Whole berries versus berry anthocyanins: interactionswith dietary fat levels in the C57BL/6Jmouse model of obesity. J Agric Food Chem. 2008;56(3):647–653. doi: 10.1021/jf071993o. [DOI] [PubMed] [Google Scholar]
- Ren Q. Simultaneous determination of fumaric acid, lactic acid and citric acid in feed addictives by derivative - capillary Gas chromatography. Chin J Anal Chem. 2002;30(3):304–306. [Google Scholar]
- Saavedra L, Garcia A, Barbas C. Development and validation of a capillary electrophoresis method for direct measurement of isocitric, citric, tartaric and malic acids as adulteration markers in orange juice. J Chromatogr A. 2000;881:395–401. doi: 10.1016/S0021-9673(00)00258-2. [DOI] [PubMed] [Google Scholar]
- Shruti S, Tae B, Park H, Kim M, Lee IK, Kim JK. Determination of non-volatile and volatile organic acids in Korean traditional fermented soybean paste (Doenjang) Food Chem Toxicol. 2010;48:2005–2010. doi: 10.1016/j.fct.2010.04.034. [DOI] [PubMed] [Google Scholar]
- Song YC, Chen YJ, Li H. Rapid detection methods for anthocyanins in blueberry beverage. Food Sci. 2010;31(24):334–336. [Google Scholar]
- Suh N, Paul S, Hao X. Pterostilbene, an active constituent of blueberries, suppresses aberrant crypt foci formation in the azoxymethane-induced colon carcinogenesis model in rats. Clin Cancer Res. 2007;13:350–355. doi: 10.1158/1078-0432.CCR-06-1528. [DOI] [PubMed] [Google Scholar]
- Wang ZH, Xia JF, Zhao FY, Han Q, Guo XM, Wang H, Ding MY. Determination of benzoic acid in milk by solid-phase extraction and ion chromatography with conductivity detection. Chin Chem Lett. 2013;24:243–245. doi: 10.1016/j.cclet.2013.01.048. [DOI] [Google Scholar]
- Weng FH, Chen JY, Wen PF. Detection of 11 phenolic acid of blueberry wine by high performance liquid chromatography. Food Sci. 2006;27(9):223–228. [Google Scholar]
- Xu CF, Shen HL, Song HW. Capillary electrophoresis- electrospray mass spectrometry and its application in proteomics. J Instrum Anal. 2002;21(4):95–98. [Google Scholar]
- Yi WG, Akoh C, Fischer J. Absorption of anthocyanins fromblueberry extracts by Caco-2 human intestinal cell monolayers. J Agric Food Chem. 2006;54(15):5651–5658. doi: 10.1021/jf0531959. [DOI] [PubMed] [Google Scholar]
- Yuan S, Yao SJ, Geng Y. Identification of anthocyanins and flavonols in extract of blueberry by using HPLC-ESI-MS/MS. Acta Chim Sin. 2009;67(4):318–322. [Google Scholar]
- Zheng YJ, Duan YT, Zhang YF. Determination of organic acids in Red wine and must on only One RP-LC-column directly after sample dilution and filtration. Chromatographia. 2009;69:1391–1395. doi: 10.1365/s10337-009-1085-0. [DOI] [Google Scholar]
- Zhou GH, Luo GA. Capillary electrophoresis-mass spectrometry and its application. J Anal Sci. 1993;14(4):338–344. [Google Scholar]
- Zhu QQ, Xu XQ, Huang YY, Xu LJ, Chen GN. Field enhancement sample stacking for analysis of organic acids in traditional Chinese medicine by capillary electrophoresis. J Chromatogr A. 2012;1246:35–39. doi: 10.1016/j.chroma.2012.02.005. [DOI] [PubMed] [Google Scholar]


