

Abstract
The objective of the study was to perform serial magnetomyographic examinations in order to detect changes in synchrony characteristics of myometrial electrophysiological activity as women approach labor. Of the total of 56 patients recruited, the results of 149 examinations from 29 patients were included in the analysis. The global synchrony across each sensor spread over the abdomen was computed and quantified as synchronization index. The mean and the median value of the global synchrony were computed and correlated with time to active labor from the last recording. Overall, synchrony increased as the patient approached active labor (P = .035). Furthermore, mean synchronization index increased twice as fast in the nonnulliparous group compared to the nulliparous group (P = .039). The changes in synchrony of uterine electrophysiological activity near term could aid in prediction of labor.
Keywords: electromyography, labor, magnetomyography, term, preterm, uterus
Introduction
Early and reliable diagnosis is essential for the development of successful interventions to prevent preterm delivery and improve outcome. According to the National Institute of Child Health and Human Development,1 the preterm birth rate in the United States is over 12% of all live births, accounting for over half a million premature births each year. Preterm birth is the leading cause of death among African American infants, the second leading cause in caucasians, and is associated with an increased risk of developmental disabilities. Over the last 2 decades, preterm birth rates have risen approximately 30%, reaching 12.7% in 2005. It is one of the most important obstetrical problems and has a major impact on both the medical and the economic2 aspects of our health care system. Low birth weight infants that survive preterm delivery are 10 times more likely to have neurological complications such as cerebral palsy, visual and hearing impairment, and chronic lung problems.3 Home monitoring devices based on tocodynamometry have also been developed for early detection of preterm labor in high-risk patients. Large randomized controlled trials have demonstrated that the use of a home uterine monitor is not associated with a decrease in the incidence of preterm birth.4 Despite the advancement of medicine and technology, the incidence of preterm birth in the United States has not decreased.
In terms of physiology, the uterus is a complex organ, and the underlying mechanism of labor is only partially understood.5–7 Uterine contractions can be described by their mechanical and electrophysiological aspects. A mechanical contraction is manifested as a result of the excitation as well as the propagation of electrical activities in the uterine muscle and appears in the form of an intrauterine pressure increase. In order for the myometrial cells to contract rhythmically and forcefully, there should be a mechanism by which the cells interact to achieve synchronous activity in order to deliver the fetus during labor. It is well known that the sequence of contraction and relaxation of the uterine myometrium results in cyclic depolarization and repolarization of the membranes of the muscle cells. Like cardiac cells, uterine myometrial cells can generate either their own impulses—pacemaker cells—or can be excited by the action potentials propagated from the other neighboring cells—pacefollower cells. The complexity in understanding the uterine activity arises from the fact that each myometrial cell, unlike cardiac cells, can act as a pacemaker or as a pacefollower. In other words, there is no evidence of the existence of a fixed anatomic pacemaker area on the uterine muscle. Action potential bursts can originate from any uterine cell and thus the pacemaker location can shift from one contraction to another.5–9 Normally, close to term gestation, the myometrial cells contract rhythmically and forcefully to achieve synchronous activity in order to deliver the fetus during labor. The onset and progress of labor are related to the degree of synchrony in the electrical activation of uterine contractions.10 Early studies by Csapo and Takeda11,12 have shown that labor is a result of rapid spread of action potential throughout the myometrium. Further, in vivo recording in animal and human studies have shown that electrical activity becomes synchronized over the uterus during labor resulting from an increase in propagation in the myometrium.9,12–14
In order to better understand the physiological mechanism of uterine contraction, we have conducted studies15,16 using a noninvasive device that records biomagnetic fields (magnetomyography [MMG]) corresponding to the electrical activity of the uterine smooth muscle. We believe that MMG,15 a relatively new noninvasive technology, can provide an objective approach to diagnose and predict preterm labor. In the initial phase of study, the technology needs to be applied to term labor in order to better understand and quantify the changes in the uterine electrophysiology as the uterus prepares to approach active labor. The spatial–temporal information with this multisensor array technology provides much more information about the contractile nature of the uterus than has previously been possible to obtain.
Our group was the first to show the feasibility of performing noninvasive MMG recordings corresponding to the electrical activity of the uterine smooth muscle.15 After performing the feasibility phase of the study, the next step was to test the hypothesis that this technique could aid in understanding the mechanism of labor in both term and preterm pregnancies. We characterized the noninvasive magnetic field recordings of uterine electrophysiological activity in patients who presented to the labor and delivery triage area for evaluation of onset of labor. A total of 15 patients (11 term and 4 preterm) participated in the study.16 The relative strength of MMG activity increased in patients in active labor (≥3 cm cervical dilation) when compared to patients with contractions but not in active labor (both term and preterm). This study showed that increased peak–amplitude values of the magnetic activity of the uterus correlate with the development of labor within 48 hours of the recording. This finding relates to the fact there is an increased electrical activation of the myometrium close to the onset of labor.
Although there were a limited number of preterm patients, we demonstrated that this technology could potentially be applied to preterm labor patients.16 However, before performing a large-scale study of preterm patients, we would need to identify the changes in the signature and characteristics of uterine activity as the uterus approaches active labor in low-risk term pregnancies. More recently as a proof of concept on a few term patients, we have shown that the electrical synchrony of the uterus increases as it gets closer to active labor.17 Based on these results, in this current study, we performed serial recordings in patients starting at the end of the 36th week of gestation until the onset of active labor in order to track any changes in the synchronization of the uterine electrical activity.
Methods
All data were collected at the University of Arkansas for Medical Sciences (UAMS) SQUID Array for Reproductive Assessment (SARA) Research Center.15 This study was approved by the UAMS institutional review board. The study protocol was explained to the patients, and written consent to perform the study was obtained. The gestational age at each visit and other demographic information were recorded. The patients were then asked to sit comfortably and lean forward on to the sensor array (Figure 1). Each patient was requested to begin study participation close to the end of the 36th week of gestation and to return for repeated measurements at least 3 times/wk until they reached active labor. A total of 56 patients were recruited for the study. Any patient who had less than 3 serial recordings before reaching active labor was excluded from the tracking analysis, which resulted in 35 patients (Table 1). Active labor was defined as cervical dilation of 3 cm or greater. Patients who were induced or had a cesarean section before they entered into active labor were also excluded. Based on this criterion, 149 successful recordings from 29 patients were included in the synchrony analysis. The earliest recording was at 36 weeks and 5 days of gestation, and the latest recording performed was at 40 weeks and 4 days. Each recording session lasted approximately 20 minutes with a sampling rate of 250 Hz.
Figure 1.
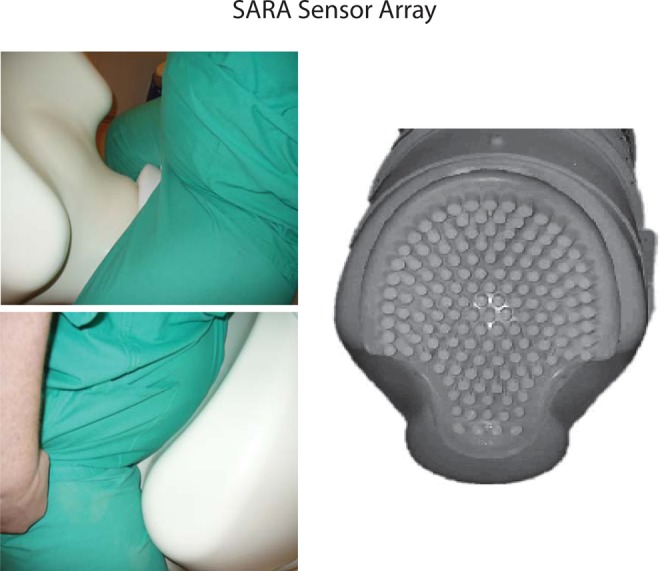
View of mother being positioned on SQUID Array for Reproductive Assessment (SARA) system and the spread of the sensors over the gravid abdomen.
Table 1.
Recording Times and Pregnancy-Related Parameters in Patients With ≥3 Serial Recordings.
| Patient ID | Maternal Race/Ethnicity | Maternal Age, Years | BMI, kg/m3 | Day of First Recording Prior to Onset of Active Labor | Day of Last Recording Prior to Onset of Active Labor | GA at First Recording | GA at Last Recording | GA at Active Labor | Parity | Induced Before Active Labor |
|---|---|---|---|---|---|---|---|---|---|---|
| 2 | W | 27 | NA | 10 | 3 | 37w2d | 38w2d | 38w5d | 1 | N |
| 3 | W | NA | 37.9 | 12 | 2 | 37w4d | 39w0d | 39w2d | 1 | Y |
| 4 | O | 26 | 28.1 | 20 | 4 | 36w6d | 39w1d | 39w5d | 0 | N |
| 6 | W | 34 | 24.8 | 18 | 15 | 37w1d | 37w4d | 39w5d | 1 | N |
| 7 | W | 31 | 35.2 | 9 | 2 | 37w0d | 38w0d | 38w2d | 0 | Y |
| 10 | AA | 21 | 38.3 | 4 | 2 | 37w3d | 37w5d | 38w0d | 1 | N |
| 13 | AA | 19 | 33.8 | 24 | 1 | 37w4d | 40w6d | 41w0d | 0 | Y |
| 14 | W | 28 | 30.5 | 30 | 16 | 36w5d | 38w5d | 41w0d | 2 | N |
| 15 | AA | 20 | 22.1 | 13 | 1 | 37w5d | 39w3d | 39w4d | 0 | N |
| 16 | AA | 33 | 25.3 | 10 | 1 | 37w1d | 38w3d | 38w4d | 2 | N |
| 17 | AA | 21 | 22.6 | 8 | 0 | 37w0d | 38w0d | 38w1d | 1 | N |
| 18 | H | 30 | 27.9 | 12 | 2 | 37w0d | 38w3d | 38w5d | 1 | N |
| 19 | W | 26 | 29.0 | 16 | 1 | 37w1d | 39w2d | 39w3d | 0 | N |
| 21 | O | 30 | NA | 16 | 2 | 38w5d | 40w5d | 41w0d | 0 | N |
| 22 | W | 26 | 29.7 | 21 | 1 | 37w1d | 40w0d | 40w1d | 0 | N |
| 23 | W | 27 | 33.5 | 21 | 12 | 36w6d | 38w1d | 39w6d | 0 | N |
| 24 | W | 19 | 25.2 | 7 | 3 | 37w0d | 37w4d | 38w0d | 0 | Y |
| 25 | W | 30 | 21.7 | 10 | 3 | 37w0d | 38w0d | 38w3d | 2 | N |
| 26 | AA | 37 | 30.6 | 4 | 1 | 37w1d | 37w4d | 37w5d | 1 | N |
| 29 | W | 25 | 30.8 | 14 | 1 | 36w4d | 38w3d | 38w4d | 0 | N |
| 30 | W | 26 | 26.4 | 10 | 1 | 37w1d | 38w3d | 38w4d | 0 | Y |
| 31 | W | 22 | 30.4 | 10 | 4 | 37w1d | 38w0d | 38w4d | 0 | Y |
| 37 | W | 38 | 32.9 | 13 | 6 | 37w2d | 38w2d | 39w1d | 0 | N |
| 38 | W | 21 | 24.7 | 26 | 22 | 37w1d | 37w5d | 40w6d | 0 | N |
| 39 | W | 23 | 43.5 | 20 | 4 | 37w0d | 39w2d | 39w6d | 0 | N |
| 42 | AA | 26 | 27.8 | 13 | 3 | 37w3d | 38w6d | 39w2d | 4 | N |
| 44 | AA | 36 | 34.6 | 3 | 1 | 37w0d | 37w2d | 37w3d | 3 | N |
| 46 | AA | 23 | 33.8 | 6 | 3 | 37w0d | 37w3d | 37w6d | 2 | N |
| 47 | AA | 34 | 30.0 | 16 | 7 | 37w1d | 38w3d | 39w2d | 1 | N |
| 48 | AA | 19 | NA | 22 | 2 | 37w0d | 39w6d | 40w1d | 1 | N |
| 50 | W | 26 | 31.6 | 11 | 7 | 37w1d | 37w5d | 38w4d | 1 | N |
| 51 | AA | 19 | 27.6 | 15 | 1 | 37w4d | 39w4d | 39w5d | 0 | N |
| 52 | AA | 26 | 44.0 | 12 | 3 | 37w0d | 38w2d | 38w5d | 0 | N |
| 54 | W | 26 | 25.1 | 20 | 1 | 37w0d | 39w5d | 39w6d | 0 | N |
| 56 | W | 28 | 28.7 | 18 | 2 | 37w2d | 39w4d | 39w6d | 3 | N |
Abbreviations: AA, African-American; W, white; H, Hispanic; O, other (Asian, American Indian/Alaskan Native); NA, not available; BMI, body mass index; GA, gestational age; w, weeks, d, days; Y, yes; N, no.
In the postprocess, we bandpass filtered the signals (0.35-0.8 Hz) using a Butterworth filter with zero phase distortion to attenuate the fetal and maternal cardiac signals. We then partitioned the MMG from all the 150 sensors into 10-second end-to-end epochs. In each epoch, we computed the Hilbert transform of the signals and calculated the Hilbert amplitude.18 To this end, we calculated the squared correlation coefficient between each sensor and every other sensor, which resulted in a 150 × 150 matrix, called an association matrix, which we used for further analysis. We defined the global synchronization index as the ratio of the sum of the leading eigenvalues of the association matrix from a patient’s observed data to the trace of this matrix. Leading eigenvalues were themselves defined as being larger in magnitude than a noise floor, which in turn was computed as the largest eigenvalue from a so-called “null” association matrix computed from a randomly scrambled version of the patient’s data. To identify the sensor regions that contributed to global synchrony, we projected the association matrix onto the eigenvector corresponding to the leading eigenvalue.
In the next step, we tracked changes in the synchronization index starting at the end of 36 weeks of study until the last MMG before the patient reached active labor. To accomplish this, we computed the mean and the median value of the synchronization index. Furthermore, in order to look at the effect of parity on the synchronization index, the patients were classified into nulliparous and nonnulliparous (≥1; primiparous and multiparous) groups, and this classification was included as an additional covariate in the statistical analysis. Based on the separation, 13 nulliparous (76 recordings) and 16 nonnulliparous patients (73 recordings) were part of the analysis.
Because all values of the synchrony index fell between 0 and 1 by definition, the data were analyzed via “β regression,” which assumes the residuals follow β distributions instead of Gaussian distributions.19 Specifically, the data were subjected to mixed models β regressions using the Glimmix Procedure (SAS v9.3; The SAS Institute, Cary, North Carolina) with link = logit, distribution = β, and a random subject effect. Two regression models were considered, that is (1) a univariate model with days prior (the number of days before active labor) as the only fixed effect and (2) a bivariate model with parity (nulliparous and nonnulliparous), days prior, and their interaction as the fixed effects. P < .05 was considered statistically significant, despite the multiple testing, in order not to compromise type II error.
Results
The number of serial recordings per patient ranged from 3 to a maximum of 9. The characteristics of the patient population and other study parameters are shown in Table 1. For each patient, the timing of initial and final recording prior to active labor is provided in days and by gestational age. The parity and the information regarding induction are tabulated.
Figures 2 and 3 show the variation in MMG synchrony occurring between the first and the last day of recording just before the onset of active labor. In Figure 2, patient 17 shows a clear increase in synchrony starting at 37 weeks until active labor was reached on the day of the last MMG study at 38 weeks 1 day. Similarly, Figure 3 shows the variation in synchronization index for data from patient 48 at 22 days (37 weeks) until 2 days (40 weeks 1 day) prior to active labor. Small regions of low synchronous activity can be observed in earlier recordings, whereas there is a significant increase in the synchrony over the entire recording area 2 days before the patient reached active labor.
Figure 2.
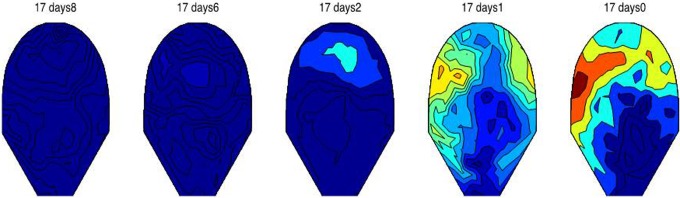
The variation in synchronization index as a function of gestational age for patient 17. The first recording was performed at gestational age of 37 weeks 0 days, and last recording was performed on 38 weeks and 1 day. The day prior to which the study was done calculated from the day on which the mother went into active labor is shown. There is a significance increase in the overall synchrony on the day before the patient reached active labor. The patient delivered on the same day after the last MMG study (38 weeks 1 day). Scale ranges from low synchrony (dark blue) to high synchrony (dark red).
Figure 3.

The variation in synchronization index as a function of gestational age for patient 48. The first recording was performed at gestational age of 37 weeks 0 days and last recording was performed on 39 weeks and 6 days. The day prior to which the study was done calculated from the day on which the mother went into active labor is shown. Low synchronous activity can be observed in earlier recordings in small pockets, whereas there is a significant increase in the synchrony over the entire recording area 2 days before the patient reached active labor. The patient delivered 3 days after the last the magnetomyography (MMG) study (40 weeks 2 days). Scale ranges from low synchrony (dark blue) to high synchrony (dark red).
The plot in Figure 4 shows the regression-predicted mean (95% confidence limits) of synchronization mean as a function of the days prior to active labor. This figure shows the β-regression results for the univariate model with days prior as the only fixed effect. In particular, it shows that the average mean synchronization index (MSI) increases steadily with time as the population approaches active labor, at a logit rate ± standard error of 0.0110 ± 0.0052 per day; moreover, the rate of increase was statistically significant (P = .035).
Figure 4.
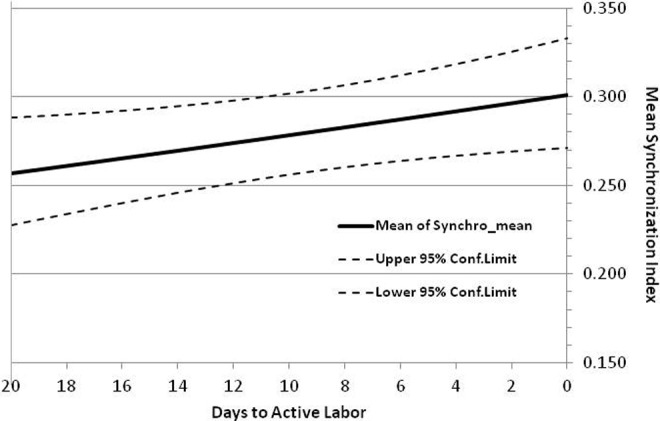
Depicts the variation in mean synchronization index with days to active labor. The upper and lower 95% confidence limits are also plotted.
Figure 5 shows the β-regression results for the bivariate model with days prior, parity, and the parity-by-days-prior interaction as the fixed effects. In particular, it shows that the average MSI of both parity groups increases steadily with time as the population approaches active labor. However, MSI increased almost twice as fast in the nonnulliparous group, with a logit rate ± standard error of increase of 0.0162 ± 0.0078 per day (P = .039), compared to a logit rate of only 0.0082 ± 0.0071 per day (P = .25) in the nulliparous group.
Figure 5.
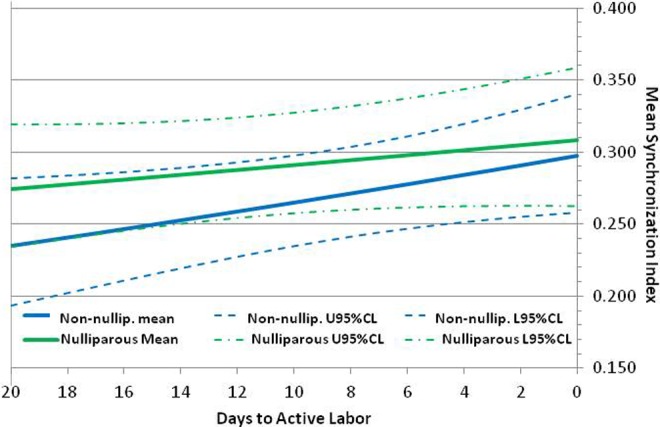
Depicts the variation in mean synchronization index with days to active labor based on parity. The upper and lower 95% confidence limits are also plotted for both nulliparous and nonnulliparous patients.
Comment
A complete spatial–temporal mapping of uterine activity throughout pregnancy is a key parameter in the understanding the mechanism of uterine contraction.9,20,21 The large surface area and the shape of the SARA array provide the ability to noninvasively record magnetic signals associated with the initiation and propagation of uterine activity. In this report, we have shown that quantification of spatial distribution through investigation of the amplitude synchronization of the MMG signals can provide insight into the changes that occur in the uterine electrophysiology before active labor is reached. Due to the poor predictive power of the tocography and the invasive nature of intrauterine pressure catheter, neither technique has been beneficial in the prediction of preterm labor or the diagnosis of true labor at term. Unwanted hospital stays and treatment could be avoided if physicians were able to more objectively differentiate between true labor and false labor. For preterm labor patients, early diagnosis is essential to the implementation of successful interventions to prevent preterm delivery and improve outcome.
Electrophysiological studies show that smooth muscle exhibits syncytial nature by having low resistance pathways between adjacent cells.22 The electrical activity arising from the pacemaker cells excites the neighboring cells because they are coupled by electrical synapses called gap junctions, which provide the low resistance pathway. Gap junctions are intercellular channels that facilitate electrical and metabolic communications between myometrial cells. Gap junctions consists of pores composed of proteins known as connexins that connect the interior of 2 cells and allow current and molecules to cross between the cells. The gap junction function is regulated by structural coupling (the number of gap junctions), functional coupling (permeability), and their degradation. Garfield et al22–24 have shown that gap junctions are sparse throughout pregnancy but increase during delivery in various species. It has been shown that at preterm, although the uterus is spontaneously active, these may be isolated areas of activation due to limited propagation resulting in low-amplitude contractions. Conversely, at term, there is an increase in the spread from these areas of activation due to an increase in the number of myometrial cells recruited and activated, resulting in high-amplitude contractions. The increase in the gap junction provides better coupling between the cells resulting in synchronization and coordination of the contractile events of the various myometrial regions in the uterus. The results of these earlier studies show clearly that the propagation of the electrical activity over the entire myometrium due to the increase in gap junction area at term is related to successful progress of labor and delivery of the fetus.
We based our study on the fact that electromyography (EMG) studies performed on humans by Garfield et al23,24 show changes in the uterine electrical activity as the uterus approaches labor. Using spectral analysis, EMG studies25 have shown that the power density of uterine EMG bursts in patients during active labor peaked at 0.71 ± 0.05 Hz when compared to nonlaboring term (0.48 ± 0.03 Hz) patients. However, none of uterine EMG studies23–26 included serial recordings on the patients and provided enough spatial resolution to observe the changes in synchrony of uterine activity as the patient approaches active labor. By recruiting patients close to term, we wanted to track changes in the uterine physiology that results in better propagation and synchronization of electrical burst activity throughout the uterus. With the high spatial–temporal resolution MMG recordings, we show the evidence of changes in the uterine electrophysiology as it prepares to approach active labor. Thus, the efficiency of contractions leading to labor relates to the spread of synchronous burst activity over a large area of the uterus.
In our preliminary work,17 we had shown that the local synchrony in the phases of the multisensor MMG increases as the mother approached active labor. However, only a small percentage of patients exhibited this feature, while in others, there was no clear increase in the spatiotemporal local phase synchrony as the mothers approached active labor. We believe that the phases may not be sensitive enough to capture the synchrony, and so in the current analysis, we computed the synchrony in the magnitude of the MMG data instead of phase synchrony.
We also studied the effect of parity on uterine MMG signals. Studies show that low-risk nulliparous women with spontaneous onset of labor have longer active labor thus indicating that parity has an effect.27,28 Our study also shows that the effect of parity may have a bearing on the uterine MMG signature, since the change in the MSI of the nonnulliparous group increased significantly faster compared to the nulliparous group during the recording period starting at the end of 36 weeks. The nonnulliparous women appear to initially lag behind and then show a steep increase in synchrony as they progress toward active labor. The observation may imply that the uterus of nonnulliparous women rapidly enters into the excitation mode shortly before onset of active labor. Although it is unclear regarding the exact mechanism that causes the difference between the 2 groups, we can only hypothesize that it is related to electrical coupling between the cells. In general, Garfield et al22 have attributed the increase in propagation with the increase in number and density of gap junctions between myometrial cells closer to parturition. It is possible that there is a rapid increase in the cell–cell connectivity in nonnulliparous uterus since it has experienced the process of labor before thus needing less preparatory time when compared to a nulliparous uterus where there is a gradual but steady increase in the cell–cell coupling. In future studies, we plan to increase the size of the study population by including a larger group of term patients and also including patients who exhibit preterm labor. The proposed sample size would adjust for the high exclusion rate that was observed in the current study.
Furthermore, there are several maternal factors such as body mass index (BMI)29–31 that affect the spontaneous onset of labor. Denison et al29 studied the effect of maternal BMI on postdates pregnancy, length of gestational age, and likelihood of spontaneous onset of labor at term. Based on a retrospective cohort study of 186 087 primiparous women in Sweden, they reported that higher maternal BMI in the first trimester and a greater change in BMI during pregnancy were associated with longer gestation and an increased risk of postdates pregnancy. Higher maternal BMI during the first trimester was also associated with decreased likelihood of spontaneous onset of labor at term and increased likelihood of complications. In future studies, we plan to record initial maternal BMI and record changes in BMI during pregnancy and correlate with the efficiency of contractile activity by tracking the synchrony.
We realize that the cost of the technology can prevent most hospitals from purchasing the SARA system, but from a research point of view, it provides a great opportunity to obtain a better insight into the mechanism of labor at the organ level. We also believe that the findings from the high spatial temporal SARA MMG will aid in improving the uterine EMG acquisition with abdominal electrodes. The MMG data can provide information on optimal placement of electrodes and better interpretation of observed signals with limited number of EMG electrodes that can be placed on maternal abdomen due to practical considerations.
In summary, MMG technology provides a unique opportunity to understand the changes that occur in uterine electrophysiology prior to labor. Both frequency and synchrony of the uterine electrical activity could be potential indicators to predict uterine progress toward active labor. Once these signatures are established in a larger population, the results can be extended to understand the electrophysiological characteristics of the uterus undergoing preterm labor. The ultimate goal of the technique is to provide predictable parameters that would assist in better management of term and preterm labor.
Footnotes
Authors’ Note: Part of this study was presented at the mini-symposia presentation at 2014 SGI Annual Conference, Florence, Italy.
Declaration of Conflicting Interests: The author(s) declared no potential conflicts of interest with respect to the research, authorship, and/or publication of this article.
Funding: The author(s) disclosed receipt of the following financial support for the research, authorship, and/or publication of this article: NIBIB/National Institutes of Health Grant R01EB007264.
References
- 1. Zerhouni EA. A report on “Prematurity Research at the NIH” 2008. http://www.nichd.nih.gov/publications/pubs/Documents/nih_prematurity_research_2008.pdf. Published Feb 2008. Accessed October 6, 2014.
- 2. Morrison J, Martin J, Martin R, Gookin K, Wiser W. Prevention of preterm birth by ambulatory assessment of uterine activity: a randomized study. Am J Obstet Gynecol. 1987;156(3):536–537. [DOI] [PubMed] [Google Scholar]
- 3. McCormick MC. The contribution of low birth weight to infant mortality and childhood morbidity. N Engl J Med. 1985;312(2):82–90. [DOI] [PubMed] [Google Scholar]
- 4. Reichmann JP. Home uterine activity monitoring: the role of medical evidence. Obstet Gynecol. 2008;112(2 pt 1):325–327. [DOI] [PubMed] [Google Scholar]
- 5. Devedeux D, Marque C, Mansour S, Germain G, Duchene J. Uterine electromyography: a critical review. Am J Obstet Gynecol. 1993;169(6):1636–1653. [DOI] [PubMed] [Google Scholar]
- 6. Kao CY. Long-term observations of spontaneous electrical activity of the uterine smooth muscle. Am J Physiol. 1959;196(2):343–350. [DOI] [PubMed] [Google Scholar]
- 7. Marshall JM. Regulation of activity in uterine smooth muscle. Physiol Rev Suppl. 1962;5:213–227. [PubMed] [Google Scholar]
- 8. Young RC. Myocytes, myometrium, and uterine contractions. Ann N Y Acad Sci. 2007;1101:72–84. [DOI] [PubMed] [Google Scholar]
- 9. Lammers WJ. The electrical activities of the uterus during pregnancy. Reprod Sci. 2013;20(2):182–189. [DOI] [PubMed] [Google Scholar]
- 10. Miller SM, Garfield RE, Daniel EE. Improved propagation in myometrium associated with gap junctions during parturition. Am J Physiol. 1989;256(1 pt 1):C130–C141. [DOI] [PubMed] [Google Scholar]
- 11. Csapo AI, Takeda H. Electrical activity of the parturient human uterus. Nature. 1963;200:680–682. [DOI] [PubMed] [Google Scholar]
- 12. Csapo AI, Takeda H. Effect of progesterone on the electric activity and intrauterine pressure of pregnant and parturient rabbits. Am J Obstet Gynecol. 1965;91:221–231. [DOI] [PubMed] [Google Scholar]
- 13. Verhoeff A, Garfield RE, Ramondt J, Wallenburg HC. Electrical and mechanical uterine activity and gap junctions in peripartal sheep. Am J Obstet Gynecol. 1985;153(4):447–454. [DOI] [PubMed] [Google Scholar]
- 14. Wolfs GM, van Leeuwen M. Electromyographic observations on the human uterus during labour. Acta Obstet Gynecol Scand Suppl. 1979;90:1–61. [DOI] [PubMed] [Google Scholar]
- 15. Eswaran H, Preissl H, Wilson JD, Murphy P, Lowery CL. First magnetomyographic recordings of the uterine activity with spatial–temporal resolution using a 151 channel sensor array. Am J Obstet Gynecol. 2002;187(1):145–151. [DOI] [PubMed] [Google Scholar]
- 16. Eswaran H, Preissl H, Wilson JD, Murphy P, Lowery CL. Prediction of labor it term and preterm pregnancies using non-invasive magnetomyographic recordings of uterine contractions. Am J Obstet Gynecol. 2004;190(6):1598–1602. [DOI] [PubMed] [Google Scholar]
- 17. Eswaran H, Govindan RB, Furdea A, Murphy P, Lowery CL, Preissl H. Extraction, quantification and characterization of uterine magnetomyographic activity—a proof of concept case study. Eur J Obstet Gynecol Rep Biol. 2009;144(suppl 1):S96–S100. [DOI] [PMC free article] [PubMed] [Google Scholar]
- 18. Furdea A, Eswaran H, Wilson JD, Preissl H, Lowery CL, Govindan RB. Magnetomyographic recording and identification of uterine contractions using Hilbert-wavelet transforms. Physiol Meas. 2009;30(10):1051–1060. [DOI] [PMC free article] [PubMed] [Google Scholar]
- 19. Swearingen CJ, Tilley BC, Adams RJ, et al. Application of beta regression to analyze ischemic stroke volume in NINDS rt-PA clinical trials. Neuroepidemiology. 2011;37(2):73–82. [DOI] [PMC free article] [PubMed] [Google Scholar]
- 20. Taggart MJ, Blanks A, Kharche S, Holden A, Wang B, Zhang H. Towards understanding the myometrial physiome: approaches for the construction of a virtual physiological uterus. BMC Pregnancy Childbirth. 2007;7(suppl 1):S3. [DOI] [PMC free article] [PubMed] [Google Scholar]
- 21. Ramon C, Preissl H, Wilson JD, Murphy P, Lowery CL, Eswaran H. Synchronization analysis of uterine magnetic activity during contractions. BioMed Eng Online. 2005;4:55–59. [DOI] [PMC free article] [PubMed] [Google Scholar]
- 22. Garfield RE, Blennerhassett MG, Miller SM. Control of myometrial contractility: role and regulation of gap junctions. Oxf Rev Reprod Biol. 1988;10:436–490. [PubMed] [Google Scholar]
- 23. Garfield RE, Maner WL, MacKay LB, Schlembach D, Saade GR. Comparing uterine electromyography activity of antepartum patients versus term labor patients. Am J Obstet Gynecol. 2005;193(1):23–29. [DOI] [PubMed] [Google Scholar]
- 24. Garfield RE, Maner WL. Physiology and electrical activity of uterine contractions. Semin Cell Dev Biol. 2007;18(3):289–295. [DOI] [PMC free article] [PubMed] [Google Scholar]
- 25. Lucovnik M, Maner WL, Chambliss LR, et al. Noninvasive uterine electromyography for prediction of preterm delivery. Am J Obstet Gynecol. 2011;204(3):228.e1–e10. [DOI] [PMC free article] [PubMed] [Google Scholar]
- 26. Jiang W, Li G, Lin L. Uterine electromyogram topography to represent synchronization of uterine contractions. Int J Gynaecol Obstet. 2007;97(2):120–124. [DOI] [PubMed] [Google Scholar]
- 27. Neal JL, Lowe NK, Ahijevych KL, Patrick TE, Cabbage LA, Corwin EJ. “Active labor” duration and dilation rates among low-risk, nulliparous women with spontaneous labor onset: a systematic review. J Midwifery Womens Health. 2010;55(4):308–318. [DOI] [PMC free article] [PubMed] [Google Scholar]
- 28. Hilliard AM, Chauhan SP, Zhao Y, Rankins NC. Effect of obesity on length of labor in nulliparous women. Am J Perinatol. 2012;29(2):127–132. [DOI] [PubMed] [Google Scholar]
- 29. Denison FC, Price J, Graham C, Wild S, Liston WA. Maternal obesity, length of gestation, risk of postdates pregnancy and spontaneous onset of labour at term. BJOG. 2008;115(6):720–725. [DOI] [PMC free article] [PubMed] [Google Scholar]
- 30. Margriples U, Kershaw TS, Rising SS, Westdahl C, Ickovics JR. The effects of obesity and weight gain in young women on obstetric outcomes. Am J Perinatol. 2009;26(5):365–371. [DOI] [PMC free article] [PubMed] [Google Scholar]
- 31. Beyer DA, Amari F, Ludders DW, Diedrich K, Weichert J. Obesity decreases the chance to deliver spontaneously. Arch Gynecol Obstet. 2011;283(5):981–988. [DOI] [PubMed] [Google Scholar]