

Abstract
As part of the Gulf of Maine Toxicity (GOMTOX1) project, we determined Alexandrium fundyense abundance, paralytic shellfish poisoning (PSP) toxin levels in various plankton size fractions, and the community composition of potential grazers of A. fundyense in plankton size fractions during blooms of this toxic dinoflagellate in the coastal Gulf of Maine and on Georges Bank in spring and summer of 2007, 2008, and 2010. PSP toxins and A. fundyense cells were found throughout the sampled water column (down to 50 m) in the 20–64 μm size fractions. While PSP toxins were widespread throughout all size classes of the zooplankton grazing community, the majority of the toxin was measured in the 20–64 μm size fraction. A. fundyense cellular toxin content estimated from field samples was significantly higher in the coastal Gulf of Maine than on Georges Bank. Most samples containing PSP toxins in the present study had diverse assemblages of grazers. However, some samples clearly suggested PSP toxin accumulation in several different grazer taxa including tintinnids, heterotrophic dinoflagellates of the genus Protoperidinium, barnacle nauplii, the harpacticoid copepod Microsetella norvegica, the calanoid copepods Calanus finmarchicus and Pseudocalanus spp., the marine cladoceran Evadne nordmanni, and hydroids of the genus Clytia. Thus, a diverse assemblage of zooplankton grazers accumulated PSP toxins through food-web interactions. This raises the question of whether PSP toxins pose a potential human health risk not only from nearshore bivalve shellfish, but also potentially from fish and other upper-level consumers in zooplankton-based pelagic food webs.
Keywords: Harmful algal bloom, PSP toxins, Zooplankton, Vectorial intoxication, Gulf of Maine, Georges Bank
1. Introduction
It is well-established that marine consumers are capable of accumulating toxins from harmful algal blooms through trophic interactions (Anderson and White, 1992). Ingested algal toxins can be transferred upward through pelagic food chains, affecting zooplankton, fish larvae, adult fish, squid, carnivorous gastropods and crustaceans, and even birds and marine mammals (Turner and Tester, 1997; Deeds et al., 2008). Various forms of zooplankton that feed directly upon toxic algae often serve as the entry point for algal toxins into pelagic food webs (White, 1977, 1979, 1980, 1981; Doucette et al., 2005, 2006; Lefebvre et al., 2002; Turner, 2006, 2010; Turner et al., 2000, 2005) and vector these toxins to higher trophic levels. However, it is unclear whether ingested algal toxins in zooplankton and other consumers in the water column can initiate a vertical flux of algal toxins to depths where they might contaminate bottom-living consumers such as shellfish. In order to elucidate and characterize trophic pathways of algal toxin transfer in marine food webs it is necessary to identify the community of consumers that are toxin vectors.
As part of the Gulf of Maine Toxicity (GOMTOX) project, we determined Alexandrium fundyense2 abundance, paralytic shellfish poisoning (PSP) toxin levels, and the community composition of potential grazers of A. fundyense in plankton size fractions during blooms of this toxic dinoflagellate in spring and summer of 2007, 2008, and 2010. While A. fundyense blooms in the coastal Gulf of Maine have been extensively studied (Anderson et al., 2005a), much less is known about bloom dynamics and PSP toxin levels in offshore waters, including Georges Bank. The findings of this study are presented in two parts: Part 1: toxin levels (Deeds et al., this issue) and Part 2: plankton community composition and abundance (this manuscript). The datasets for these complementary analyses were derived from splits of the same samples. The companion paper (Deeds et al., this issue) focuses on the toxin concentrations and toxin profiles (relative contributions of the various saxitoxin congeners) in the toxin-containing plankton size fractions, and presents a comprehensive introduction with the background and rationale for this study. The present contribution (Part 2) focuses on plankton community composition and abundance in relation to PSP toxins in plankton size fractions, and considers trophic linkages from the toxic dinoflagellates to organisms in higher trophic levels.
2. Materials and methods
2.1. Shipboard sampling and sample processing
Samples were collected throughout the Gulf of Maine and on Georges Bank for size-fractionated toxin and plankton composition analyses (Fig. 1). Additional station information is presented in Table 1 of Deeds et al. (this issue). Ten large-scale regional cruises were conducted during the A. fundyense bloom season from April/May through August of 2007, 2008, and 2010. Vessel platforms for sample collection were the R/V Endeavor (Cruises EN435, EN437, EN448, EN451, EN476) and the R/V Oceanus (Cruises OC445, OC447, OC460, OC465, OC467). Many stations were repeatedly sampled during various cruises. A total of 45 stations (pump stations) were selected for size fractionation (Table 1), based on surface concentrations of A. fundyense determined by a “live” count at each station using the methodology of Anderson et al. (2005a).
Fig. 1.
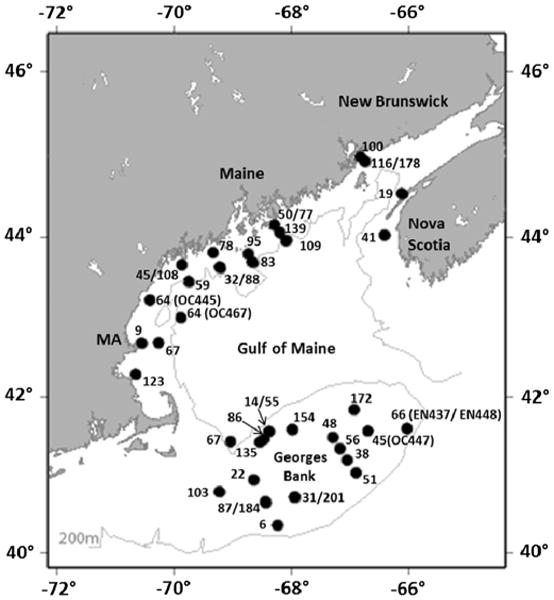
Map of study region and station locations sampled for size-fractionated plankton community composition and toxin content in the coastal Gulf of Maine and on Georges Bank. Several stations were sampled multiple times, on different cruises during the same bloom year and/or during more than one bloom year.
Table 1.
Cruise dates, pump stations sampled, live count in cells l−1, and depths (m) sampled at each station for ten large-scale regional surveys of the Gulf of Maine and Georges Bank.
| Cruise | Dates | Pump stations | Live count | Depths (m) |
|---|---|---|---|---|
| EN435 | 17–31 May 2007 | 45 | 14 | 1, 10, 19 |
| 77 | 14 | 1, 10, 20, 25 | ||
| 116, 154, 172 | 0, 1260, 252 | 1, 10, 20 | ||
| 135, 184 | 0, 3318 | 1, 10, 20, 50 | ||
| EN437 | 21 June–5 July 2007 | 31 | 2016 | 1, 10, 20, 48 |
| 51, 66, 139, 178, 201 | 952, 1274, 490, 686, 238 | 1, 10, 20, 50 | ||
| 108 | 0 | 1, 10, 20 | ||
| OC445 | 28 April–5 May 2008 | 38 | 84 | 1, 10, 25 |
| 59, 64, 86 | 112, 882, 1162 | 1, 10, 20 | ||
| OC447 | 27 May–4 June 2008 | 9 | 2492 | 1, 10, 20, 40 |
| 32, 45, 87 | 266, 518, 3626 | 1, 10, 20, 50 | ||
| 103 | 1092 | 1, 10, 20, 30 | ||
| EN448 | 27 June–3 July 2008 | 22 | 0 | 1, 10, 20, 40 |
| 48 | 0 | 5, 20 | ||
| 66, 67 | 0, 0 | 5 | ||
| EN451 | 7–13 August 2008 | 19 | 42 | 1, 10, 20, 40 |
| 41 | 70 | 1, 10, 20, 30 | ||
| 50, 78 | 28, 154 | 1, 10, 20 | ||
| OC460 | 1–10 May 2010 | 55, 123 | 62, 15 | 1, 10, 20 |
| EN476 | 26 May–4 June 2010 | 14 | 0 | 1, 10, 20 |
| 56, 95, 109 | 354, 662, 770 | 1, 10, 20, 40 | ||
| OC465 | 30 June–8 July 2010 | 14 | 0 | 1, 10, 20 |
| 6, 67, 88 | 708, 2281, 4158 | 1, 10, 20, 50 | ||
| OC467 | 29 July–6 August 2010 | 14 | 0 | 1, 10, 20 |
| 64, 83, 100 | 0, 0, 0 | 1, 10, 20, 50 |
A detailed account of the materials and methods employed for shipboard sampling and sample processing is presented in Deeds et al. (this issue). Briefly, a pumping system was used to quantitatively collect seawater from discrete depths (generally 1, 10, and 20 m, and a near-bottom depth) at selected stations, concentrating in a 20 μm-mesh plankton net.
A 4 l concentrated sample from each depth was inverted several times to homogenize the sample, which was then split into two-2 l samples, one for toxin analyses and the other for microscopic plankton analyses. Each 2 l sample concentrate was poured through a series of five nested sieves of decreasing mesh size (500, 200, 100, 64, and 20 μm), resulting in size fractions of 20–64, 64–100, 100–200, 200–500, and > 500 μm from each depth, for both toxin and plankton composition analyses. The set of size fractions intended for microscopic plankton community analyses were washed into 237 ml glass jars and preserved. The 20–64 and 64–100 μm size fractions were preserved with Utermöhl's solution (1% final concentration; Guillard, 1973) and the 100–200, 200–500, and > 500 μm size fractions were preserved with buffered formalin (5% final concentration). The set of size fractions intended for toxin analyses were individually filtered onto 47 mm glass fiber filters (Whatman GF/F) using a vacuum pump-manifold system with Gelman 250 ml magnetic heads. Each filter was folded in half, placed in a 15 ml plastic centrifuge tube in 2 ml of 1% acetic acid and frozen at −20 °C until toxin analyses. Size-fractionated samples from 45 stations in the coastal Gulf of Maine and Georges Bank with 5 size fractions per depth and 3–4 depths per station yielded two sets of 780 samples each (one set for toxin analyses and one set for microscopic analyses).
2.2. Toxin analyses
A detailed account of the materials and methods employed for toxin analyses is presented in Deeds et al. (this issue). Briefly, frozen samples in 1% aqueous acetic acid were thawed, sonicated, and centrifuged for extraction. Liquid chromatography—electrospray ionization mass spectrometry with selected reaction monitoring (Dell'Aversano et al., 2004) was the method utilized for toxin analyses.
2.3. Microscopic analyses
The 20–64 μm and 64–100 μm Utermöhl's-preserved size fractions were homogenized by inverting the sample jars several times. The sample volumes were then measured and 1 ml aliquots transferred into a Sedgwick-Rafter counting chamber for enumeration and community composition analyses by compound microscopy. Many samples had plankton concentrations that were too dense for proper and efficient microscopic analysis. These samples were diluted with filtered seawater to a dilution factor that was optimal for microscopic analysis in a single plane of focus. A. fundyense and all potential grazers of A. fundyense, including heterotrophic dinoflagellates and microzooplankton, such as aloricate ciliates, tintinnids, rotifers, and copepod nauplii, were counted and identified to the lowest practical taxonomic level. Abundances were calculated as individuals l−1.
The three larger size fractions (100–200, 200–500, and >500 μm) that were preserved in formalin were sieved and transferred to 70% ethanol solutions. Samples were split with a Folsom plankton splitter to obtain aliquots of approximately 250– 500 animals each. Animals in these aliquots were counted and identified to the lowest practical taxonomic level with a dissecting microscope. Data presented for specific copepod taxa represent pooled counts of adults and copepodites. As with the two smaller size fractions, abundances were calculated as individuals l−1.
2.4. Microscopic sorting of zooplankton and fecal pellets for toxin analyses
During the 2010 cruises, several surface samples were collected with a 335 μm-mesh plankton net for toxin analyses of microscopically-sorted zooplankton and fecal pellets (Table 2). Plankton nets were towed with a cod end for approximately 10 min, brought aboard, and washed to collect samples in the cod end. Samples were poured into a Petri dish and examined with a dissecting microscope to identify the dominant zooplankton taxa. The most abundant zooplankton species was sorted into replicate samples, as were the most abundant fecal pellets of similar size. Sorted samples were processed for toxin levels following the same methods for size-fractionated toxin samples described in Sections 2.1 and 2.2. These samples were collected during calm sea states, which were conducive to microscopically sorting animals and fecal pellets in fluid suspension, and at stations that were not pump stations.
2.5. Toxin content in A. fundyense and grazers in 20–64 μm size fractions
Although variability in toxin content of size fractions was largely due to variability in abundance of A. fundyense cells, other variability in toxin content could be attributed to differences in toxin per cell, error in sampling or counting A. fundyense cells, or to toxins in size fractions that were concentrated in grazers rather than A. fundyense. In order to examine the toxin content of A. fundyense cells and the likelihood of toxin concentrations in grazers, we computed the ratio of toxin levels (saxitoxin equivalents in ng l−1) to abundance of A. fundyense cells (cells l−1) for all samples in the 20–64 μm size fractions that contained 10 or more A. fundyense cells l−1 (98 of 156 samples). Due to the extremely high variability in abundances of A. fundyense in samples that had <10 cells l−1, these data were not included in the examination of toxin to A. fundyense ratios, because A. fundyense abundance values for these samples were essentially only presence-or-absence data due to high counting error associated with these low abundances. The toxin to A. fundyense abundance ratio was examined by location, coastal Gulf of Maine (CGM) and Georges Bank (GB), using R open source statistical software (R Development Core Team, 2008). Welch's t-test and Wilcoxon rank-sum test were performed to examine differences between the mean toxin to A. fundyense abundance ratios. Welch's t-test was performed to examine differences in grazer abundance when the CGM and GB samples were found to have unequal variances; Student's t-test was employed when there was homogeneity of variance.
3. Results
3.1. A. fundyense and toxin in size fractions
In 2007 and 2008 A. fundyense cells and PSP toxins were present at most stations on all cruises (Fig. 2 and 3). Toxins and A. fundyense cells were found throughout the sampled water column (down to 50 m) in the 20–64 μm size fractions. Maximum A. fundyense cell densities were 4884 cells l−1 in 2007 (Fig. 2G) and 3622 cells l−1 in 2008 (Fig. 3H). In most cases there was remarkable correspondence in the vertical distributions of cells and toxins. In the few cases where vertical distributions of A. fundyense cells and toxins did not correspond, A. fundyense cell concentrations were extremely low (<10 cells l−1) (EN435-St 77 and St 135, Fig. 2B and D; EN448-St 48, Fig. 3K; EN476-St 14, Fig. 4C).
Fig. 2.
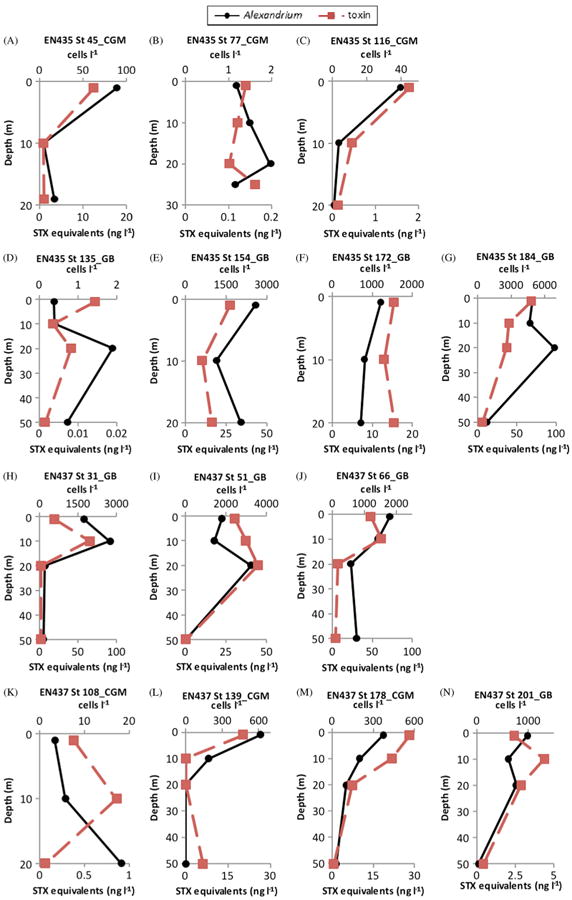
Depth distributions of PSP saxitoxin (STX) equivalent concentrations (ng l−1) ((■-dashed line) on the primary horizontal axis and A. fundyese abundance (cells l−1) (●-solid line) on the secondary horizontal axis for the 20–64 μm size fraction of stations sampled during the 2007 bloom season on the coastal Gulf of Maine (CGM) and Georges Bank (GB) during cruises EN435 (17–31 May 2007) and EN437 (21 June–5 July 2007).
Fig. 3.
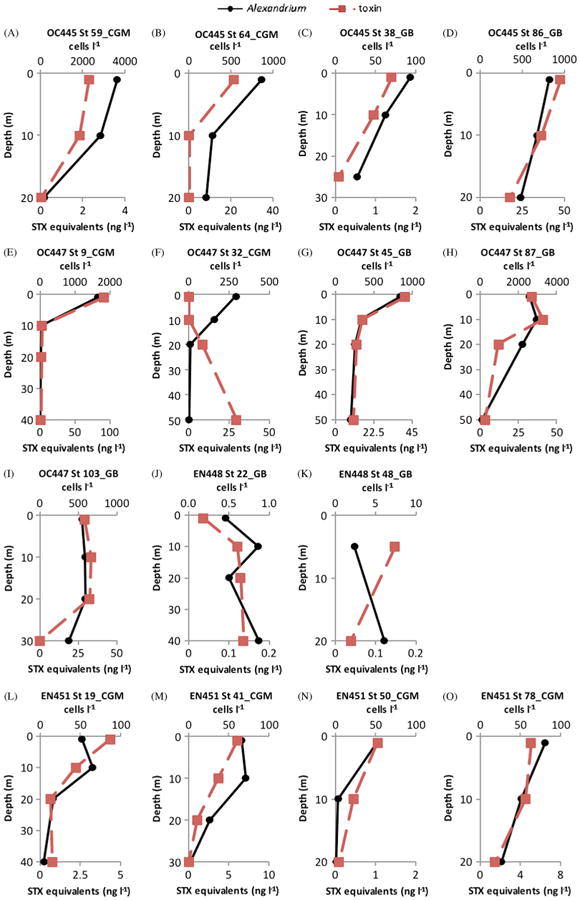
Depth distributions of PSP saxitoxin (STX) equivalent concentrations (ng l−1) (■-dashed line) on the primary horizontal axis and A. fundyese abundance (cells l−1) (●-solid line) on the secondary horizontal axis for the 20–64 μm size fraction of stations sampled during the 2008 bloom season on the coastal Gulf of Maine (CGM) and Georges Bank (GB) during cruises OC445 (28 April–5 May 2008), OC447 (27 May–4 June 2008), EN448 (27 June–3 July 2008), and EN451 (7–13 August 2008).
Fig. 4.
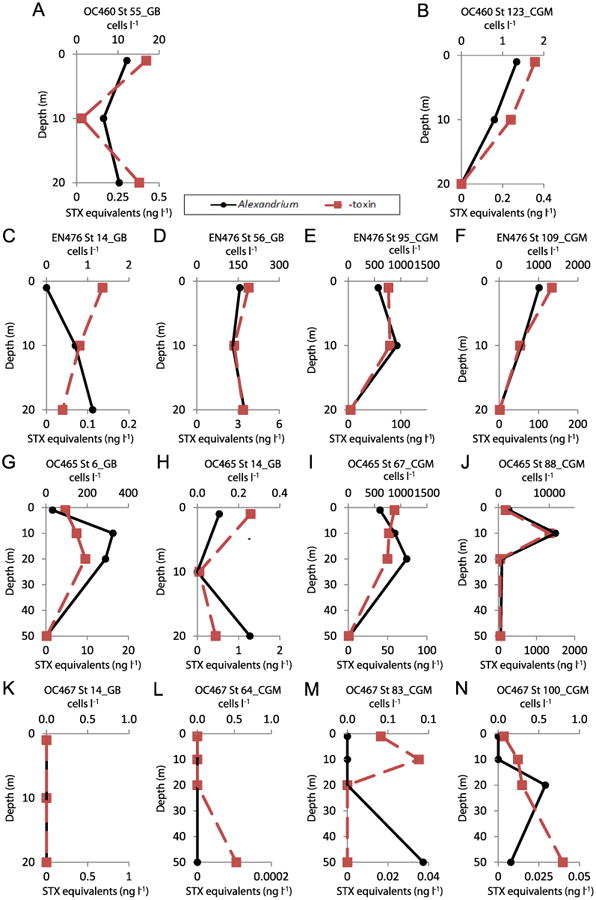
Depth distributions of PSP saxitoxin (STX) equivalent concentrations (ng l−1) (■-dashed line) on the primary horizontal axis and A. fundyese abundance (cells l−1) (●-solid line) on the secondary horizontal axis for the 20–64 μm size fraction of stations sampled during the 2010 bloom season on the coastal Gulf of Maine (CGM) and Georges Bank (GB) during cruises OC460 (1–10 May 2010), EN476 (26 May–4 June 2010), OC465 (30 June–8 July 2010), and OC467 (29 July–6 August 2010).
In 2010, patterns were different from those in 2007 and 2008. A. fundyense cells and PSP toxins were present throughout the water column at most stations on the first three cruises in May, June, and late June-early July (Fig. 4), with a maximum cell density of 11,205 cells l−1. However, during the last cruise in late July-early August of 2010 (Cruise OC467), most stations had no A. fundyense cells but occasionally PSP toxins were found in various size fractions. During this cruise, low levels of both cells and toxins were found at only a single station (Station 100) at depths of 20 and 50 m (Fig. 4N).
During all three years, PSP toxins were found in various size fractions. For the 20–64 μm size fractions, there was a significant relationship between concentrations of A. fundyense cells and PSP toxins in the CGM (r2=0.456, p < 0.001) and on GB (r2=0.744, p < 0.001)(Fig. 5). PSP toxins had highest concentrations in the 20– 64 μm size fractions, but lesser amounts of toxins were also recorded for the 64–100 μm size fractions (Deeds et al., this issue). Variable but much lower overall amounts of PSP toxins were found in larger size fractions (100–200, 200–500, >500 μm) (Deeds et al., this issue) in which particulates were dominated by metazoan zooplankton.
Fig. 5.

Linear regression of A. fundyense abundance (cells l−1) versus PSP saxitoxin (STX) equivalent concentrations (ng l−1) for 68 samples in the Coastal Gulf of Maine (CGM; gray circles with solid regression line) and 71 samples on Georges Bank (GB; black diamonds with dashed regression line). Data are log-transformed. The regression coefficients were highly significant (p < 0.001).
A. fundyense cells also had highest concentrations in the 20–64 μm size fractions, but much lower numbers of cells (∼2% of total cells) were also recorded in the 64–100 μm size fractions. Thus, there was a small amount of collection of A. fundyense cells (diameter approximately 40 μm) on 64 μm screens due to clogging by other plankton such as chain-forming diatoms.
Variability in ratios of toxin concentrations to A. fundyense abundances in the 20–64 μm size fractions for stations in the coastal Gulf of Maine and Georges Bank are shown in Fig. 6A. Both the Wilcoxon rank-sum test (p < 0.001) and Welch's two sample t-test with assumption of unequal variances (p < 0.001) were consistent, and indicated a highly significant difference between the CGM and GB toxin to A. fundyense cell ratios. A. fundyense populations sampled in the CGM had mean cell toxin quotas (mean ratio of toxin to A. fundyense abundance=0.076 ng cell−1) that were significantly higher than populations sampled on GB (mean=0.027 ng cell−1). Toxins contained in grazers could have inflated the toxin quota estimates; however, total grazer abundance in the 20–64 μm size fractions for samples from the CGM were not significantly different from those of GB (p=0.060). Though this difference in grazer abundance had a p-value that approached the threshold for significance, grazer abundance was lower in the CGM (617 individuals l−1) than on GB (865 individuals l−1). Thus, the estimated toxin quotas for populations sampled in the CGM were likely less influenced by inflation due to toxin in grazers than populations sampled on GB. The toxin to A. fundyense cell abundance ratios for the CGM and GB were most similar in 2008 (Fig. 6B), when there was a substantial regional-scale bloom.
Fig. 6.
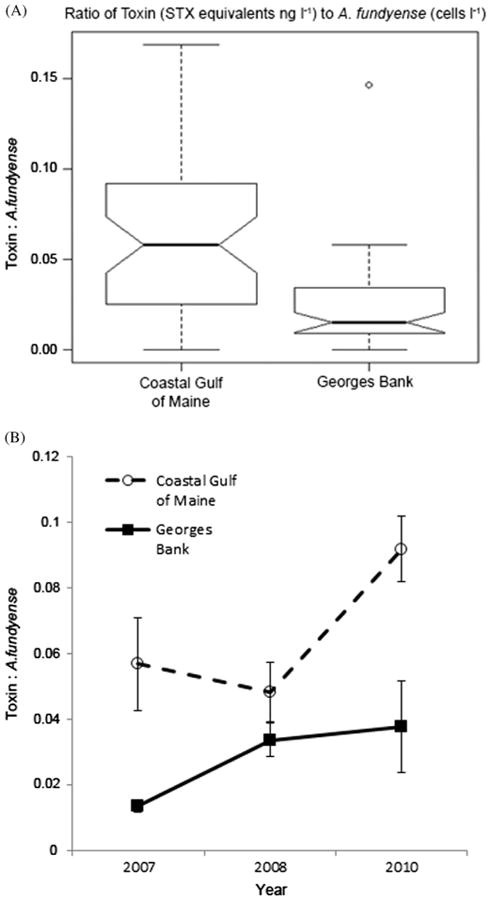
Ratios of PSP toxin concentration (STX equivalents ng l−1) to A. fundyese abundance (cells l−1). Box plot shows ratios of toxin concentration to A. fundyense abundance (pooled data from three bloom seasons) for samples from the coastal Gulf of Maine (CGM) and Georges Bank (GB) (A). Only samples containing ≥10 A. fundyense cells l−1 were included (n=45 for the CGM and n=53 for GB). Box plot indicates the median, 25th and 75th percentiles (interquartile range), 1.5 times the interquartile range (whiskers), and outliers. Mean ratio of toxin concentration to A. fundyense abundance for the bloom seasons of 2007 (n=10 for CGM and n=26 for GB), 2008 (n=22 for CGM and n=18 for GB), and 2010(n=13 for CGM and n=9 for GB) (B). Error bars indicate the standard error of the mean.
3.2. Grazer community composition and PSP toxin content in size fractions
Plankton composition in size fractions included diverse assemblages of potential A. fundyense grazers. Highest levels of diversity were observed in the largest size fraction (>500 μm), with lower diversity in smaller size fractions (Table 3), whereas grazer abundance was higher in smaller size fractions (see differences in horizontal axes scales Figs. 7–13). Total grazer abundance and copepod abundance in the coastal Gulf of Maine were not significantly different from those of Georges Bank (p=0.064 and p=0.228, respectively).
Table 3.
Potential grazers identified in each of the size fractionsa.
| 20–64 μm | 64–100 μm | 100–200 μm | 200–500 μm | >500 μm |
|---|---|---|---|---|
|
|
|
|
|
Not all taxa listed under a specific size fraction were found in every sample in that size fraction.
Fig. 7.
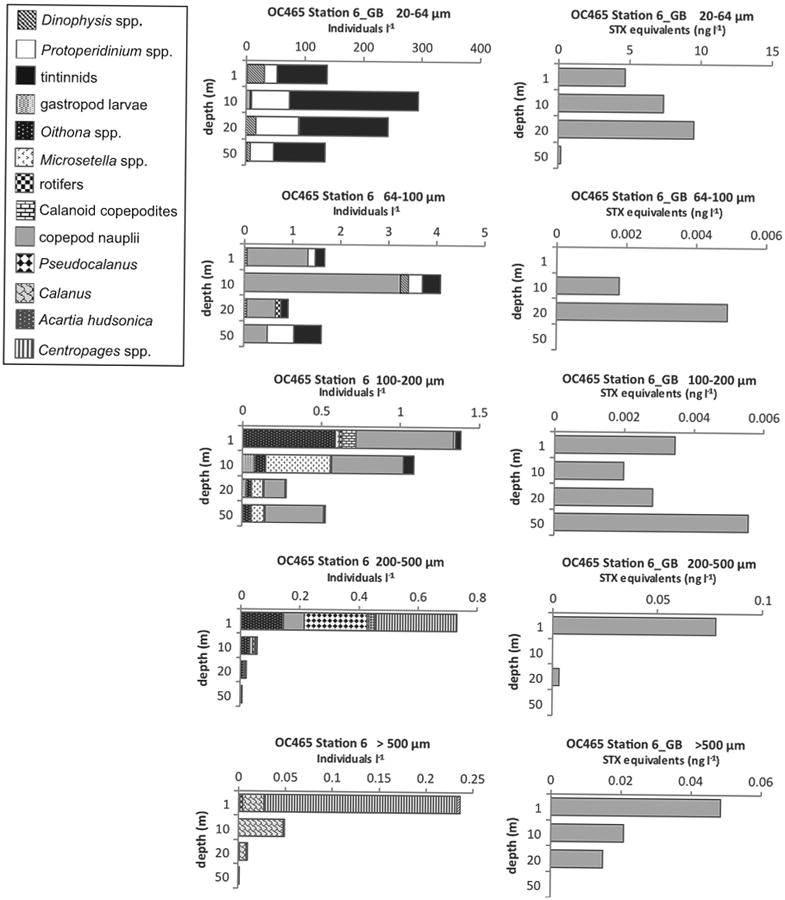
Depth distributions of A. fundyense grazer community composition and abundance (individuals l−1) in size fractions (left panel) and PSP toxin concentrations (STX equivalents ng l−1) contained in those size fractions (right panel) from Cruise OC465, station 6 on Georges Bank (GB).
Fig. 13.
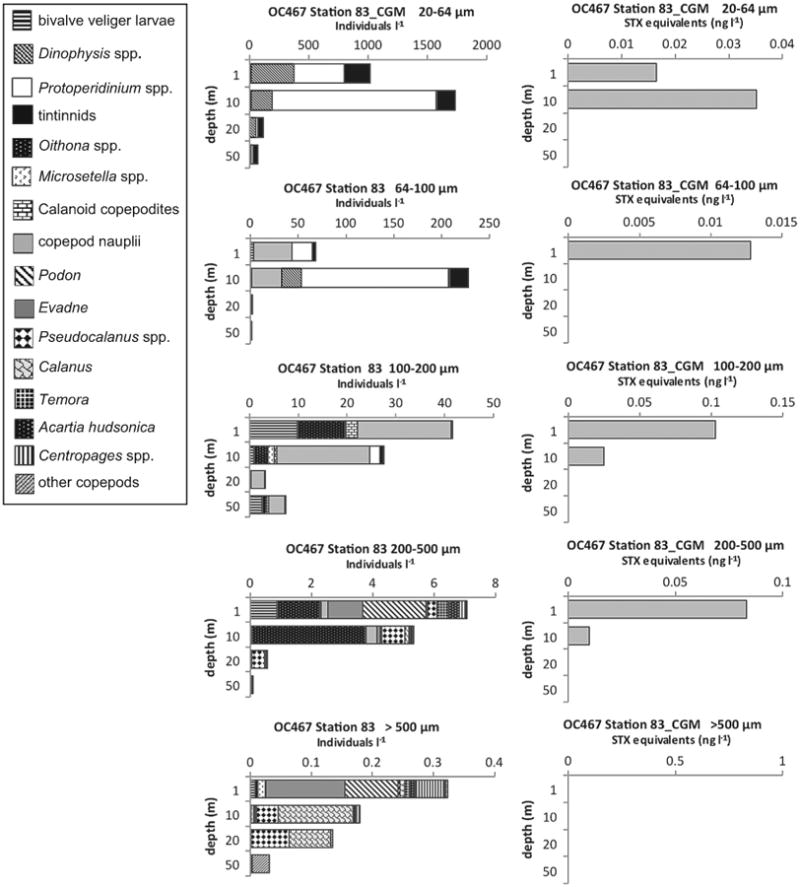
Depth distributions of A. fundyense grazer community composition and abundance (individuals l−1) in size fractions (left panel) and PSP toxin concentrations (STX equivalents ng l−1) contained in those size fractions (right panel) from Cruise OC467, station 83 in the coastal Gulf of Maine (CGM).
In addition to information regarding A. fundyense cell toxin content, the boxplot in Fig. 6A revealed insights into toxins contained in grazers in the 20–64 μm size fractions. Positive outliers (higher ratios) are indicative of toxin levels that cannot be explained by A. fundyense cell abundances or cell toxin quotas alone. Thus, outliers likely represent samples in which PSP toxins were contained in grazers, in addition to A. fundyense cells. The only outlier was for OC465 St. 6, 1 m (Figs. 6A and 7), on Georges Bank with a ratio of 0.15 saxitoxin (STX) equivalents (ng l−1) per A. fundyense cell. Potential grazers in this sample included tintinnids, Protoperidinium spp., and Dinophysis spp. However, greater variability observed in ratios higher than the median (Fig. 6A) is also suggestive of toxins in grazers, particularly for the CGM samples. Poulton et al. (2005) reported A. fundyense cell toxin quotas in natural populations off Casco Bay, Maine that ranged from 36 to 325 fmol STX equivalents cell−1. The 325 fmol cell−1 maximum reported by these investigators is approximately equivalent to 0.12 ng STX equivalents cell−1. Using 0.14 ng STX equivalents cell−1 as a conservative threshold that is outside the envelope of previously-reported toxin quotas for natural A. fundyense populations in CGM, we found two 20–64 μm size fraction samples (ratios of 0.14 and 0.17) that likely had toxins contained in grazers. These were for the following cruises, stations, and depths: OC447 St. 9, 20 m and EN476 St. 95, 20 m (grazer composition data not shown). Both of these samples almost exclusively contained tintinnids and heterotrophic dinoflagellates. Thus, toxin levels recorded for these samples may have been from toxins in grazers of A. fundyense, particularly tintinnids and heterotrophic dinoflagellates of the genera Protoperidinium and Dinophysis.
PSP toxins were found in most other samples in various size fractions from most other stations and depths. These size fractions mostly contained no A. fundyense cells, and were dominated by various protistan and metazoan grazers. Although some larger size fraction samples contained toxin levels which approached or exceeded those in the 20–64 μm size fraction at the same station (e.g., EN435 Station 172, EN437 Station 108, and OC447 Station 103), PSP toxin levels generally decreased (often by an order-of-magnitude) with increasing size fraction. Most samples that contained PSP toxins had a diverse composition of potential grazers, but some samples that were dominated by one or a few taxa of potential grazers identified certain grazers as likely toxin vectors. Selected example plots from some of these stations will be presented below.
Two stations clearly indicated PSP toxins in the 64–100 μm size fraction that can be attributed to toxins in microzooplankton. At EN448 Station 22 on Georges Bank, there were no A. fundyense in the 64–100 μm size fraction at any of the depths sampled, so the PSP toxins recorded for that size fraction must have been contained in tintinnids, copepod nauplii, rotifers, Protoperidinium spp., and/or Dinophysis spp. (data not shown). A. fundyense approximated 700–1200 cells l−1 at EN435 Station 172 (Fig. 2F), also on Georges Bank, and A. fundyense cells were observed in the 64–100 μm size fraction (<2 cells l−1). However, the toxins measured at 1 and 20 m in this size fraction approached the toxin levels in the 20–64 μm size fraction (Fig. 8), where A. fundyense abundance was several orders-of-magnitude higher. This strongly suggests that toxins contained in microzooplankton grazers substantially contributed to total toxin levels measured at this station. Protoperidinium spp. overwhelmingly dominated the plankton community in the 64–100 μm size fraction at all three sampled depths at this station (Fig. 8).
Fig. 8.
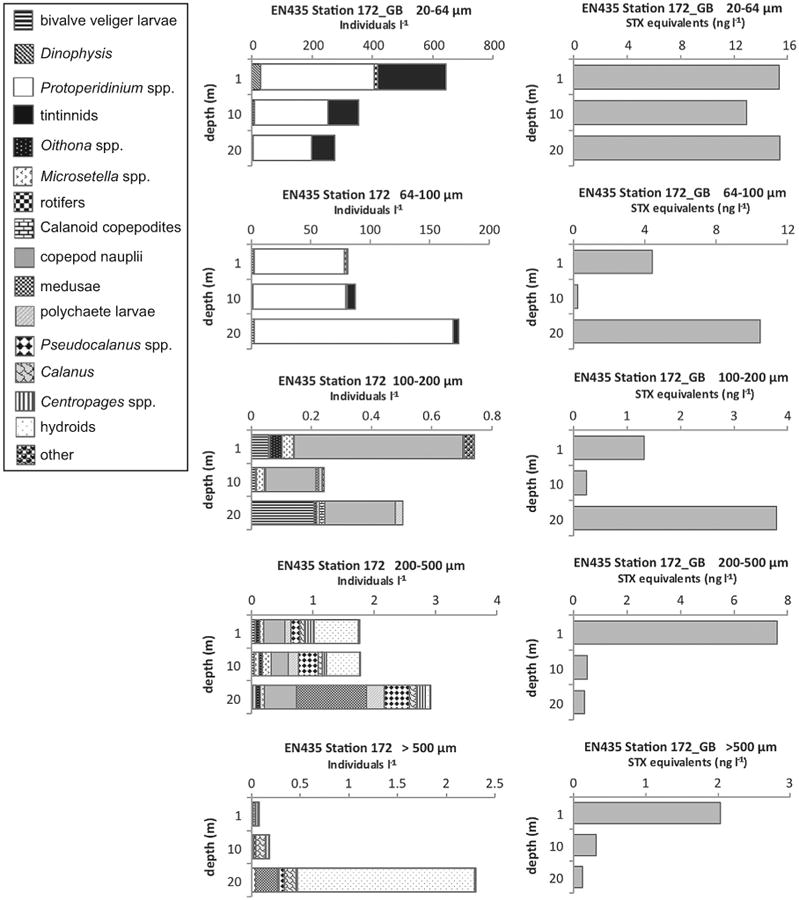
Depth distributions of A. fundyense grazer community composition and abundance (individuals l−1) in size fractions (left panel) and PSP toxin concentrations (STX equivalents ng l−1) contained in those size fractions (right panel) from Cruise EN435, station 172 on Georges Bank(GB).
Levels of PSP toxins in >100 μm size fractions indicated vectorial intoxication of metazoan zooplankton grazers, particularly copepods. At EN435 Station 135 in the 200–500 μm size fraction (data not shown), and at EN437 Station 31 in the >500 μm size fraction (Fig. 9), both on Georges Bank, the low-level presence of toxins at 1 m and 10 m when there was nothing in the samples but the harpacticoid copepod Microsetella norvegica, strongly suggests that the observed toxin levels came from this copepod. At EN435 Station 77 and EN435 Station 116 (data not shown) in the coastal Gulf of Maine in the >500 μm size fractions, there were PSP toxins recorded down to 20–25 m, when this size fraction contained almost nothing but adults and copepodites of the copepod Calanus finmarchicus. At OC465 Station 67 in the coastal Gulf of Maine in the >500 μm size fractions (Fig. 10), there were low levels of PSP toxins recorded throughout the water column down to 50 m, where these size fractions were exclusively composed of depth-stratified populations of C. finmarchicus at 10 m, Pseudocalanus spp. at 20 m, and the marine cladoceran Evadne nordmanni at 50 m.
Fig. 9.
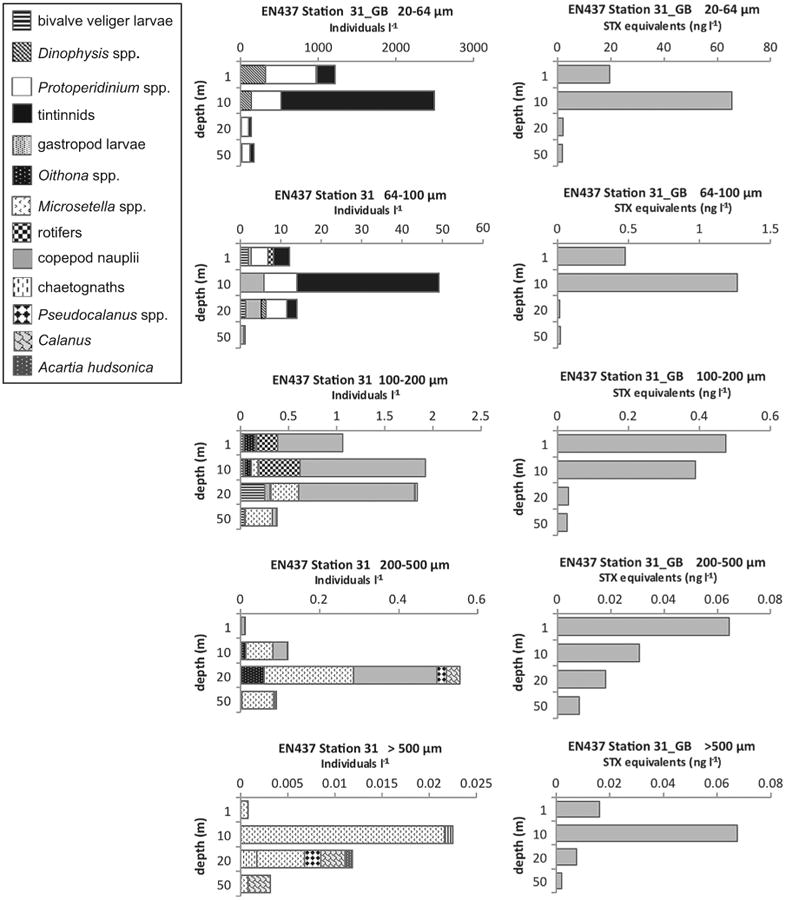
Depth distributions of A. fundyense grazer community composition and abundance (individuals l−1) in size fractions (left panel) and PSP toxin concentrations (STX equivalents ng l−1) contained in those size fractions (right panel) from Cruise EN437, station 31 on Georges Bank (GB).
Fig. 10.
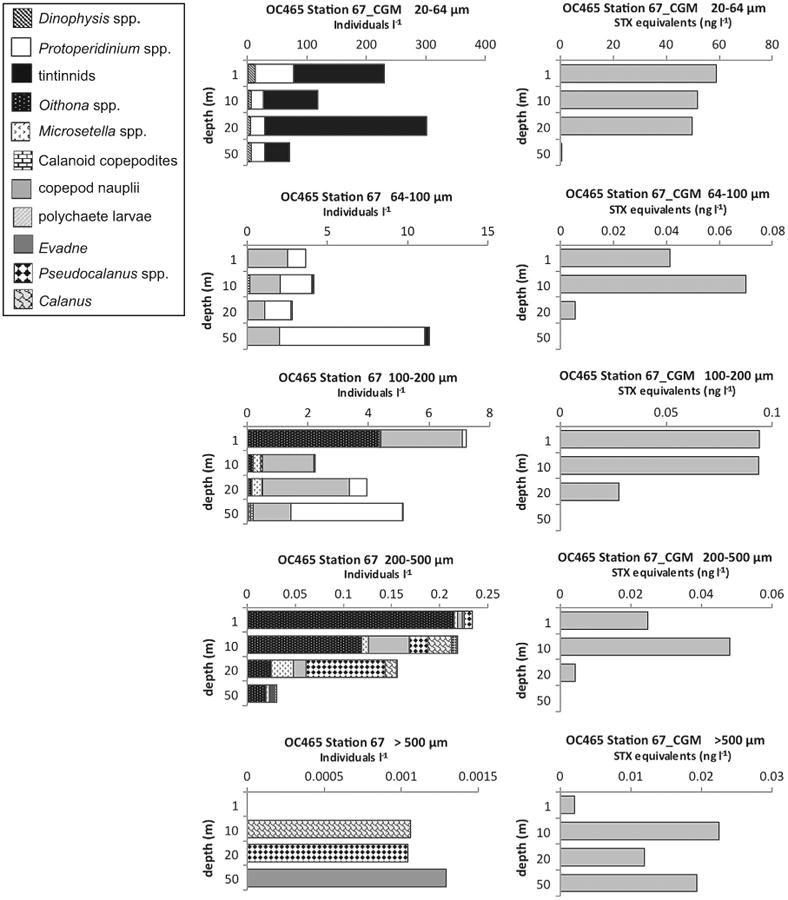
Depth distributions of A. fundyense grazer community composition and abundance (individuals l−1) in size fractions (left panel) and PSP toxin concentrations (STX equivalents ng l−1) contained in those size fractions (right panel) from Cruise OC465, station 67 in the coastal Gulf of Maine (CGM).
PSP toxins were also found associated with other non-copepod metazoan zooplankton. At OC445 Station 64 in the coastal Gulf of Maine (Fig. 11) there were toxins at 1 and 10 m in the >500 μm size fractions that were dominated by, or exclusively composed of barnacle nauplii. At EN435 Station 154 (Fig. 12) and OC460 Station 55 (data not shown), both on Georges Bank, there were detectable PSP toxins throughout the water column down to 20 m in the >500 μm size fractions that were almost exclusively composed of hydroids of the genus Clytia. Hydroid maxima were at 20 m, with hydroid abundance progressively decreasing toward the surface, whereas PSP toxin levels exhibited the reverse pattern at EN435 Station 154 (Fig. 12). At OC460 Station 55 the toxin maximum coincided with the depth of the hydroid maximum. Finally, in August 2010 at OC467 Stations 64 (not shown) and 83 (Fig. 13) in the coastal Gulf of Maine, there were low levels of PSP toxins present in the water column in almost all size fractions despite a near complete absence of A. fundyense cells in the water column (Fig. 4L and M).
Fig. 11.
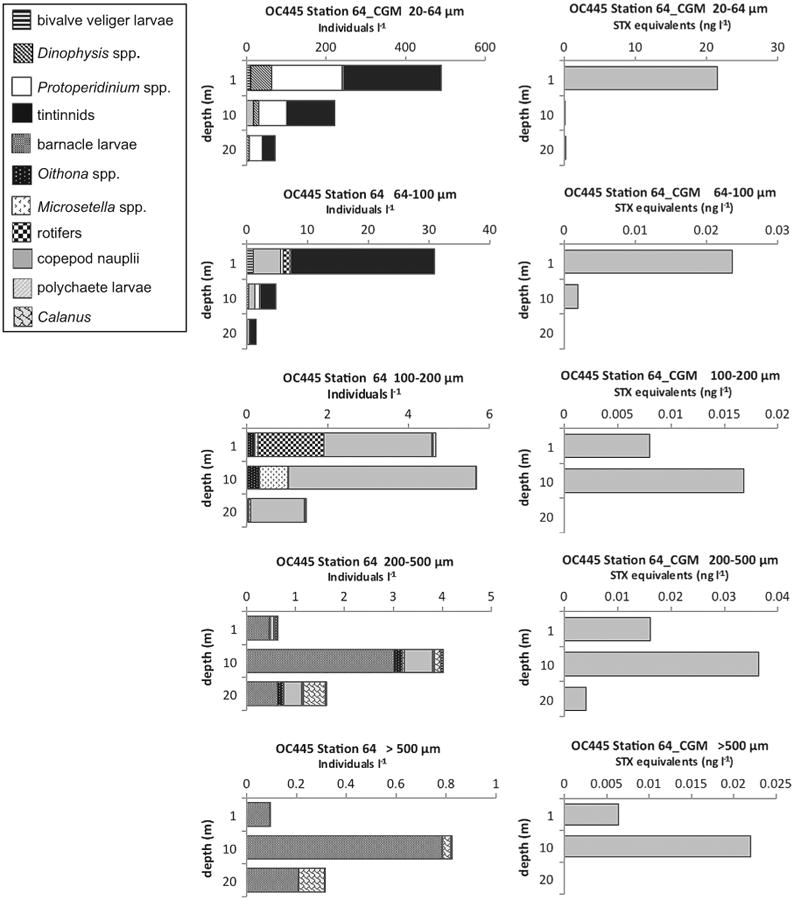
Depth distributions of A. fundyense grazer community composition and abundance (individuals l−1) in size fractions (left panel) and PSP toxin concentrations (STX equivalents ng l−1) contained in those size fractions (right panel) from Cruise OC445, station 64 in the coastal Gulf of Maine (CGM).
Fig. 12.
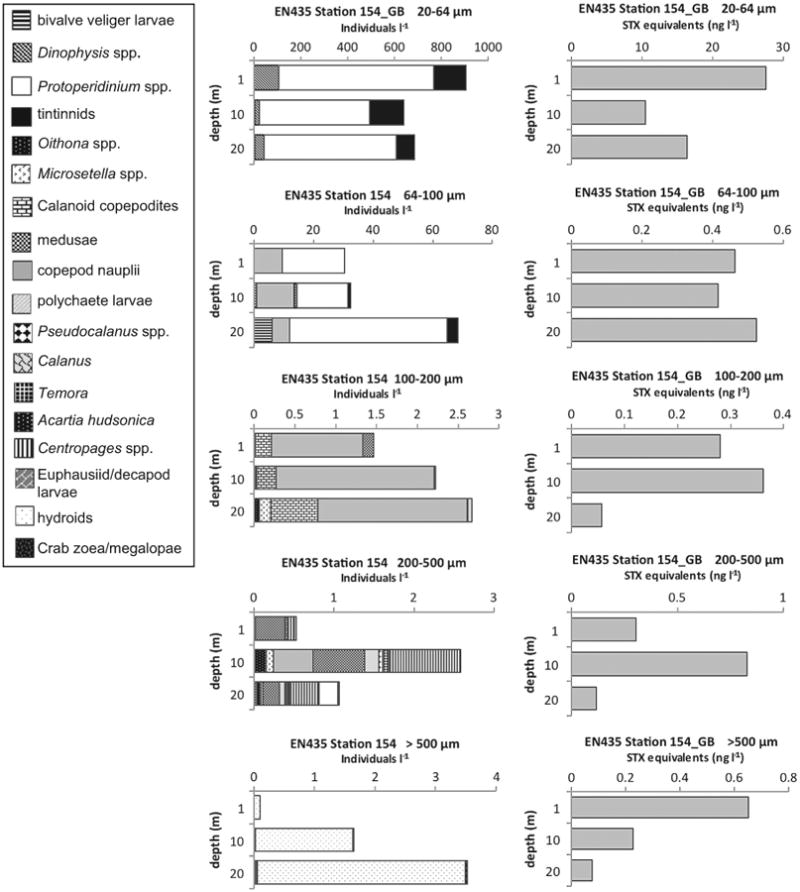
Depth distributions of A. fundyense grazer community composition and abundance (individuals l−1) in size fractions (left panel) and PSP toxin concentrations (STX equivalents ng l−1) contained in those size fractions (right panel) from Cruise EN435, station 154 on Georges Bank (GB).
PSP toxins were present in only one set of the microscopically-sorted zooplankton and fecal pellet samples. No toxin was measured in C. finmarchicus or Centropages typicus samples, or the fecal pellets from those samples. However, toxin was measured in all the E. nordmanni (mean=3.36 ng STX equivalents animal−1) and fecal pellet (mean=0.338 ng STX equivalents fecal pellet−1) replicates from the OC465 coastal Gulf of Maine station (Table 2).
Table 2.
Station, location, description of sample replicates, Alexandrium fundyense abundance (live count), and mean replicate toxin measurements for microscopically-sorted toxin samples.
| Cruise | Location | Samples | A. fundyense live count (cells l−1) | Toxin (ng STX equivalents) |
|---|---|---|---|---|
| OC460 | CGM | 3 Replicates of 10 Calanus finmarchicus | <1 | 0 |
| 3 Replicates of 100 fecal pellets | 0 | |||
| OC460 | CGM | 2 Replicates of 20 Calanus finmarchicus | 38 | 0 |
| 2 Replicates of 100 fecal pellets | 0 | |||
| EN476 | GB | 3 Replicates of 10 Calanus finmarchicus | 125 | 0 |
| 1 Replicate of 50 fecal pellets | 0 | |||
| OC465 | GB | 3 Replicates of 10 Centropages typicus | 238 | 0 |
| OC465 | CGM | 3 Replicates of 30 Evadne nordmanni | 17 | 3.36 animal−1 |
| 2 Replicates of 80 fecal pellets | 0.338 fecal pellet−1 |
4. Discussion and conclusions
4.1. Alexandrium fundyense and toxin in size fractions
Alexandrium fundyense cells were broadly distributed throughout the sampled water column, down to 50 m. Sampling methods employed in the present study allowed for the detection of deep populations of A. fundyense cells in the coastal Gulf of Maine and Georges Bank, and at many stations vertical distributions of A. fundyense displayed subsurface abundance maxima. Few studies have quantitatively sampled A. fundyense at depths greater than 20 m. Other studies that have reported on deep populations of A. fundyense found that such subsurface concentrations corresponded with the pycnocline and nutricline (Townsend et al., 2001, 2005a, 2005b).
Toxin content of A. fundyense cells is highly variable and can be affected by several environental parameters including irradiance, temperature, salinity, and the availability of nutrients (Anderson et al., 1990; Poulton et al., 2005; Etheridge and Roesler, 2005). It has also been reported that cellular toxicity from different species of Alexandrium can increase in response to chemical cues from copepod grazers (Selander et al., 2006, 2012; Wohlrab et al., 2010). Most studies that report toxin quotas in natural A. fundyense populations (Doucette et al., 2005; Haya et al., 2003; Poulton et al., 2005) determined cell toxin content by attributing all the toxin measured within 20–64 μm size-fractionated samples to A. fundyense . However, toxin concentrations in 20–64 μm size-fractionated samples could also be contained in microzooplankton and heterotrophic dinoflagellate grazers of A. fundyense, as well as in suspended fecal pellets (which were frequently observed in this study; data not shown). Thus, for an accurate assessment of A. fundyense cell toxin quota in natural populations it is necessary to separate the toxic algae from potential grazers before toxin determination. The mean ratio of PSP toxin to A. fundyense cell abundance presented here for the coastal Gulf of Maine (0.076 ng STX equivalents cell−1) and Georges Bank (0.027 ng STX equivalents cell−1) are likely overestimates of A. fundyense cellular toxicity due to PSP toxins contained in grazers and fecal pellets.
Conversely, counting error associated with co-occurring and nearly morphologically-identical Alexandrium ostenfeldii, which is not known to produce PSP toxins in the Gulf of Maine region (Gribble et al., 2005), could lead to underestimates of cellular toxicity. Although A. ostenfeldii cells were observed in some of our samples, this likely did not represent a major source of counting error for A. fundyense abundance. The only way to discriminate A. ostenfeldii from A. fundyense using light microscopy without the aid of molecular probes is when there are food vacuoles present in the mixotrophic A. ostenfeldii. Gribble et al. (2005) reported that up to > 80% of A. ostenfeldii in the Gulf of Maine region contained food vacuoles. Cells containing food vacuoles were not included in our counts of A. fundyense. Thus, samples that did not contain Alexandrium cells with food vacuoles (most samples) likely did not contain A. ostenfeldii in substantial abundance and were minimally impacted by error in A. fundyense misidentification.
While the accuracy of A. fundyense cellular toxicity may be questioned due to misidentification or grazers in the 20–64 μm size fraction, the finding of a significant difference in cellular toxicity between the CGB and GB A. fundyense populations is likely substantive. In order to assess whether the issue of A. ostenfeldii misidentification may be differentially impacting the CGM and GB A. fundyense counts, we examined the ratios of live counts to counts done on samples collected at the same station but processed with molecular probes capable of discriminating between the two species (data not shown; Anderson et al., 2005b). We found no significant difference between ratios in the two regions. Additionally, since total grazer abundance in the 20–64 μm size fraction was not significantly different for the CGM and GB, it is reasonable to assume that both A. fundyense populations were subject to similar grazing pressures and possibly elevated toxin cell quota estimates due to toxin levels in grazers. Further, the observed higher toxicity in the CGM relative to GB was likely not a consequence of grazer-induced increases in cellular toxicity, since neither copepod abundance nor total grazer abundance across all size fractions were significantly different for the CGM and GB.
Several studies have examined Alexandrium cellular toxicity as a function of ambient nutrient concentrations (Anderson et al., 1990; Levasseur et al., 1995; Poulton et al., 2005). Phosphate-limited nutrient conditions and growth using ammonium as inorganic nitrogen have been associated with increases in A. fundyense toxin content, whereas nitrate limitation has been shown to decrease toxin content. Nitrate concentrations were lower for stations sampled on GB than those in the CGM, but phosphate levels were also lower on GB and A. fundyense on GB appeared to utilize elevated ammonium levels as the primary inorganic nitrogenous nutrient (Gettings et al., this issue; McGillicuddy et al., this issue). While the lower toxicity in A. fundyense populations on GB compared to CGM populations is consistent with the observed lower nitrate concentrations on GB, the cellular toxicity patterns are the opposite of what would be expected for growth with ammonium as the primary source of inorganic nitrogen. Many other environmental factors could have potentially contributed to toxicity differences between the CGM and GB A. fundyense populations (e.g., irradiance, micronutrient limitation).
Another explanation for the observed differences in A. fundyense toxicity between the CGM and GB populations may be that A. fundyense cells in these regions represent different populations as suggested in McGillicuddy et al. (this issue). Etheridge and Roesler (2005) reported isolate-specific Gulf of Maine A. fundyense toxicity responses to environmental conditions. The observed differences in cellular toxin equivalency in the present study coincided with differences in toxin profiles (Deeds et al., this issue), which suggest that the differences in estimated toxin quota between the CGM and GB populations may be due to genetic differences. This assertion is further supported by comparisons of microsatellite markers between various subpopulations of A. fundyense in the Gulf of Maine, which suggest that the GB population is genetically distinct from populations in other regions in the Gulf of Maine (M. Richlen, personal communication).
4.2. Grazer community composition and PSP toxin content in size fractions
Most samples containing PSP toxins in this study had diverse assemblages of grazers. While diversity within size fractions increased from the smallest to largest size fractions (Table 3), grazer abundance decreased with increasing size fraction. Consistent with findings of previous studies of PSP toxins in size-fractionated plankton samples (Doucette et al., 2005; Turner et al., 2000, 2005), the majority of PSP toxins were found in the smallest size fraction (20–64 μm), which contained the causative A. fundyense cells. However, those previous studies reported contrasting results for toxins in the remaining larger size fractions. The findings of this study were consistent with those of Turner et al. (2005) and Doucette et al. (2005), which reported toxins widely distributed in all size fractions, but differed from the Turner et al. (2000) study which reported the highest levels of PSP toxins disproportionately contained in the largest size fraction (>500 μm). The findings of the present study differed from those of Turner et al. (2000) in that PSP toxin levels progressively decreased from the smallest to the largest size fraction, with the >500 μm size fraction containing the lowest concentrations of PSP toxins. Unfortunately, beyond comparisons of relative patterns of toxicity among size fractions, it is difficult to further compare the findings of the present study with those of previous studies because the lack of quantitative sampling in previous studies precludes direct comparisons of overall levels of toxicity.
There may be several factors contributing to the observed differences between studies in toxin accumulation in larger size fractions. First, overall bloom severity was greater during the present study than during the previous studies. A. fundyense cell concentrations had maximum levels of 50 cells l−1 in Turner et al. (2000) and 768 cells l−1 in Turner et al. (2005), whereas in the present study at numerous stations in all three years there were levels of A. fundyense >1,000 cells l−1. Also, previous studies sampled along pre-determined transects while the present study targeted stations region-wide with high cell concentrations, and therefore our data are biased toward patches with high toxicity and high A. fundyense cell concentrations.
On July 6, 2010 during Cruise OC465 at Station 88, we recorded the highest abundance of A. fundyense cells, as well as the highest toxicity, for all stations during all three years of cruises. There were over 11,000 cells l−1 at 10 m in the 20–64 μm size fraction (Fig. 4J). These data alone might indicate that a severe A. fundyense bloom occurred in the Gulf of Maine region in the year 2010. Indeed, a large regional A. fundyense bloom was predicted for 2010 based on the abundance of benthic cysts in the preceding fall, which was considered a first-order predictor of bloom magnitude the following spring/summer (McGillicuddy et al., 2011). However, this station was sampled during the year that was considered anomalous, because despite the largest recorded source population of benthic resting cysts in the fall of 2009 the 2010 A. fundyense bloom in the Gulf of Maine was not severe in regional extent or impact (McGillicuddy et al., 2011). Also, it is noteworthy that in August 2010 at OC467 Stations 64 and 83 (Fig. 13) low levels of PSP toxins persisted throughout the water column in most zooplank-ton size fractions despite an almost complete absence of A. fundyense cells in the water column (Fig. 4L and M). Thus, if PSP toxins persist in zooplankton grazers for prolonged periods after A. fundyense cells are no longer present, then monitoring for PSP toxins by only counting A. fundyense cells may be inadequate.
One possible explanation for higher toxin levels in the >500 μm size fraction during low A. fundyense abundance is concentration-dependent feeding behavior of the copepods contained in this size fraction. Calanoid copepods such as Acartia hudsonica, Eurytemora herdmani, and Centropages hamatus (found in various >500 μm size fractions in the present study) have been reported to exhibit positive feeding selection for A. fundyense at low concentrations and decreased selection, or avoidance, of A. fundyense at high algal concentrations (Teegarden et al., 2003).
Due to the level of taxonomic diversity of potential grazers in most size-fractionated samples it was usually not clear which of the grazers were contributing to measured toxin levels. This warrants further investigation of our data utilizing multivariate statistical applications to determine which components of the grazer community within size fractions were likely contributing to toxin variability. However, several samples exhibited low diversity with only one or a few taxa potentially contributing to measured toxin levels.
The apparent high variability in A. fundyense cell toxin quotas is a confounding factor for studies attempting to assess the toxin contained in microzooplankton and heterotrophic dinoflagellates like Protoperidinium and Dinophysis. These grazers, which do not produce PSP toxins, occur within the same size fraction as A. fundyense. Thus the presence of ingested PSP toxins in microzooplankton and heterotrophic dinoflagellates cannot be accurately measured without microscopically sorting and determining the toxin content of the individual components of the plankton community in the 20–64 μm size fraction.
Although the feeding ecology of heterotrophic dinoflagellates of the genus Dinophysis is not well characterized, these dinoflagellates were counted as potential PSP toxin vectors. There have been observations of Dinophysis spp. that contained complete cells of dinoflagellates of the genus Scrippsiella (Reguera et al., 2012 and references therein). This suggests that Dinophysis spp. have the potential to directly graze upon A. fundyense, since Scrippsiella cells are of similar size and shape to those of Alexandrium. Also, Dinophysis spp. may be higher-trophic-level vectors of PSP toxins through consumption of contaminated ciliate prey. However, trials to feed starving Dinophysis sp. cells with cultured Scrippsiella sp. have been unsuccessful (Reguera et al., 2012 and references therein), and laboratory cultures of Dinophysis sp. have been successful only when fed the marine ciliate Myrionecta rubra as prey (Park et al., 2006). Because of these uncertainties, we believe that PSP toxins in grazers in the 20–64 μm size fractions are likely contained in tintinnids and Protoperidinium spp., but probably not in Dinophysis spp.
The findings of the present study clearly suggest PSP toxin accumulation in several different mesozooplankton grazers: tintinnids, barnacle nauplii, the harpacticoid copepod M. norvegica, calanoid copepods C. finmarchicus and Pseudocalanus spp., the marine cladoceran E. nordmanni, and hydroids of the genus Clytia. In the case of E. nordmanni, we found substantial levels, 3.36 ng of PSP toxin equivalents animal−1. A. fundyense can cause shellfish contamination at abundances as low as 200 cells l−1. Using a toxin quota of 0.14 ng STX equivalents cell−1 (high compared to average cell toxin quotas estimated in this study), 8 Evadne individuals would contain an equivalent amount of toxin to 200 A. fundyense cells. It is curious that these cladocerans exhibited such high toxin accumulation when the ambient A. fundyense cell concentration was only 17 cells l−1, whereas the copepods C. finmarchicus and C. typicus did not accumulate detectable levels of PSP toxin at 125 and 238 cells l−1, respectively. It could be that E. nordmanni exerts substantial grazing impact on A. fundyense with relatively high toxin retention efficiency, and that the low ambient A. fundyense concentration observed was a result of this grazing pressure. Moreover, several copepod taxa, including Centropages spp., are reported to be inefficient in retaining ingested PSP toxins (Teegarden et al., 2003). Further, in the same sample as the toxin-accumulating E. nordmanni, measurable concentrations of PSP toxins were found packaged in fecal pellets.
Sinking fecal pellets and meroplankton could be important factors in linking PSP toxin transport from pelagic to benthic food chains. Fecal pellets produced by zooplankton grazing in the water column can sink rapidly to depth (Turner, 2002). Meroplankton, such as barnacle nauplii and cyprid larvae, could also represent an important trophic linkage between pelagic and benthic food chains. Results from the present study suggest that barnacle nauplii are capable of accumulating PSP toxins, and therefore have the potential to introduce toxicity to benthic food chains when they eventually fall out of the water column and transition to sessile benthic adults.
Planktonic hydroid polyps of the genus Clytia spp. were first observed in high abundance on Georges Bank during the Global Ocean Ecosystem Dynamics (GLOBEC) research project (Madin et al., 1996). These hydroids, which are typically attached to benthic substrate during their polyp stage, have been found to function as truly planktonic predators when they are extracted from benthic substrates and turbulent mixing allows them to persist in the water column (Bollens et al., 2001). Turbulence velocities required for the continual suspension of hydroids (maximum sinking rate=0.3 cm s−1) occur near-bottom in the central, shallow, well-mixed region of GB 100% of the time, but such turbulence reaches into the upper water column only every 6 h, on maximum tidal current speeds, and during storms (Bollens et al., 2001 and references therein). The periodic sinking and tidal mixing of hydroids, shown here associated with high levels of PSP toxins, could be an important factor in the vertical flux of toxin in the pelagic food web, especially since these hydroids are known to be consumed by a wide variety of commercially-important fish species (Avent et al., 2001).
In summary, trophic transport of PSP toxins throughout marine food webs can be influenced by several factors including A. fundyense cell abundance and cellular toxicity (toxin quota), but also grazer community composition. PSP toxins were widespread throughout all size classes of the zooplankton grazing community. Our data suggest that microzooplankton such as tintinnids can likely serve as initial vectors of PSP toxins to higher trophic levels, and suggest that heterotrophic dinoflagellates such as Protoperidinium spp. may be toxin vectors as well. Other zooplankton were also associated with detectable levels of PSP toxins, and hence are possible toxin vectors in pelagic, and perhaps even benthic food webs. Included are barnacle nauplii, the harpacticoid copepod M. norvegica, the calanoid copepods C. finmarchicus and Pseudocalanus spp., the marine cladoceran Evadne nordmanni, and hydroids of the genus Clytia. Thus, a diverse assemblage of zooplankton grazers could accumulate PSP toxins through food-web interactions. This raises the question of whether PSP toxins pose a potential human health risk not only from nearshore bivalve shellfish, but also potentially from fish and other upper-level consumers in zooplankton-based pelagic food webs.
Acknowledgments
We are very grateful for the outstanding efforts of the officers, crews, and shore support of R/V Oceanus, R/V Endeavor, and R/V Tioga, as well as the hard work of all those who participated in the seagoing science teams. Thanks also to Edward Durbin and Peter Wiebe for the loan of the plankton pumping systems. Research support was provided by National Oceanic and Atmospheric Administration grant NA06NOS4780245 for the Gulf of Maine Toxicity (GOMTOX) program. BAK, DJM, and DMA were partially supported by the Woods Hole Center for Oceans and Human Health through National Science Foundation grants OCE-0430724 and OCE-0911031 and National Institute of Environmental Health Sciences grant 1P50-ES01274201.
Footnotes
Gulf of Maine TOXicity (GOMTOX) http://www.whoi.edu/gomtox/.
Both A. tamarense and A. fundyense occur in the Gulf of Maine and are considered to be varieties of the same species (Anderson et al., 1994; Scholin et al., 1995). Detailed analysis of the thecal plates on individual cells is the only way to discriminate between the two morphospecies (Anderson et al., 1994). This is not practical for large numbers of field samples. Additionally, it is difficult to discriminate the potentially co-occurring A. ostenfeldii from the PSP toxin-producing congeners without the aid of molecular probes (Anderson et al., 2005b). However, for reasons discussed herein (Part 2), we believe that A. fundyense count data in the present study were minimally-impacted by error associated with Alexandrium species misidentification. Therefore, A. fundyense will be used throughout this communication when referring to Alexandrium cells enumerated in the present study.
References
- Anderson DM, Kulis DM, Sullivan JJ, Hall S. Toxin composition variations in one isolate of the dinoflagellate Alexandrium fundyense. Toxicon. 1990;28:885–893. doi: 10.1016/0041-0101(90)90018-3. [DOI] [PubMed] [Google Scholar]
- Anderson DM, Kulis DM, Doucette GJ, Gallagher JC, Balech E. Biogeography of toxic dinoflagellates in the genus Alexandrium from the northeastern United Statesand Canada. Mar Biol. 1994;120:467–478. [Google Scholar]
- Anderson DM, White AW. Marine biotoxins at the top of the food chain. Oceanus. 1992;35:55–61. [Google Scholar]
- Anderson DM, Townsend DW, McGillicuddy DJ Jr, Turner JT, editors. Deep-Sea Res, II. 2005a;52:2365–2876. 2005a. [Google Scholar]
- Anderson DM, Kulis DM, Keafer BA, Gribble KE, Marin R, Scholin CA. Identification and enumeration of Alexandrium spp. from the Gulf of Maine using molecular probes. Deep-Sea Res II. 2005b;52:2467–2490. [Google Scholar]
- Avent SR, Bollens SM, Butler M, Horgan E, Rountree R. Planktonic hydroids on Georges Bank: ingestion and selection by predatory fishes. Deep-Sea Res II. 2001;48:673–684. [Google Scholar]
- Bollens SM, Horgan E, Concelman S, Madin LP, Gallager SM, Butler M. Planktonic hydroids on Georges Bank: effects of mixing and food supply on feeding and growth. Deep-Sea Res II. 2001;48:659–672. [Google Scholar]
- Deeds JR, Landsberg JH, Etheridge SM, Pitcher GC, Longan SW. Non-traditional vectors for paralytic shellfish poisoning. Mar Drugs. 2008;6:308–348. doi: 10.3390/md20080015. [DOI] [PMC free article] [PubMed] [Google Scholar]
- Deeds JR, Petitpas CM, Shue V, White KD, Keafer BA, McGillicuddy DJ, Jr, Milligan PJ, Anderson DM, Turner JT. Deep-Sea Res II. PSP toxin levels and plankton community composition and abundance in size-fractionated vertical profiles during spring/summer blooms of the toxic dinoflagellate Alexandrium fundyense in the Gulf of Maine and on Georges Bank, 2007, 2008, and 2010. 1. Toxin levels. this issue. [DOI] [PMC free article] [PubMed] [Google Scholar]
- Dell'Aversano C, Eaglesham GK, Quilliam MA. Analysis of cyanobacterial toxins by hydrophilic interaction liquid chromatography–mass spectrometry. J Chromatogr. 2004;1018:155–164. doi: 10.1016/j.chroma.2003.11.083. [DOI] [PubMed] [Google Scholar]
- Doucette GJ, Cembella AD, Martin JL, Michaud J, Cole TVN, Rolland RM. Paralytic shellfish poisoning (PSP) toxins in North Atlantic right whales Eubalaena glacialis and their zooplankton prey in the Bay of Fundy, Canada. Mar Ecol Prog Ser. 2006;306:303–313. [Google Scholar]
- Doucette GJ, Turner JT, Powell CL, Keafer BA, Anderson DM. ECOHAB-Gulf of Maine. Trophic accumulation of PSP toxins in zooplankton during Alexandrium fundyense blooms in Casco Bay, Gulf of Maine, April-June 1998. I. Toxin levels in A. fundyense and zooplankton size fractions. Deep-Sea Res II. 2005;52:2764–2783. [Google Scholar]
- Etheridge SM, Roesler C. Effects of temperature, irradiance, and salinity on photosynthesis, growth rates, total toxicity, and toxin composition for Alexandrium fundyense isolates from the Gulf of Maine and Bay of Fundy. Deep-Sea Res II. 2005;52:2491–2500. [Google Scholar]
- Gettings RM, Townsend DW, Thomas MA, Karp-Boss L. Dynamics of late spring and summer phytoplankton communities on Georges Bank, with emphasis on diatoms, Alexandrium spp., and other dinoflagellates. Deep-Sea Res II. doi: 10.1016/j.dsr2.xxxx.xx.xxx. this issue. [DOI] [Google Scholar]
- Gribble KE, Keafer BA, Quilliam M, Cembella AD, Kulis DM, Manahan A, Anderson DM. Distribution and toxicity of Alexandrium ostenfeldii (Dinophyceae) in the Gulf of Maine, USA. Deep-Sea Res II. 2005;52:2745–2763. [Google Scholar]
- Guillard RRL. Division rates. In: Stein JR, editor. Phycological Methods. Cambridge University Press; Cambridge: 1973. pp. 289–311. [Google Scholar]
- Haya K, Martin, Robinson SMC, Martin JD, Khots A. Does uptake of Alexandrium fundyense cysts contribute to the levels of PSP toxin found in the sea scallop, Placopecten magellanicus? Harmful Algae. 2003;2:75–81. [Google Scholar]
- Lefebvre KA, Bargu S, Kieckhefer T, Silver MW. From sanddabs to blue whales: the pervasiveness of domoic acid. Toxicon. 2002;40:971–977. doi: 10.1016/s0041-0101(02)00093-4. [DOI] [PubMed] [Google Scholar]
- Levasseur M, Gamache T, St-Pierre I, Michaud S. Does the cost of NO3- reduction affect the production of harmful compounds by Alexandrium excavatum?. Harmful Marine Algal Blooms; Proceedings of the Sixth International Conference on Toxic Marine Phytoplankton; October 1993; Nantes, France. Andover, England: Lavoisier, Paris and Intercept Ltd.; 1995. pp. 463–468. [Google Scholar]
- Madin LP, Bollens SM, Horgan E, Butler M, Runge J, Sullivan BK, Klein-MacPhee G, Durbin E, Durbin A, Van Keuren D, Plourde S, Bucklin A, Clarke M. Voracious planktonic hydroids: unexpected predatory impact on a coastal marine ecosystem. Deep-Sea Res II. 1996;43:1823–1829. [Google Scholar]
- McGillicuddy DJ, Jr, Townsend DW, He R, Keafer BA, Kleindinst JL, Li Y, Manning JP, Mountain DG, Thomas MA, Anderson DM. Suppression of the 2010 Alexandrium fundyense bloom by changes in physical, biological and chemical properties of the Gulf of Maine. Limnol Oceanogr. 2011;56:2411–2426. doi: 10.4319/lo.2011.56.6.2411. [DOI] [PMC free article] [PubMed] [Google Scholar]
- McGillicuddy DJ, Jr, Townsend DW, Keafer BA, Thomas MA, Anderson DM. Georges Bank: a leaky incubator of Alexandrium fundyense blooms. Deep-Sea Res II. doi: 10.1016/j.dsr2.2012.11.002. this issue [ http://dx.doi.org/10.1016/j.dsr2.2012.11.002] [DOI] [PMC free article] [PubMed]
- Park MG, Kim S, Kim HS, Myung G, Kang YG, Yih W. First successful culture of the marine dinoflagellate Dinophysis acuminata. Aquat Microb Ecol. 2006;45:101–106. [Google Scholar]
- Poulton NJ, Keafer BA, Anderson DM. Toxin variability in natural populations of Alexandrium fundyense in Casco Bay, Maine—evidence of nitrogen limitation. Deep-Sea Res II. 2005;52:2501–2521. [Google Scholar]
- R Development Core Team. R: A Language and Environment for Statistical Computing. R Foundation for Statistical Computing; Vienna, Austria: 2008. URL: ‹ http://www.R-project.org›. [Google Scholar]
- Reguera B, Velo-Suárez L, Raine R, Park MG. Harmful Dinophysis species: a review. Harmful Algae. 2012;14:87–106. [Google Scholar]
- Scholin CA, Hallegraeff GM, Anderson DM. Molecular evolution and global dispersal of toxic dinoflagellates of the Alexandrium tamarense (Dinophyceae) “species complex”. Phycologia. 1995;34:472–485. [Google Scholar]
- Selander E, Fagerberg T, Wohlrab S, Pavia H. Fight and flight in dinoflagellates? Kinetics of simultaneous grazer-induced responses in Alexandrium tamarense. Limnol Oceanogr. 2012;57:58–64. [Google Scholar]
- Selander E, Thor P, Toth G, Pavia H. Copepods induce paralytic shellfish toxin production in marine dinoflagellates. Proc R Soc B. 2006;273:1673–1680. doi: 10.1098/rspb.2006.3502. [DOI] [PMC free article] [PubMed] [Google Scholar]
- Teegarden GJ, Cembella AD, Capuano CL, Barron SH, Durbin EG. Phycotoxin accumulation in zooplankton feeding on Alexandrium fundyense— vector or sink? J Plankton Res. 2003;25:429–443. [Google Scholar]
- Townsend DW, Bennett SL, Thomas MA. Diel vertical distributions of the red tide dinoflagellate Alexandrium fundyense in the Gulf of Maine. Deep-Sea Res II. 2005a;52:2593–2602. [Google Scholar]
- Townsend DW, Pettigrew NR, Thomas AC. Offshore blooms of the red tide dinoflagellate Alexandrium sp., in the Gulf of Maine. Cont Shelf Res. 2001;21:347–369. [Google Scholar]
- Townsend DW, Pettigrew NR, Thomas AC. On the nature of Alexandrium fundyense blooms in the Gulf of Maine. Deep-Sea Res II. 2005b;52:2603–2630. [Google Scholar]
- Turner JT. Zooplankton fecal pellets, marine snow and sinking phytoplankton blooms. Aquat Microb Ecol. 2002;27:57–102. [Google Scholar]
- Turner JT. Harmful algae interactions with marine planktonic grazers. In: Granéli JT, Turner JT, editors. Ecology of Harmful Algae. Springer-Verlag; Berlin, Heidelberg: 2006. pp. 259–270. [Google Scholar]
- Turner JT. Zooplankton community grazing impact on a bloom of Alexandrium fundyense in the Gulf of Maine. Harmful Algae. 2010;9:578–589. doi: 10.1016/j.hal.2015.05.010. [DOI] [PMC free article] [PubMed] [Google Scholar]
- Turner JT, Tester PA. Toxic marine phytoplankton, zooplankton grazers and pelagic food webs. Limnol Oceanogr. 1997;42:1203–1214. [Google Scholar]
- Turner JT, Doucette GJ, Powell CL, Kulis DM, Keafer BA, Anderson DM. Acccumulation of red tide toxins in larger size fractions of zooplankton assemblages from Massachusetts Bay, USA. Mar Ecol Prog Ser. 2000;203:95–107. [Google Scholar]
- Turner JT, Doucette GJ, Keafer BA, Anderson DM. ECOHAB-Gulf of Maine. Trophic accumulation of PSP toxins in zooplankton during Alexandrium fundyense blooms in Casco Bay, Gulf of Maine, April–June 1998. II. Zooplankton abundance and size-fractionated community composition. Deep-Sea Res II. 2005;52:2784–2800. [Google Scholar]
- White AW. Dinoflagellate toxins as probable cause of an Atlantic herring (Clupea harengus harengus) kill, and pteropods as apparent vector. J Fish Res Board Can. 1977;34:2421–2424. [Google Scholar]
- White AW. Dinoflagellate toxins in phytoplankton and zooplankton fractions during a bloom of Gonyaulax excavata. In: Taylor DL, Seliger HH, editors. Toxic Dinoflagellate Blooms. Elsevier; Amsterdam: 1979. pp. 381–384. [Google Scholar]
- White AW. Recurrence of kills of Atlantic herring (Clupea hargneus harengus) caused by dinoflagellate toxins transferred through herbivorous zooplankton. Can J Fish Aquat Sci. 1980;37:2262–2265. [Google Scholar]
- White AW. Marine zooplankton can accumulate and retain dinoflagellate toxins and cause fish kills. Limnol Oceanogr. 1981;26:103–109. [Google Scholar]
- Wohlrab S, Iversen MH, John U. A molecular and co-evolutionary context for grazer induced toxin production in Alexandrium tamarense. PLoS One. 2010;5(11):e15039. doi: 10.1371/journal.pone.0015039. http://dx.doi.org/10.1371/journal.pone.0015039. [DOI] [PMC free article] [PubMed] [Google Scholar]