Abstract
Aim
To test the hypothesis that MRI can monitor intraportal vein (IPV) transcatheter delivery of clinically applicable heparin-protamine-ferumoxytol (HPF) nanocomplex-labeled natural killer (NK) cells to liver tumor.
Materials & methods
Liver tumor rat models underwent catheterization for IPV infusion of HPF-labeled NK cells (NK-92MI cell line). MRI measurements within tumor and adjacent liver tissues were compared pre- and post-NK cell infusion. Histology studies were used to identify NK cells in the target tumors.
Results
For first time, we demonstrated that MRI tracks HPF-labeled NK cells migration within liver following IPV delivery.
Conclusion
IPV transcatheter infusion permitted selective delivery of NK cells to liver tissues and MRI allowed tracking NK cell biodistributions within the tumors.
Keywords: liver tumor, MRI, natural killer cell, portal vein, rat, transcatheter delivery
Due to an innate ability to recognize and lyse tumor cells, natural killer (NK) cells have been utilized clinically in several immuno-therapeutic strategies for the treatment of cancer [1]. Adoptive transfer immunotherapy (ATI) with NK cells is generating increasing interest as a potent, yet well tolerated, form of immunotherapy for a broad range of malignancies [1–3]. However, while in vitro and in vivo studies have clearly validated the potential efficacy of these approaches [4], the therapeutic potential of NK cell-based ATI (NK-ATI) has yet to be fully realized in clinical settings, particularly for the treatment of solid tumors including hepatocellular carcinoma (HCC) [4,5].
NK cells have fueled translational research that has led to clinical trials investigating a number of novel methods to potentiate NK cytotoxicity against human HCC (ClinicalTrials.gov number: NCT00769106, NCT02008929, NCT01147380 and NCT01749865 [6]). For clinical application, a critical remaining hurdle for NK-ATI in HCC patients is the inadequate homing efficiency of ex vivo-expanded effector NK cells to the target tumors and adjacent liver tissues [7,8]. Another significant obstacle is the lack of well-established noninvasive tools for monitoring NK cell migration to target tissues [9,10].
Transcatheter infusion has strong potential to augment NK cell delivery to the target tumor tissues. Serial monitoring of NK cell biodistribution to HCC may serve as an early biomarker for the prediction of longitudinal response during NK-ATI clinical trials. Exogenously labeled cells can be tracked with nuclear (PET/SPECT) [11–14], optical [15,16], bioluminescent [17] or MRI techniques [18–21]. Each modality offers salient features valuable for both preclinical and clinical applications [11–21]. However, particularly for clinical applications, MRI offers many advantages such as superior soft tissue contrast and superior spatial resolution [18–21]. MRI has been used to track transplanted stem cells in ischemic myocardium, stroke and dendritic cell migration to lymph nodes in patients with melanoma [18–21]. However, most MRI cell-tracking approaches have primary used US FDA-approved superparamagnetic iron-oxide (SPIO) MRI contrast agents that are no longer available for clinical use.
The purpose of our study is to report on intraportal vein (IPV) transcatheter infusion of NK cells for delivery to HCC and adjacent liver tissues, the use of FDA-approved drugs (heparin, protamine and ferumoxytol) that form specifically functional nanocomplexes for therapeutic NK cell labeling and MRI quantification of the delivered NK cells to target HCC tumors and adjacent liver tissues following IPV transcatheter infusion.
Materials & methods
Following guidelines from the NIH, our study was approved by our Institutional Animal Care Use Center and Use Committee.
HPF nanocomplex preparation
FDA-approved Ferumoxytol (Feraheme®, AMAG Pharmaceuticals, Inc., MA, USA) is an ultrasmall superparamagnetic iron oxide nanoparticle (USPIO) with a size of 17–31 nm in diameter for treatment of iron deficiency anemia. Heparin sulfate and protamine sulfate (both from American Pharmaceuticals Partner, IL, USA) were used to form heparin-protamine-ferumoxytol (HPF) nanocomplexes [22]. The HPF complexes were prepared by sequentially adding heparin at 2 U/ml and protamine at 60 μg/ml with ferumoxytol at 25 μg/ml, 50 μg/ml or 100 μg/ml, separately [22].
NK cell culturing techniques
IL-2 independent NK cell line NK-92MI (ATCC, VA, USA) was grown in MEM media containing 0.2 mM inositol, 0.1 mM 2-mercaptoethanol, 0.02 mM folic acid, 12.5% horse serum, 12.5% fetal bovine serum and 1% penicillin streptomycin (all above agents from Invitrogen™, CA, USA). Cells were grown in standard 162 cm2 tissue culture flasks in a 95% air and 5% CO2 (v/v) atmosphere at 37°C.
Cell labeling & iron content
Different concentrations of HPF nanocomplexes (with 0 μg/ml in 0.5 ml phosphate-buffered saline [PBS], 25, 50 or 100 μg/ml ferumoxytol) were added to each flask (5 × 10⁶ NK cells in 10 ml culture medium), separately. Each flask was then incubated for 4 h [23,24]. Labeled cells were harvested and washed three times with PBS followed by washes with 10 U/ml heparin to remove the residual HPF. Cells were then fixed for Prussian blue (Invitrogen) staining and transmission electronic microscopic (TEM) examination (FEI Company, OR, USA). Prussian blue staining was performed as previously described to detect iron-positive HPF-labeled cells [22,25]. Cell labeling efficiency = number of positive-staining cells/number of total cells in per ten fields (20×) [26]. TEM images of NK cells were used to verify intracellular iron uptake. A separate set of samples were used to quantify iron content within each cell, iron content of the cell samples was prepared and measured using inductively coupled plasma–mass spectrometry (Thermo Fisher Scientific, MA, USA) as previously described [27].
Cell viability assays
To determine the viability of labeled cells, 3-(4, 5-dimethylthiazol-2-yl)-2,5-diphenyltetrazolium bromide (MTT, Sigma-Aldrich, Munich, Germany) assays were performed [28]. In brief, aliquots of labeled and unlabeled cells (which were not exposed to HPF nanocomplexes) were plated in 96-well plates with a cell density of 104 cells per well. The medium was completely removed and MTT solutions were added, the absorbance values at a wavelength of 490 nm in each well were measured using a microplate reader (Bio-Tek, VT, USA). Separate aliquots, containing 5 × 10⁵ cells each, were resuspended in 100 μl annexin V binding buffer (BD Pharmingen, CA, USA) and incubated with 10 μl of 50 μg/ml propidium iodide solution (BD Pharmingen) without or with 5 μl FITC-conjugated annexin V reagent (BD Pharmingen) for 15 min in the dark. These cells were then analyzed using a FACScalibur flow cytometer (BD Biosciences, CA, USA), yielding percentages of apoptotic (annexin V positive, propidium iodide negative), necrotic and viable cells [26]. The study was repeated with 50 μg/ml HPF labeling protocol, cell viabilities were assessed at 0 (immediately after 4-h labeling period), 3 and 7 days after labeling, respectively.
Labeled NK cell function assays
Quantitative measurement of NK cell-mediated cytolysis was performed. McA-RH7777 rat hepatoma cells (ATCC) were plated in 96-well plates with a cell density of 104 cells per well. After 3 h, McA-RH7777 cells attached to the bottom. The labeled (with 50 μg/ml HPF) and unlabeled NK cells were then directly added to wells at a NK/McA-RH7777 ratio 10:1 [29]. After 2, 8 and 12 h of co-culture, the culture medium was completely removed, containing NK cells and dead McA-RH7777 cells (NK cells and dead McA-RH7777 cells suspended in the culture medium and only living McA-RH7777 cells adhere to the bottom of culture dishes). The adherent cells were harvested and counted with automated cell counter (Invitrogen, NY, USA). Percentage of NK cell-mediated cytolysis = number of dead McA-RH7777 cells (104 – living McA-RH7777)/ number of total McA-RH7777 cells (104) × 100%.
MRI of cell phantoms
Labeled cells using 50 μg/ml HPF for 4-h labeling were fixed with 10% formalin. Four NK cell samples contained 1 × 10⁵, 5 × 10⁵, 1 × 10⁶ and 5 × 10⁶ labeled NK cells and an additional 5 × 10⁶ unlabeled NK cell sample served as the control. All cells were homogenously suspended in 1 ml 1% agarose gel. These were then transferred to 1.5 ml tubes for MR phantom studies.
For time-kinetic MRI phantom studies in vitro, labeled cells (using 50 μg/ml HPF with 4-h labeling protocol) were used. After labeling, cells were washed three times using PBS with 10 U/ml heparin to remove the residual HPF. Labeled cells were then incubated in normal medium without HPF, separately. After 3 and 7 days incubation, cells were detached by trypsinization and counted using a cell counter (Countess® II FL Automated Cell Counter, Invitrogen). NK cell samples immediately (0 day), 3 and 7 days after labeling were prepared and each sample contained 5 × 10⁶ cells in 1 ml 1% agarose gel. An additional 5 × 10⁶ unlabeled NK cell sample and a 1 ml 1% agarose gel sample served as controls. All samples were transferred to 1.5 ml tubes for MR phantom studies.
MRI was performed using a 7.0T 30 cm bore scanner (ClinScan, Bruker BioSpin, Ettlingen, Germany) with 75 mm rat coil (Bruker BioSpin). MRI sequences and parameters are listed in Table 1.
Table 1.
MRI sequences and parameters.
| Sequence | Cell phantom |
In vivo MRI |
||
|---|---|---|---|---|
| GRE T2*W | GRE T2* map | TSE anatomy | GRE T2* map | |
| TR/TE (ms) | 50/10.00 | 1100/(6.00, 12.18, 21.45, 66.18, 72.36) | T1W: 200/2.6 T2W: 841/28.00 |
598/(2.91, 6.63, 10.35, 14.07) |
| Flip angle | 9° | 30° | T1W/T2W: 90°/180° | 30° |
| FOV (mm2) | 45 × 45 | 57 × 57 | 70 × 70 | 60 × 60 |
| Matrix | 128 × 128 | 128 × 128 | 128 × 128 | 192 × 192 |
| ST (mm) | 0.30 | 1.5 | 1.0 | 1.0 |
| Voxel size (mm3) | 0.35 × 0.35 × 0.30 | 0.45 × 0.45 × 1.50 | 0.55 × 0.55 × 1.00 | 0.31 × 0.31 × 1.00 |
FOV: Field of view; GRE: Gradient echo; ST: Slice thickness; TE: Echo time; TR: Repetition time; TSE: Turbo spine echo.
Animal model
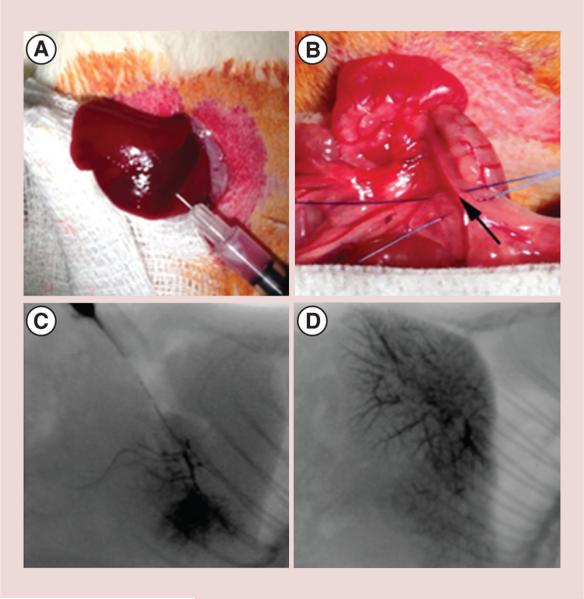
McA-RH7777 rat hepatoma cells (5 × 10⁶) were suspended in media and directly injected into the left lateral lobe during minilaparotomy procedures in male Sprague–Dawley rats (Charles River, MA, USA) under gas anesthesia with 2% isoflurane and oxygen at 1 l/min (Figure 1A). The incisions were then closed in the two layers. Tumors were allowed to grow for 7 days to reach a size >10 mm in diameter as verified by MRI.
Figure 1. Tumor implantation and x-ray angiography of portal vein.
(A) 5 × 10⁶ McA-RH7777 HCC cells were injected under the hepatic capsule in left lateral lobe. (B) 24G polyurethane catheter was inserted into the superior mesenteric vein and advanced into the portal vein (the black arrow indicted the inserting point). Fluoroscopic depiction of portal vein infusion patterns in two representative animals: (C) local delivery to left lateral lobe and (D) delivery to multiple lobes.
Catheterization procedures
The catheterization procedure involved laparotomy for surgical exposure of the portal vein (PV) and superior mesenteric vein (SMV) under anesthesia. A 24G polyurethane microcatheter (Terumo SurFlash®, NJ, USA) was inserted into the SMV and advanced into the PV (Figure 1B). 0.1 ml of heparin was infused and angiography was carried out with digital subtraction angiography using an OEC 9800 Mobile C-arm (GE Medical Systems, WI, USA) to confirm catheter placement in the left hepatic PV (Figure 1C & D). Finally, 2 × 10⁷-labeled NK cells with 50 μg/ml HPF in 0.5 ml of PBS were infused into the PV over course of 20 s followed by 0.2 ml saline flush (n = 12). An additional four rats were infused with 0.5 ml of saline as sham control. After catheter removal, proximal and distal ligations of the SMV were performed, next to the point of the catherization to prevent bleeding and blood flow to the liver was restored.
Systemic delivery
For intravenous (iv.) NK delivery group (n = 6), following the insertion of a 24G polyurethane catheter into the tail vein, 0.1 ml of heparin lock flush was infused followed by 2 × 10⁷-labeled NK cells (50 μg/ml HPF labeling 4-h protocol) in 0.5 ml of PBS and 0.2 ml of saline flush. The catheter was then withdrawn, and pressure placed on the puncture site with gauze to minimize bleeding.
In vivo MRI of labeled NK cell biodistribution in rat liver
MRI scans were performed before and after injection 30 min and 12 h using a 7.0T (ClinScan, Bruker BioSpin) with 75 mm rat coil. T2* mapping was performed following acquisition of TSE T1-weighted (T1W) and T2W anatomical images. Scan parameters are listed in Table 1. Mean R2* (1/T2*) values for the tumors and surrounding liver tissues were measured before and postinfusion NK cells (30 min and 12 h) both IPV and iv. infusion.
Histology
Immediately after completion of MRI, all rats were euthanized. Livers were harvested and fixed in 10% formalin and then tissues were embedded in paraffin. Sections including tumors tissues were sliced (4 μm) for Prussian blue and CD56 (Anti-CD56, Becton Dickinson, CA, USA) immunohistochemistry (IHC) staining [30].
Image analysis
For MRI examinations, image analyses were performed using MATLAB (2011a, MathWorks, MA, USA). Regions of interest were drawn by a radiologist (K Li) with greater than 15 years experience. Regions of interest (area size: 1.35 ± 0.18 cm2) were drawn to measure R2* values in the viable tumor and within adjacent liver tissue in the same lobe. CD56 and Prussian blue stained slides from tumor, adjacent liver tissue and sham control liver tissue specimens (six slices from each rat) were scanned at a magnification of 20× and digitized using the TissueFAXS system (TissueGnostics, CA, USA). These acquired images were analyzed using the HistoQuest Cell Analysis Software (TissueGnostics) package to quantify the total number of HPF-labeled NK cells within each specimen.
Statistical analysis
Statistical calculations were performed using the Graphpad Prism V6 software package (Graphpad, CA, USA). Data are presented as mean ± standard deviation as indicated. Statistical significance was defined as p value <0.05. One-way ANOVA was used to compare in vivo R2* measurements over the observation time points (pre, postinfusion 30 min and 12 h). Pearson correlation coefficients were calculated to assess the relationship between MRI R2* measurements and histological NK (CD56) measurements within tumor and surrounding liver tissue at 12-h postinfusion interval.
Results
Cell labeling & iron content
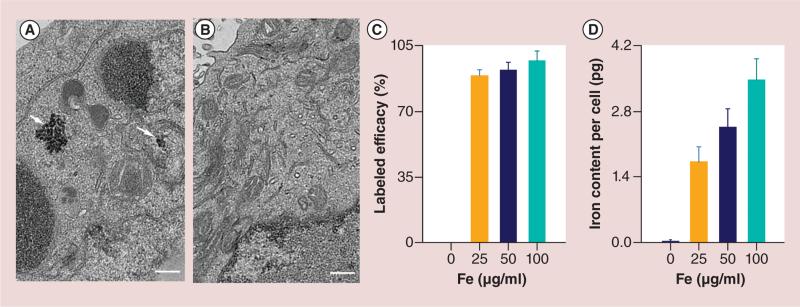
Uptake of HPF was confirmed by TEM (Figure 2A & B). The internalization of HPF nanocomplexes (sample from 50μg/ml HPF group) in cytoplasm was confirmed. HPF was not observed on the cell membrane. Labeling efficiency measurements using Prussian blue assays were 0 μg/ml HPF = 0% (PBS control), 25 μg/ml HPF = 89 ± 3%, 50 μg/ml HPF = 92 ± 4% and 100 μg/ml HPF = 97 ± 5%, respectively (each n = 6) (Figure 2C). The average iron content per cell using inductively coupled plasma–mass spectrometry in each group were 0 μg/ml HPF = 0.03 ± 0.01 pg; 25 μg/ml HPF = 1.72 ± 0.32 pg; 50 μg/ml HPF = 2.46 ± 0.39 and 100 μg/ml HPF = 3.47 ± 0.45 pg; respectively (each n = 6). The iron content of unlabeled cells was significantly lower than that of labeled cell groups (all p < 0.05) (Figure 2D). Moreover, cellular uptake efficiency increased with exposure to increasing concentration of HPF during labeling procedures (all p < 0.05).
Figure 2. Transmission electron microscopy images of natural killer cells, cell labeling efficiency and iron content per cell.
(A) Representative transmission electronic microscopic image of heparin-protamine-ferumoxytol (HPF)-labeled natural killer cell, HPF nanocomplexes were encapsulated in the endosomes as electron-dense nanoparticles (white arrows). (B) Representative transmission electronic microscopic image of unlabeled natural killer cell did not demonstrate electron-dense HPF nanocomplexes in cytoplasm. (C) Cell labeling efficacy was assessed by Prussian blue staining. (D) Iron content per cell was measured using inductively coupled plasma–mass spectrometry. Scale bars in (A & B): 3 μm.
Cell viability
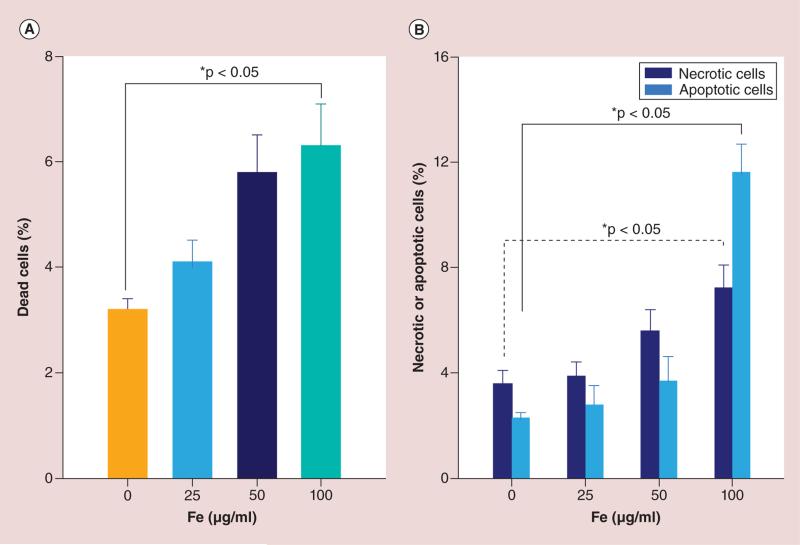
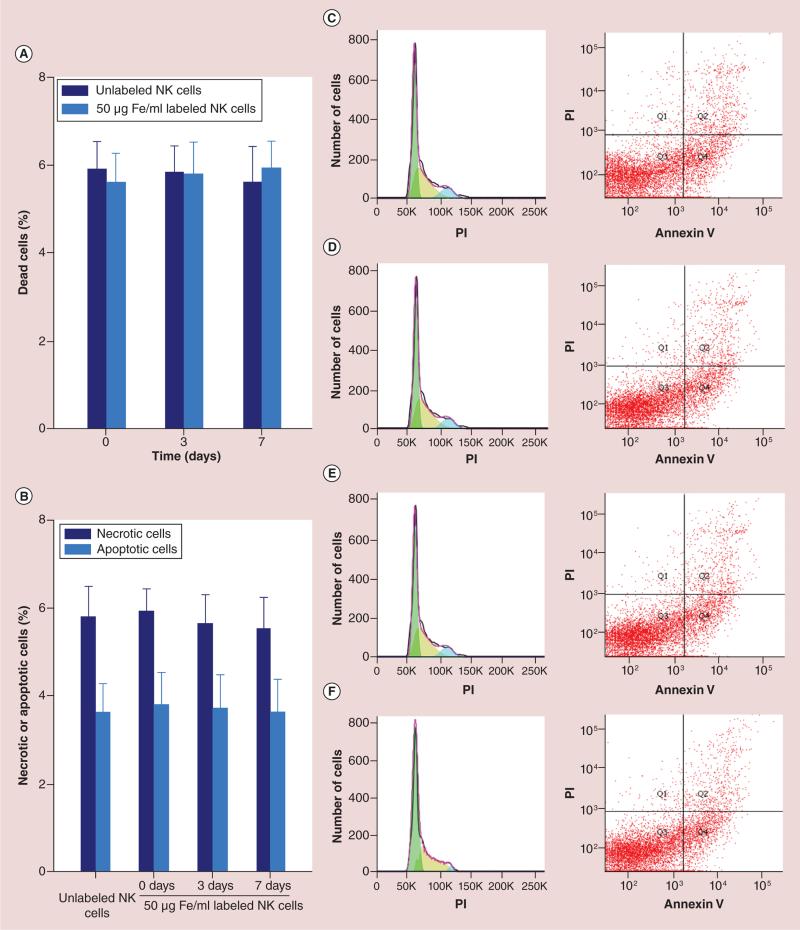
Cell viability results for HPF-labeled NK cells and unlabeled cells are shown in Figure 3. MTT assays (each n = 6) for dead cell measurements; unlabeled cells (0 μg/ml HPF) = 3.2 ± 0.2%; labeled cells: 25 μg/ml HPF = 4.1 ± 0.4%, 50 μg/ml HPF = 5.8 ± 0.7% and 100 μg/ml HPF = 6.3 ± 0.8%, respectively. Only 100 μg/ml HPF labeling lead to a slight increase in cell death compared with control group (p < 0.05) (Figure 3A). Necrotic cells by fluorescence-activated cell sorting (FACS): unlabeled cells = 3.6 ± 0.5%; labeled cells: 25 μg/ml HPF = 3.9 ± 0.5%, 50 μg/ml HPF = 5.6 ± 0.8% and 100 μg/ml HPF = 7.2 ± 0.9%, respectively. A significant increase in cell death was found only for 100 μg/ml HPF labeled group compared with control group (p < 0.05) (Figure 3B). Apoptotic cells by FACS: unlabeled cells = 2.3 ± 0.2%; labeled cells: 25 μg/ml HPF = 2.8 ± 0.7%, 50 μg/ml HPF = 3.7 ± 0.9% and 100 μg/ml HPF = 11.6 ± 1.1%, respectively. A significant difference in apoptotic cells was found only in 100 μg/ml HPF labeled group compared with control group (p < 0.05) (Figure 3B). Figure 4A & B showed the viability assessments of long term (up to a week) after the labeling (4 h, at 50 μg/ml HPF), there were no significant differences between labeled cells and unlabeled cells at 0, 3 and 7 days follow-up intervals (all p > 0.05). Figure 4C–F are the representative flow plots; C for unlabeled NK, D for immediate after labeling (0 day), E for 3 days after labeling and F for 7 days after labeling, respectively.
Figure 3. Cell viability assays immediately after labeling 4 h (50μg/ml heparin-protamine-ferumoxytol).
(A) Dead cells were measured by MTT assays. (B) Necrotic and apoptotic cells were measured by fluorescence-activated cell sorting.
Figure 4. Long-term viability assessments (up to a week) after the 4-h labeling period (50μg/ml heparin-protamine-ferumoxytol).
There were no significant differences in the viability of labeled and unlabeled NK cells at days 0, 3 and 7. (A) Dead cells, (B) necrotic and apoptotic cells (all p > 0.05), (C–F) are the representative flow plots, (C) unlabeled NK cells, (D) immediately after labeling (day 0), (E) 3 days after labeling and (F) 7 days after labeling, respectively.
NK: Natural killer; PI: Propidium iodide.
Quantitative measurement of NK cell-mediated cytolysis
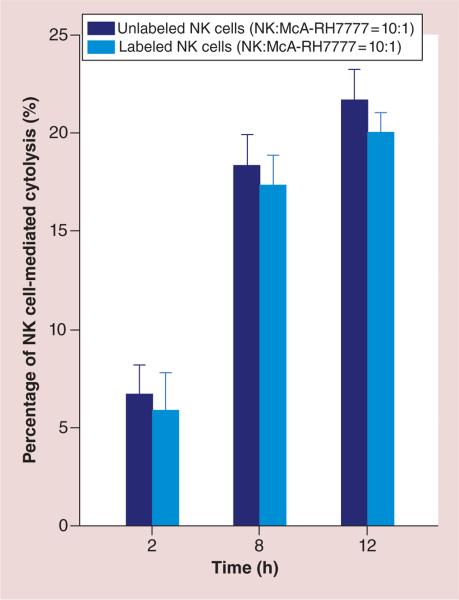
As shown in Figure 5, percentages of NK cell-mediated cytolysis were significantly increased 8 h (and 12 h) after co-culture in comparison with those at 2 h after co-culture (p < 0.05) and no significant differences were found between 8 and 12 h (p > 0.05). Moreover, no differences were found for NK cell-mediated cytolysis between unlabeled and labeled NK groups for 2, 8 and 12 h co-culture periods (all p > 0.05).
Figure 5. Quantitative measurements of natural killer cell-mediated cytolysis.
NK cell-mediated cytolysis was significant increased 8 h (and 12 h) after co-culture compared with 2 h after co-culture (p < 0.05) and no significant differences were found 8 and 12 h after culture (p > 0.05). No significant differences were found between NK cell-mediated cytolysis levels for unlabeled and labeled NK groups after 2, 8 and 12 h of co-culture (all p > 0.05).
NK: Natural killer.
In vitro MRI of phantoms
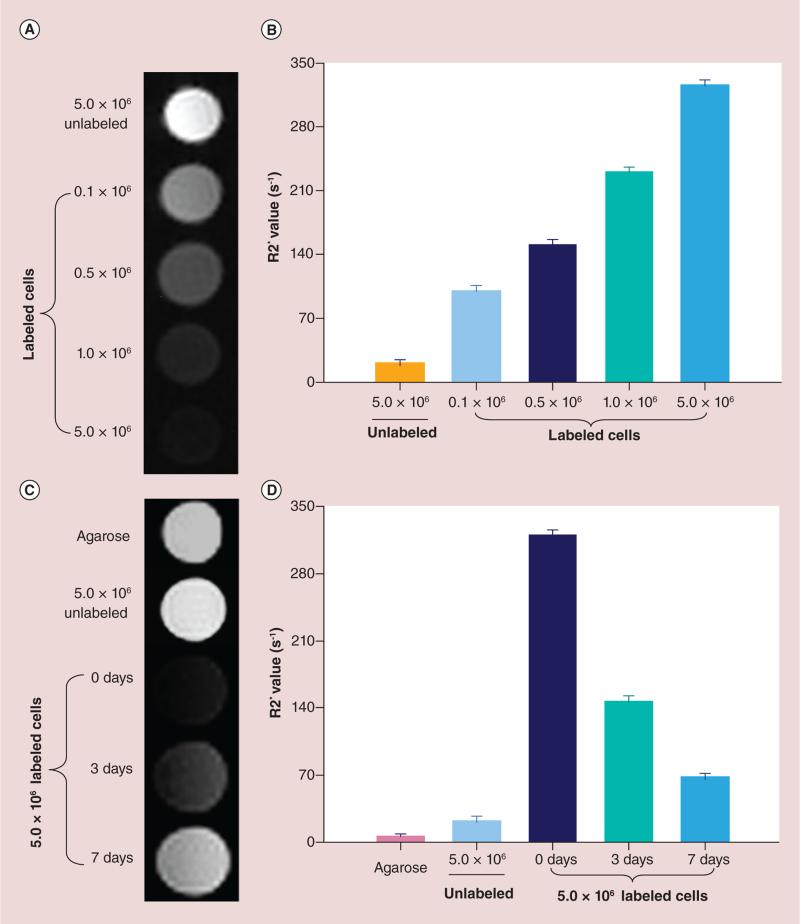
The T2* signal intensity of the NK cell phantoms containing different numbers NK cells labeled with 50 μg/ml HPF markedly decreased with increasing cell number (Figure 6A). R2* values increased in proportion to the number of labeled NK cells included in each cell phantom (Figure 6B). The time kinetics up to 1 week after labeling showed that T2*W signal intensity for the NK cell phantoms containing the same number of unlabeled and labeled cells significantly increased 3 and 7 days after labeling compared with immediately after labeling (0 day) (Figure 6C). R2* values significantly decreased 3 and 7 days after labeling compared with R2* values immediately after labeling 0 day (all p < 0.05); however, there were still significant differences between R2* values in labeled cell phantoms and unlabeled cell/1% aga-rose phantoms 3 and 7 days after labeling (Figure 6D) (all p < 0.05).
Figure 6. Quantitative MRI of cell phantoms.
(A) T2* signal intensity of the natural killer (NK) cell phantoms containing different numbers NK cells labeled with 50 μg/ml HPF. (B) R2* values increased in proportion to the number of labeled NK cells included in each cell phantom. (C) The time kinetics up to 1 week after labeling showed that T2* signal intensity of the NK cell phantoms containing the same number of unlabeled and labeled cells significantly increased at 3 and 7 days after labeling compared with immediately after labeling (0 days). (D) R2* values significantly decreased at 3 and 7 days after labeling compared with the values of 0 day (all p < 0.05). (D) There were significant differences between labeled cell phantoms and unlabeled cell/1% agarose phantoms (all p < 0.05).
In vivo quantitative MRI of IPV transcatheter NK cell delivery & comparison with iv. systemic delivery
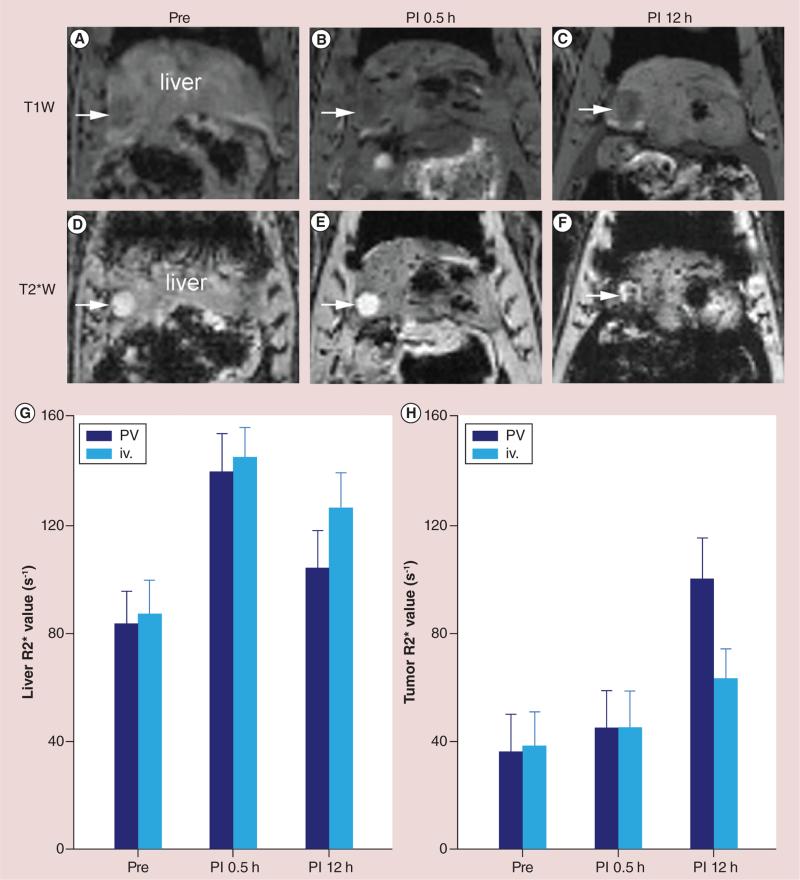
Identification of the SMV for subsequent catheterization of the PV was successful in 100% (12/12) of rats as confirmed on digital subtraction angiography (Figure 1C & 1D). Within T1W anatomic images, the tumors were depicted as heterogeneous low signal intensity both before and after infusion of the HPF-labeled NK cells. In T2*W images, the tumors were depicted with homogeneous high signal intensity both before and 30 min following the delivery of labeled NK cells. However, 12-h postinfusion signal intensities within the tumor nodules became heterogeneous (Figures 7A–F). A significant difference in R2* values was found before and 30 min after NK cell infusion within liver tissues surrounding the tumors (prein-fusion vs 30-min postinfusion; 83.16 ± 11.93 s−1 vs 139.20 ±14.06 s−1; p < 0.001), but no significant difference was found in the tumor nodules at this earlier 30-min follow-up period (preinfusion vs 30-min postinfusion; 35.95 ± 13.80 s−1 vs 44.88 ± 13.68 s−1; p > 0.05) (Figure 7G & H). However, for the tumor tissues, a significant difference in R2* values was found at the 12-h postinfusion follow-up interval (30 min postinfusion vs 12 h postinfusion; 44.88 ± 13.68 s−1 vs 99.70 ± 15.19 s−1; p < 0.001); there was a significant decrease in R2* values within surrounding liver tissues between early (30 min) and delayed (12 h) follow-up intervals (30 min postinfusion vs 12 h postinfusion; 139.20 ± 14.06 s−1 vs 103.69 ± 13.72 s−1; p < 0.001) (Figure 7G & H). For iv. systemic delivery, a significant increase in R2* values was found between pre- and 30-min postinfusion of NK cells within liver tissues surrounding the tumors (preinfusion vs 30 min postinfusion; 86.69 ± 12.59 s−1 vs 144.8 ± 10.69 s−1; p < 0.001), but there was no significant difference in the tumor nodules between before and 30-min follow-up period (preinfusion vs 30-min postinfusion; 38.20 ± 12.42 s−1 vs 45.09 ± 13.37 s−1; p > 0.05) (Figure 7G & H). However, there was a significant difference in R2* values of tumors at the 12-h postinfusion follow-up interval (30 min postinfusion vs 12 h postinfusion; 45.09 ± 13.37 s−1 vs 68.62 ± 11.46 s−1; p < 0.05); a decrease in R2* values was found within surrounding liver tissues between early (30 min) and delayed (12 h) follow-up intervals (30 min postinfusion vs 12 h postinfusion; 144.80 ± 10.69 s−1 vs 126.00 ± 12.85 s−1; p < 0.05). Moreover, there were significant differences (in both tumors and surrounding liver tissues) between iv. and IPV groups at 12-h postinfusion time point (all p < 0.05) (Figure 7G & H).
Figure 7. Representative T1W and T2*W images and quantitative R2* measurements at pre- and postinfusion (2 × 10⁷ labeled natural killer cells) intervals (30 min and 12 h).
(A–C) are T1W images at preinfusion, postinfusion 30 min and 12 h, respectively. (D–F) are T2*W images at preinfusion, postinfusion 30 min and 12 h, respectively. (G & H) are quantitative R2* measurements. For intraportal vein delivery, significant difference in R2* values was found 30 min after natural killer cell infusion within liver tissues surrounding the tumors (p < 0.001), but no significant difference was found in the tumor nodules at this earlier 30-min follow-up period (p > 0.05). A significant difference in R2* values was found in the tumors at 12-h postinfusion follow-up interval (p < 0.001). There was a significant decrease in R2* values within surrounding liver tissues between early (30 min) and delayed (12 h) follow-up intervals (p < 0.001). For iv. systemic delivery, a significant increase of R2* values was found before and 30 min after natural killer cell infusion within liver tissues surrounding the tumors (p < 0.001), no significant difference in the tumor nodules between, before and 30-min follow-up period (p > 0.05). A significant difference in R2* values of tumors at 12-h postinfusion follow-up interval (p < 0.05) and a decrease in R2* values were found within surrounding liver tissues between early (30 min) and delayed (12 h) follow-up intervals (p < 0.05). There were significant differences (in both tumors and surrounding liver tissues) between groups iv. and intraportal vein at 12-h postinfusion time point (all p < 0.05).
iv.: Intravenous; PI: Postinfusion; PV: Portal vein.
Histologic evaluation of the transcatheter NK cell delivery
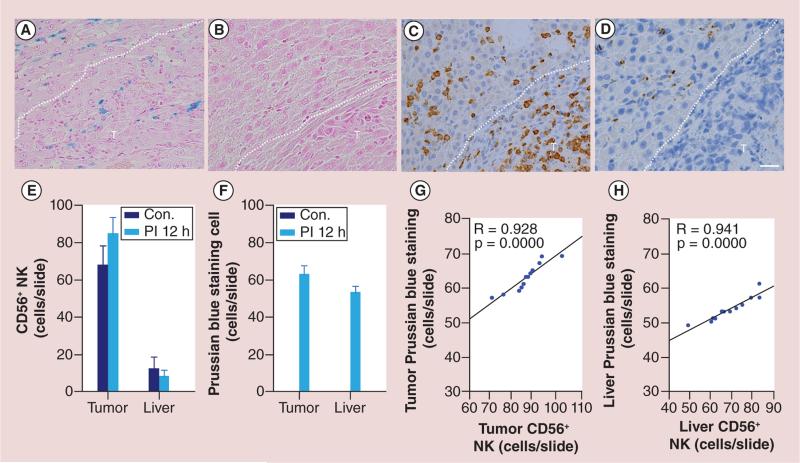
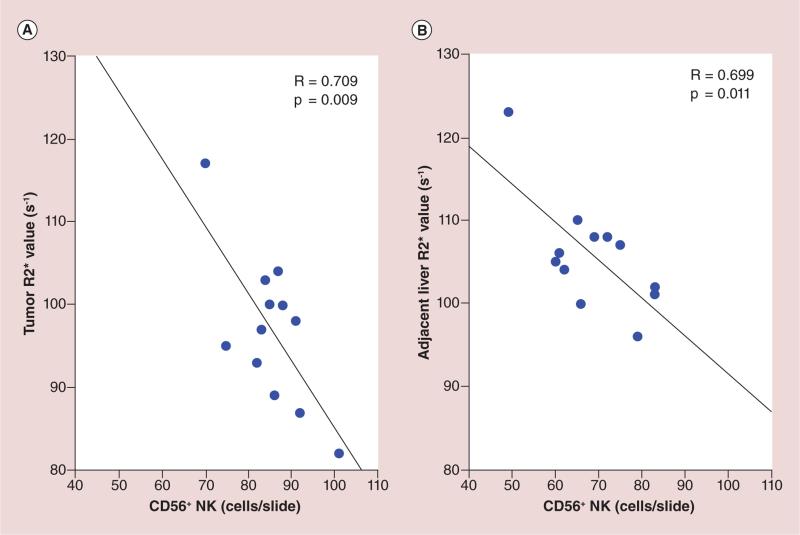
Photomicrographs of the tumor and surrounding liver tissues showed colocalization of CD56 and Prussian blue-positive cells with HPF-labeled NK cells (Figure 8A & B). Within consecutive slices, the spatial distribution of Prussian blue staining was well correlated to the corresponding distribution of observed CD56 staining (Figure 8C & D), and 12 h postinfusion, NK cell delivery was quantified histologically using CD56 and Prussian blue stained slices with TissueFAXS system. There was a significantly larger number of positively stained NK cells measured (both within tumors and the surrounding liver tissues) for the IPV delivery group than observed for sham control group (all p < 0.05) (Figure 8E & F); the quantitative levels of Prussian blue and CD56 staining were well correlated in for both tumors and surrounding liver tissues (Figure 8G & H). R2* values measured at this 12-h postinfusion interval within tumor and surrounding liver tissue was well correlated with the histological NK measurements (R = 0.70, p < 0.05) (Figure 9).
Figure 8. Representative Prussian blue and CD56 optical microscopy images and the comparison between Prussian blue-staining and CD56-staining methods.
(A & C) are consecutive slices from a rat of 12 h postinfusion heparin-protamine-ferumoxytol-labeled cells. (A) Prussian blue staining, (C) CD56 staining. The spatial distribution of Prussian blue staining was well correlated to the corresponding distribution of observed CD56 staining. (B & D) Consecutive slices from a sham control rat of 12-h postinfusion 0.5 ml saline. (B) No Prussian blue-positive cells were found, (D) Few CD56-positive cells were detected in the tumor and surrounding liver tissue. CD56 and Prussian blue stained slices were quantitatively analyzed using TissueFAXS system. There was a significantly larger number of positively stained NK measured (for both tumors and the surrounding liver tissues) in intraportal vein delivery group compared with sham control group (E & F; all p < 0.05). The quantitative levels of CD56 and Prussian blue staining was well correlated in both tumors and surrounding liver tissues (G & H). Dashed lines in (A–D) are the boundary between tumor and surrounding liver tissue. T represents tumor. Scale bars (A–D): 25 um.
Con.: Sham control; NK: Natural killer; PI: Postinfusion.
Figure 9. Comparison between MRI R2* measurements and histological natural killer (CD56) measurements within tumor and surrounding liver tissue at 12-h postinfusion interval.
R2* values measurements within tumor (A) and surrounding liver tissue (B) was well correlated with the histological NK measurements (R = 0.709, p < 0.05 for tumor; R = 0.699, p < 0.05 for surrounding liver tissue).
NK: Natural killer.
Discussion
Our study demonstrated the following: NK cells can be labeled using clinically applicable HPF nanocomplexes with minimal impact upon cell viability and cytolytic function; transcatheter IPV delivery of NK cells permits locoregional delivery to hepatic liver lobe containing liver tumors; clinically applicable HPF-labeled NK cells can be used to monitor delivery and cellular tracking with MRI.
As with any cell-based cancer immunotherapy; the efficacy of the treatment approach depends upon safety and the ability of therapeutic cells to adequately target or biodistribute to tumor sites [23,24]. NK-ATI is a promising approach for the treatment of solid tumors including HCC [2,3,5]. Conventional intravenous delivery of therapeutic NK cells may limit the dose that ultimately reaches the target tumor and surrounding liver tissues [30]. Since hepatic neoplasms preferentially derive their blood supply from an arterial source while the majority of noncancerous liver is supplied by the PV, transcatheter intra-arterial therapies have been used in clinical settings [31]. However, there are significant differences between transcatheter delivery of chemotherapies and transcatheter delivery of cellular immuno therapies. The goal of intra-arterial transcatheter delivery is to selectively target HCC lesions, ideally minimizing delivery of these cytotoxic agents to normal liver tissues (compounds toxic to both tumors and normal tissues). However, NK cells are conversely nonimmunogenic and nontoxic to normal liver tissues. Following locoregional delivery, NK cells can migrate to tumors with the ability to recognize and lyse tumor cells using a variety of recognition receptors [1–3]. Imaging and histology results from these studies indeed suggest that NK cells can migrate to liver tumors after locoregional delivery with transcatheter IPV infusion. It is conceivable that IPV infusion could be more effective for treatment of smaller undetected tumor nodules within a background of hepatic cirrhosis because at earlier stages the tumor blood supply is predominantly of portal venous origin [32]; however, future studies remain necessary to validate any such improvements.
Heparin, protamine and ferumoxytol are individually routinely used for specific clinical indications. The concentrations of HPF used in our study provided intra-cellular concentrations of each drug that were substantially below recommended clinical dose limits [22,33]. The HPF nanocomplexes have similar biochemical properties to SPIO nanoparticles, which have been used previously to label cells and biodegrade through the iron metabolic pathway [22,34]. We found that significant uptake of HPF had minimal effects on cell viability. Using HPF-labeling, it has been previously demonstrated that viabilities of T cells, stem cells or bone marrow cells were not affected [22,33]. Our observations were in agreement with these prior studies. In our study, the doses of 25, 50 and 100 μg/ml HPF were used for cell labeling, resulting in high labeling efficiency, however, iron uptake per cell was dependent upon HPF concentrations. A significant increase in cell death/apoptosis was found only for 100 μg/ml HPF labeling group compared with control group. The cytolytic activity of NK cells after a 50 μg/ml HPF labeling protocol was not impaired by the labeling procedure.
In vitro cell phantom studies demonstrated that R2* values increased with increasing numbers of labeled NK cells; using 50 μg/ml HPF for a 4-h exposure protocol allowed for more long-term labeling (up to a week demonstrated in vitro studies). Resulting in vivo changes of R2* values should accordingly indicate the biodistribution of NK cells to the tumor nodules and surrounding liver tissues. NK cell delivery to tumors and liver tissues was verified with IHC microscopic images. The biodistribution of Prussian blue-stained positive cells was well correlated to the biodistribution of CD56-positive NK cells as observed with IHC staining 12 h postinfusion. MRI R2* values of the tumor nodules and surrounding liver tissues were well correlated with NK cell delivery measured with IHC staining. Our study indicated that in vitro expanded NK cells can be selectively delivered to target hepatic tumors by locoregional administration with IPV transcatheter infusion, and 12 h postinfusion, NK cells were observed to migrate from surrounding liver tissue to the tumors, as verified by our quantitative MRI measurements. Our study demonstrated that conventional iv. delivery of therapeutic NK cells limits the dose that ultimately reaches the target tumors. Moreover, both MRI R2* measurements and CD56 IHC results demonstrated increased NK delivery to tumors for IPV compared with iv. infusion. Besides direct antitumor activities, NK cells in the peritumoral area may be important for activation of other immunologic mechanisms, for the treatment of very small metastases and/or to prevent invasion of the primary lesion [1–3].
With the withdrawal of clinically available SPIO (USPIO) MRI contrast agents from the market, currently ferumoxytol is the only intravenous FDA-approved USPIO nanoparticle that can be used to magnetically label and track cell migration in vivo by MRI. The labeling protocol with 50 μg ml−1 ferumoxytol within HPF used for MRI tracking in vivo resulted in more than 90% labeling efficiency using only 4-h labeling period and importantly demonstrated no significant differences in viability indices between labeled and unlabeled cells. In clinical settings, given the potential fragility of autologous NK cells from patients in vitro [35], a limited duration labeling period could potentially avoid cell damage and subsequent alteration of priming function. Therefore, this short labeling period may be especially conducive to clinical translation during NK-ATI trials.
Our study had several limitations. Rat tumor model and human NK-92 cells were used for the technique development of labeling and delivery methods due to: stable NK cell line that was more practical for quality control and large-scale production than alternative harvest and expansion of rat NK cells, NK-92 cells can rapidly kill target cells without prior immunization or MHC restriction [36–38], with NK-92's offering high cytolytic responsiveness toward a wide variety of tumor target cells including rat and mouse [39–41]. However, for this study therapeutic response was not evaluated. Given the possibility that NK-92 cells may be eliminated prematurely by a host's immune system, further studies are clearly needed to rigorously evaluate therapeutic efficacy in the setting of adoptive immunotherapy. An additional limitation was that MRI tracking of labeled NK migration within target liver tissues was performed at only two time points postinfusion (30 min and 12 h) and our study protocol examined only one NK dose (2 × 10⁷ cells) [42]. The currently used dose was selected from references and our initial experiences [8,30,43–44]; additional studies will be valuable to determine how many labeled NK cells provide measureable changes and the optimal postinfusion time intervals for follow-up imaging measurements. Finally, our study does not assess the relationship between different delivered NK doses, MRI quantification of delivery and therapeutic outcomes. Future studies should compare iv. and IPV infusion routes for NK adoptive immunotherapy.
Conclusion
Our study demonstrated an efficient approach for labeling NK cells within a 4-h period. IPV transcatheter infusion permitted selective delivery of NK cells to target liver tissue and MRI measurement of the biodistribution of HPF-labeled NK cells within the tumors and adjacent liver tissues. Additional translational studies are clearly warranted to evaluate the efficacy of therapeutic response and better understand the relationship between dynamic NK biodistributions and therapeutic outcomes during ATI for hepatic malignancies.
Future perspective
Using a clinically applicable approach for magnetic-labeling NK cells, a 4-h labeling time resulted in high labeling efficiency and no decrease in cellular viability. This short labeling period may be especially conducive to clinical translation during NK-ATI trials. Serial MRI monitoring of NK cell migration to tumors during ATI could alternatively serve as an important early biomarker for timely prediction of longitudinal response thus affording early adjustments to each individual patient's therapeutic regimen.
Executive summary.
Natural killer (NK) cells can be labeled using clinically applicable heparin-protamine-ferumoxytol nanocomplexes with minimal impact upon cell viability and function.
The transcatheter intraportal vein delivery of NK cells permits locoregional delivery to hepatic liver lobe containing liver tumors.
MRI measurements permitted in vivo monitoring clinically applicable heparin-protamine-ferumoxytol-labeled NK cells migration to tumor, which led to an increase in the tumor R2* values.
Acknowledgements
The authors thank Jodi Nicolai for cell culture support.
This work was supported by the American Cancer Society (SP0011492), the National Natural Science Foundation of China (81420108020), USA National Cancer Institute (CA134719), and funds from the NIH Clinical and Translational Science Awards Program (UL1RR0254741).
Footnotes
Financial & competing interests disclosure
The authors have no other relevant affiliations or financial involvement with any organization or entity with a financial interest in or financial conflict with the subject matter or materials discussed in the manuscript apart from those disclosed.
No writing assistance was utilized in the production of this manuscript.
Ethical conduct of research
The authors state that they have obtained appropriate institutional review board approval or have followed the principles outlined in the Declaration of Helsinki for all human or animal experimental investigations. In addition, for investigations involving human subjects, informed consent has been obtained from the participants involved.
References
Papers of special note have been highlighted as:
• of interest
•• of considerable interest
- 1.Trinchieri G. Biology of natural killer cells. Adv. Immunol. 1989;47:187–376. doi: 10.1016/S0065-2776(08)60664-1. [DOI] [PMC free article] [PubMed] [Google Scholar]
- 2.Ljunggren HG, Malmberg KJ. Prospects for the use of NK cells in immunotherapy of human cancer. Nat. Rev. Immunol. 2007;7(5):329–339. doi: 10.1038/nri2073. [DOI] [PubMed] [Google Scholar]
- 3•.Srivastava S, Lundqvist A, Childs RW. Natural killer cell immunotherapy for cancer: a new hope. Cytotherapy. 2008;10(8):775–783. doi: 10.1080/14653240802648181. [Natural killer (NK) cells have fueled translational research that has led to clinical trials investigating a number of novel methods to potentiate NK cytotoxicity against human malignancies] [DOI] [PMC free article] [PubMed] [Google Scholar]
- 4.Ohira M. Adoptive immunotherapy with liver allograft–derived lymphocytes induces anti-HCV activity after liver transplantation in humans and humanized mice. J. Clin. Invest. 2009;119(11):3226–3235. doi: 10.1172/JCI38374. [DOI] [PMC free article] [PubMed] [Google Scholar]
- 5.Sutlu T, Stellan B, Gilljam M, et al. Clinical-grade, large-scale, feeder-free expansion of highly active human natural killer cells for adoptive immunotherapy using an automated bioreactor. Cytotherapy. 2010;12(8):1044–1055. doi: 10.3109/14653249.2010.504770. [DOI] [PubMed] [Google Scholar]
- 6.ClinicalTrials.gov. https://clinicaltrials.gov/
- 7••.Leung W. Infusions of allogeneic natural killer cells as cancer therapy. Clin. Cancer Res. 2014;20(13):3390–3400. doi: 10.1158/1078-0432.CCR-13-1766. [The unique properties of human NK cells open up a new arena of novel cell-based immunotherapy against cancers that are resistant to contemporary therapies] [DOI] [PubMed] [Google Scholar]
- 8.Meier R, Golovko D, Tavri S, et al. Depicting adoptive immunotherapy for prostate cancer in an animal model with magnetic resonance imaging. Magn. Res. Med. 2011;65(3):756–763. doi: 10.1002/mrm.22652. [DOI] [PubMed] [Google Scholar]
- 9•.Meier R, Golovko D, Tavri S, et al. Depicting adoptive immunotherapy for prostate cancer in an animal model with magnetic resonance imaging. Magn. Reson. Med. 2011;65(3):756–763. doi: 10.1002/mrm.22652. [MRI can track iron-labeled NK cells in vivo] [DOI] [PubMed] [Google Scholar]
- 10.Jha P, Golovko D, Bains S, et al. Monitoring of natural killer cell immunotherapy using noninvasive imaging modalities. Cancer Res. 2010;70(15):6109–6113. doi: 10.1158/0008-5472.CAN-09-3774. [DOI] [PMC free article] [PubMed] [Google Scholar]
- 11•.Meller B, Frohn C, Brand JM, et al. Monitoring of a new approach of immunotherapy with allogenic (111)In-labelled NK cells in patients with renal cell carcinoma. Eur. J. Nucl. Med. Mol. Imaging. 2004;31(3):403–407. doi: 10.1007/s00259-003-1398-4. [The biodistribution and kinetics of allogenic 111In-labeled NK cells can be monitored by single photon emission tomography] [DOI] [PubMed] [Google Scholar]
- 12••.Brand JM, Meller B, Von Hof K, et al. Kinetics and organ distribution of allogeneic natural killer lymphocytes transfused into patients suffering from renal cell carcinoma. Stem Cells Dev. 2004;13(3):307–314. doi: 10.1089/154732804323099235. [These results indicate an extended survival of the transfused cells, despite their foreign nature, in the host organism] [DOI] [PubMed] [Google Scholar]
- 13.Matera L, Galetto A, Bello M, et al. In vivo migration of labeled autologous natural killer cells to liver metastases in patients with colon carcinoma. J. Transl. Med. 2006;4:49. doi: 10.1186/1479-5876-4-49. [DOI] [PMC free article] [PubMed] [Google Scholar]
- 14.Meier R, Piert M, Piontek G, et al. Tracking of [18 F] FDG-labeled natural killer cells to HER2/neu-positive tumors. Nucl. Med. Biol. 2008;35(5):579–588. doi: 10.1016/j.nucmedbio.2008.02.006. [DOI] [PubMed] [Google Scholar]
- 15.Tavri S, Jha P, Meier R, et al. Optical imaging of cellular immunotherapy against prostate cancer. Mol. Imaging. 2009;8(1):15–26. [PubMed] [Google Scholar]
- 16.Sutton EJ, Henning TD, Pichler BJ, Bremer C, Daldrup-Link HE. Cell tracking with optical imaging. Eur. Radiol. 2008;18(10):2021–2032. doi: 10.1007/s00330-008-0984-z. [DOI] [PubMed] [Google Scholar]
- 17.Edinger M, Cao YA, Verneris MR, Bachmann MH, Contag CH, Negrin RS. Revealing lymphoma growth and the efficacy of immune cell therapies using in vivo bioluminescence imaging. Blood. 2003;101(2):640–648. doi: 10.1182/blood-2002-06-1751. [DOI] [PubMed] [Google Scholar]
- 18.Sutton EJ, Henning TD, Boddington S, et al. In vivo magnetic resonance imaging and optical imaging comparison of viable and nonviable mesenchymal stem cells with a bifunctional label. Mol. Imaging. 2010;9(5):278–290. [PMC free article] [PubMed] [Google Scholar]
- 19.Bulte JW, Kraitchman DL. Iron oxide MR contrast agents for molecular and cellular imaging. NMR Biomed. 2004;17(7):484–499. doi: 10.1002/nbm.924. [DOI] [PubMed] [Google Scholar]
- 20.Henning TD, Sutton EJ, Kim A, et al. The influence of ferucarbotran on the chondrogenesis of human mesenchymal stem cells. Contrast Media Mol. Imaging. 2009;4(4):165–173. doi: 10.1002/cmmi.276. [DOI] [PMC free article] [PubMed] [Google Scholar]
- 21.Bulte JW, Duncan ID, Frank JA. In vivo magnetic resonance tracking of magnetically labeled cells after transplantation. J. Cereb. Blood Flow Metab. 2002;22(8):899–907. doi: 10.1097/00004647-200208000-00001. [DOI] [PubMed] [Google Scholar]
- 22••.Thu MS, Bryant LH, Coppola T, et al. Self-assembling nanocomplexes by combining ferumoxytol, heparin and protamine for cell tracking by magnetic resonance imaging. Nat. Med. 2012;18(3):463–467. doi: 10.1038/nm.2666. [This heparin-protamine-ferumoxytol labeling method should facilitate the monitoring by MRI of infused or implanted cells in clinical trials] [DOI] [PMC free article] [PubMed] [Google Scholar]
- 23.Aboody K, Capela A, Niazi N, Stern JH, Temple S. Translating stem cell studies to the clinic for CNS repair: current state of the art and the need for a Rosetta stone. Neuron. 2011;70(4):597–613. doi: 10.1016/j.neuron.2011.05.007. [DOI] [PubMed] [Google Scholar]
- 24.Aboody KS, Bush RA, Garcia E, et al. Development of a tumor-selective approach to treat metastatic cancer. PLoS ONE. 2006;1(1):e23. doi: 10.1371/journal.pone.0000023. [DOI] [PMC free article] [PubMed] [Google Scholar]
- 25.Zhang Z, Van Den Bos EJ, Wielopolski PA, De Jong-Popijus M, Duncker DJ, Krestin GP. High-resolution magnetic resonance imaging of iron-labeled myoblasts using a standard 1.5-T clinical scanner. Magma. 2004;17(3–6):201–209. doi: 10.1007/s10334-004-0054-8. [DOI] [PubMed] [Google Scholar]
- 26••.Zhang Z, Hancock B, Leen S, et al. Compatibility of superparamagnetic iron oxide nanoparticle labeling for 1H MRI cell tracking with 31P MRS for bioenergetic measurements. NMR Biomed. 2010;23(10):1166–1172. doi: 10.1002/nbm.1545. [The result introduces the possibility of using localized 31P magnetic resonance spectroscopy to evaluate the viability of iron-labeled therapeutic cells as well as surrounding host tissue in vivo] [DOI] [PMC free article] [PubMed] [Google Scholar]
- 27.Mouli SK, Tyler P, Mcdevitt JL, et al. Image-guided local delivery strategies enhance therapeutic nanoparticle uptake in solid tumors. ACS Nano. 2013;7(9):7724–7733. doi: 10.1021/nn4023119. [DOI] [PMC free article] [PubMed] [Google Scholar]
- 28.Hsiao JK, Tai MF, Chu HH, et al. Magnetic nanoparticle labeling of mesenchymal stem cells without transfection agent: cellular behavior and capability of detection with clinical 1.5 T magnetic resonance at the single cell level. Magn. Reson. Med. 2007;58(4):717–724. doi: 10.1002/mrm.21377. [DOI] [PubMed] [Google Scholar]
- 29.Wai L-E, Garcia JA, Martinez OM, Krams SM. Distinct roles for the NK cell-activating receptors in mediating interactions with dendritic cells and tumor cells. J. Immunol. 2011;186(1):222–229. doi: 10.4049/jimmunol.1002597. [DOI] [PMC free article] [PubMed] [Google Scholar]
- 30.Sheu AY, Zhang Z, Omary RA, Larson AC. MRI-monitored transcatheter intra-arterial delivery of SPIO-labeled natural killer cells to hepatocellular carcinoma: preclinical studies in a rodent model. Invest. Radiol. 2013;48(6):492–499. doi: 10.1097/RLI.0b013e31827994e5. [DOI] [PMC free article] [PubMed] [Google Scholar]
- 31.Wang D, Gaba RC, Jin B, et al. Intraprocedural transcatheter intra-arterial perfusion MRI as a predictor of tumor response to chemoembolization for hepatocellular carcinoma. Acad. Radiol. 2011;18(7):828–836. doi: 10.1016/j.acra.2011.02.016. [DOI] [PMC free article] [PubMed] [Google Scholar]
- 32.Miyayama S, Yamashiro M, Shibata Y, et al. Variations in feeding arteries of hepatocellular carcinoma located in the left hepatic lobe. Jpn. J. Radiol. 2012;30(6):471–479. doi: 10.1007/s11604-012-0075-6. [DOI] [PubMed] [Google Scholar]
- 33.Gutova M, Frank JA, D'apuzzo M, et al. Magnetic resonance imaging tracking of ferumoxytol-labeled human neural stem cells: studies leading to clinical use. Stem Cells Transl. Med. 2013;2(10):766–775. doi: 10.5966/sctm.2013-0049. [DOI] [PMC free article] [PubMed] [Google Scholar]
- 34.Balakumaran A, Pawelczyk E, Ren J, et al. Superparamagnetic iron oxide nanoparticles labeling of bone marrow stromal (mesenchymal) cells does not affect their “stemness”. PLoS ONE. 2010;5(7):e11462. doi: 10.1371/journal.pone.0011462. [DOI] [PMC free article] [PubMed] [Google Scholar]
- 35.Dmowski WP, Gebel HM, Braun DP. The role of cell-mediated immunity in pathogenesis of endometriosis. Acta Obstet. Gynecol. Scand. 1994;59(Suppl. 1):7–14. [PubMed] [Google Scholar]
- 36.Cheng M, Chen Y, Xiao W, Sun R, Tian Z. NK cell-based immunotherapy for malignant diseases. Cell. Mol. Immunol. 2013;10(3):230–252. doi: 10.1038/cmi.2013.10. [DOI] [PMC free article] [PubMed] [Google Scholar]
- 37.Cerwenka A, Lanier LL. Natural killer cells, viruses and cancer. Nat. Rev. Immunol. 2001;1(1):41–49. doi: 10.1038/35095564. [DOI] [PubMed] [Google Scholar]
- 38.Yokoyama W. Natural killer cell immune responses. Immunol. Res. 2005;32(1–3):317–325. doi: 10.1385/IR:32:1-3:317. [DOI] [PubMed] [Google Scholar]
- 39.Alkins R, Burgess A, Ganguly M, et al. Focused ultrasound delivers targeted immune cells to metastatic brain tumors. Cancer Res. 2013;73(6):1892–1899. doi: 10.1158/0008-5472.CAN-12-2609. [DOI] [PMC free article] [PubMed] [Google Scholar]
- 40.Kute T, Savage L, Stehle J, Jr, et al. Breast tumor cells isolated from in vitro resistance to trastuzumab remain sensitive to trastuzumab anti-tumor effects in vivo and to ADCC killing. Cancer Immunol. Immunother. 2009;58(11):1887–1896. doi: 10.1007/s00262-009-0700-0. [DOI] [PMC free article] [PubMed] [Google Scholar]
- 41.Tonn T, Becker S, Esser R, Schwabe D, Seifried E. Cellular immunotherapy of malignancies using the clonal natural killer cell line NK-92. J. Hematother. Stem Cell Res. 2001;10(4):535–544. doi: 10.1089/15258160152509145. [DOI] [PubMed] [Google Scholar]
- 42.Meehan KR, Talebian L, Tosteson TD, et al. Adoptive cellular therapy using cells enriched for NKG2D+CD3+CD8+T cells after autologous transplantation for myeloma. Biol. Blood Marrow Transplant. 2013;19(1):129–137. doi: 10.1016/j.bbmt.2012.08.018. [DOI] [PMC free article] [PubMed] [Google Scholar]
- 43.Sutlu T, Alici E. Natural killer cell-based immunotherapy in cancer: current insights and future prospects. J. Intern. Med. 2009;266(2):154–181. doi: 10.1111/j.1365-2796.2009.02121.x. [DOI] [PubMed] [Google Scholar]
- 44.Kmieciak M, Basu D, Payne KK, et al. Activated NKT cells and NK cells render T cells resistant to myeloid-derived suppressor cells and result in an effective adoptive cellular therapy against breast cancer in the FVBN202 transgenic mouse. J. Immunol. 2011;187(2):708–717. doi: 10.4049/jimmunol.1100502. 1950. [DOI] [PMC free article] [PubMed] [Google Scholar]


