Abstract
Dye-protein fluoromodules consist of fluorogenic dyes and single chain antibody fragments that form brightly fluorescent noncovalent complexes. This report describes two new bichromophoric dyes that extend the range of wavelengths of excitation or emission of existing fluoromodules. In one case, a fluorogenic thiazole orange (TO) was attached to an energy acceptor dye, Cy5. Upon binding to a protein that recognizes TO, red emission due to efficient energy transfer from TO to Cy5 replaces the green emission observed for monochromophoric TO bound to the same protein. Separately, TO was attached to a coumarin that serves as an energy donor. The same green emission is observed for coumarin-TO and TO bound to a protein, but efficient energy transfer allows violet excitation of coumarin-TO, versus longer wavelength, blue excitation of monochromophoric TO. Both bichromophores exhibit low nanomolar KD values for their respective proteins, >95% energy transfer efficiency and high fluorescence quantum yields.
INTRODUCTION
Advances in fluorescent protein labeling and imaging have significantly expanded our understanding of various cellular structures and functions. Notably, the development of genetically encodable fluorescent tags sparked by the revolutionary discovery of autofluorescent proteins (FPs) has enabled the dynamic tracking of target proteins in living cells.1, 2 Although FPs continue to be the most popular and versatile imaging tool, their utility in real-time studies is limited by their inherently slow maturation times.3 In addition, the interdependence of spectral and structural properties arising from the covalent linkage between the fluorophore and protein matrix poses challenges to fine-tuning FPs’ color, brightness and photostability.4 Furthermore, the current lack of photostable near-infrared-fluorescing proteins precludes their use for deep tissue imaging.5 These limitations have motivated the development of alternative technologies that rely on the binding of exogenous fluorescent dyes to genetically encoded peptide or small-protein tags.6 Most prominent and frequently used tag-based strategies include hapten-antibody systems,7 biarsenical fluorophores FlAsH or ReAsH,8 and various chemoselective reactions that exploit specific covalent interactions between synthetic ligands and receptors such as SNAP-tag,9–13 BL-tag,14 PYP-tag15 and TMP-tag.3, 16, 17 In addition to the vast potential to finely tune spectral properties via defined chemical modifications, these chemistry-based approaches offer precise control of protein labeling with high temporal and spatial resolution.6
We recently reported a new chemical tagging platform consisting of genetically encodable single chain variable fragment (scFv) antibody proteins and fluorogenic dyes.18 The scFv is referred to as a fluorescence-activating protein (FAP) and the combination of a FAP with a dye yields a fluoromodule. Prior to interacting, unbound probes do not fluoresce, resulting in low background fluorescence signals. Significant fluorescence enhancement occurs when the fluorogenic dye interacts with its associated FAP, whereby the dye is constrained in the viscous environment of the protein-binding pocket.18 Cognate FAP-dye pairs are obtained using a library of scFv proteins that are displayed on the surface of yeast.19 Addition of a fluorogenic dye leads to surface-localized fluorescence from those yeast that express dye-binding FAPs. Fluorescence activated cell sorting provides a powerful method for isolating the desired (but rare) yeast clones from the large excess of yeast that express nonfunctional scFv proteins. FAPs able to enhance the fluorescence of our dyes by up to 4 orders of magnitude and binders with KD values in the low nanomolar to high picomolar range have been isolated.18, 20
Most of our current fluoromodules are based on fluorogenic cyanine or triphenylmethane monochromophores.18, 20–23 These fluorophores typically exhibit relatively small Stokes shifts, meaning that their fluorescence emission spectra are relatively close to the wavelength of light used to excite the dye. This can lead to considerable background due to cellular autofluorescence and light scattering, diminishing the quality of a microscope image. To overcome this generic problem, we have coupled FAP technology with Förster resonance energy transfer (FRET) principles to create conditional wavelength-shifting fluoromodules. The “FAP-FRET” approach has been exploited by Bruchez and colleagues to create several multichromophore dyes that exhibit (a) amplified fluorescence,24 (b) pH sensitivity25 or (c) color shifting.26 Our aim here is to extend the scope of FAP-FRET methods based on the use of different fluorogenic donor-acceptor combinations to provide new color tags with low fluorescence background, highly efficient energy transfer and fluorescence activation, as well as high specificity for the tagged protein.
RESULTS
Rationale
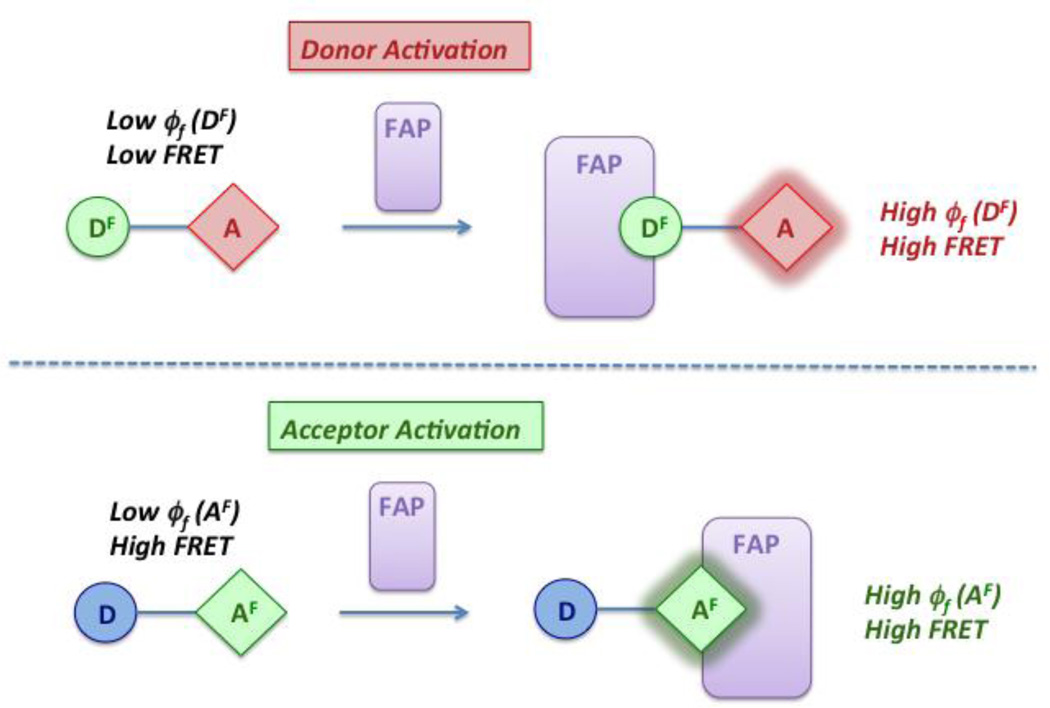
There are two possible approaches to bichromophoric compounds for use in energy transfer-based wavelength-shifting fluoromodules. In the first design, a fluorogenic donor (DF) is covalently linked to an energy acceptor dye (A). Ideally, excitation of DF results in efficient energy transfer and acceptor fluorescence only when the donor is bound to its cognate FAP partner due to the low quantum yield of DF in the absence of the FAP (Scheme 1, top). In contrast, our second bichromophore features an energy donor (D) connected to a fluorogenic acceptor (AF). Energy transfer can be efficient even in the absence of a FAP, but the low quantum yield of AF results in minimal acceptor fluorescence. Binding of a FAP to AF enhances the quantum yield >100-fold, resulting in significant fluorescence in the acceptor channel (Scheme 1, bottom).
Scheme 2.
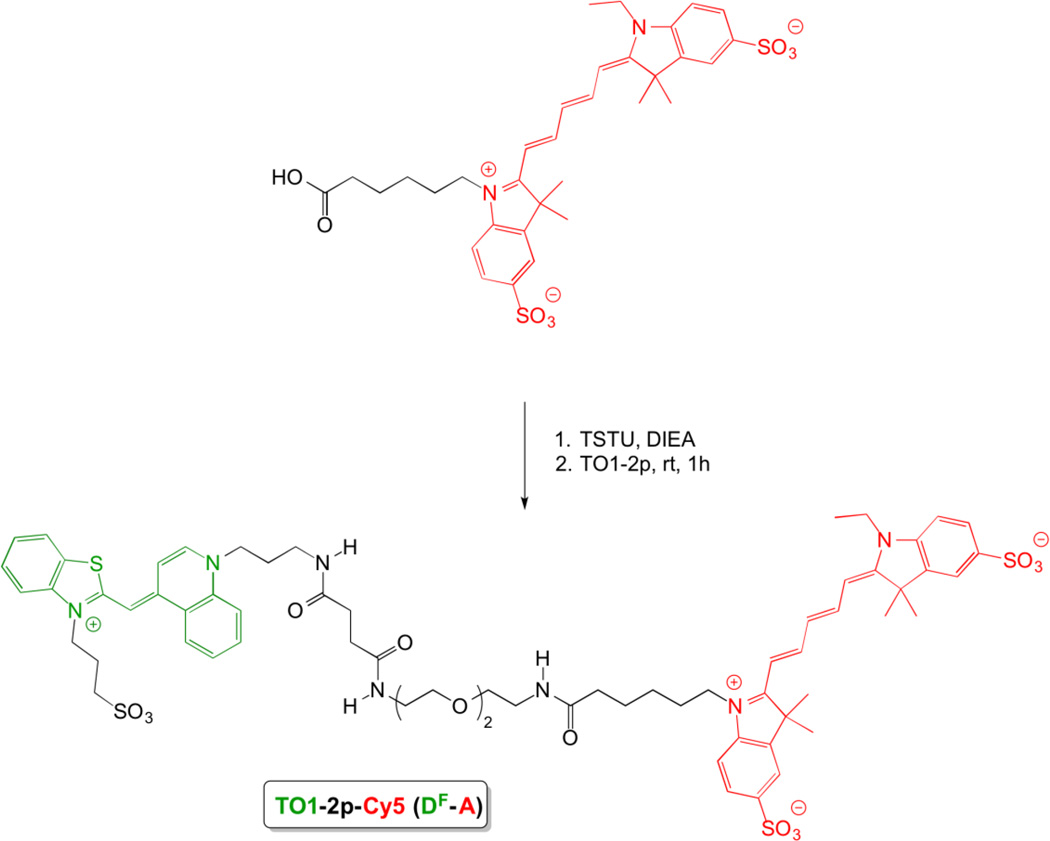
Synthesis of bichromophoric TO1-2p-Cy5 (DF-A)
Synthesis
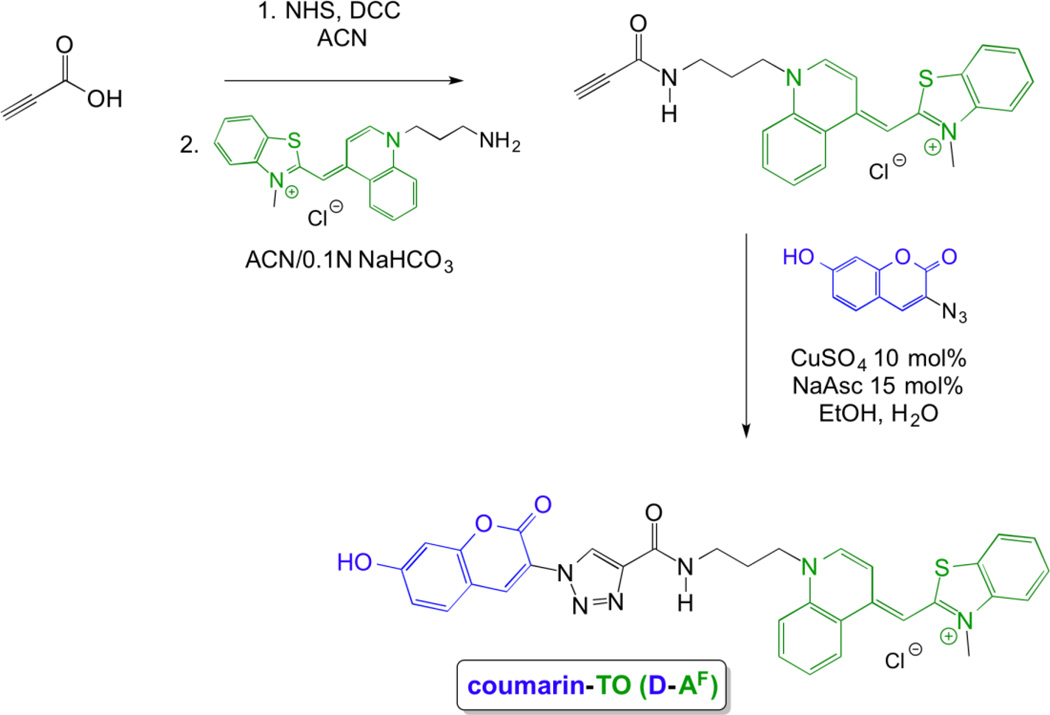
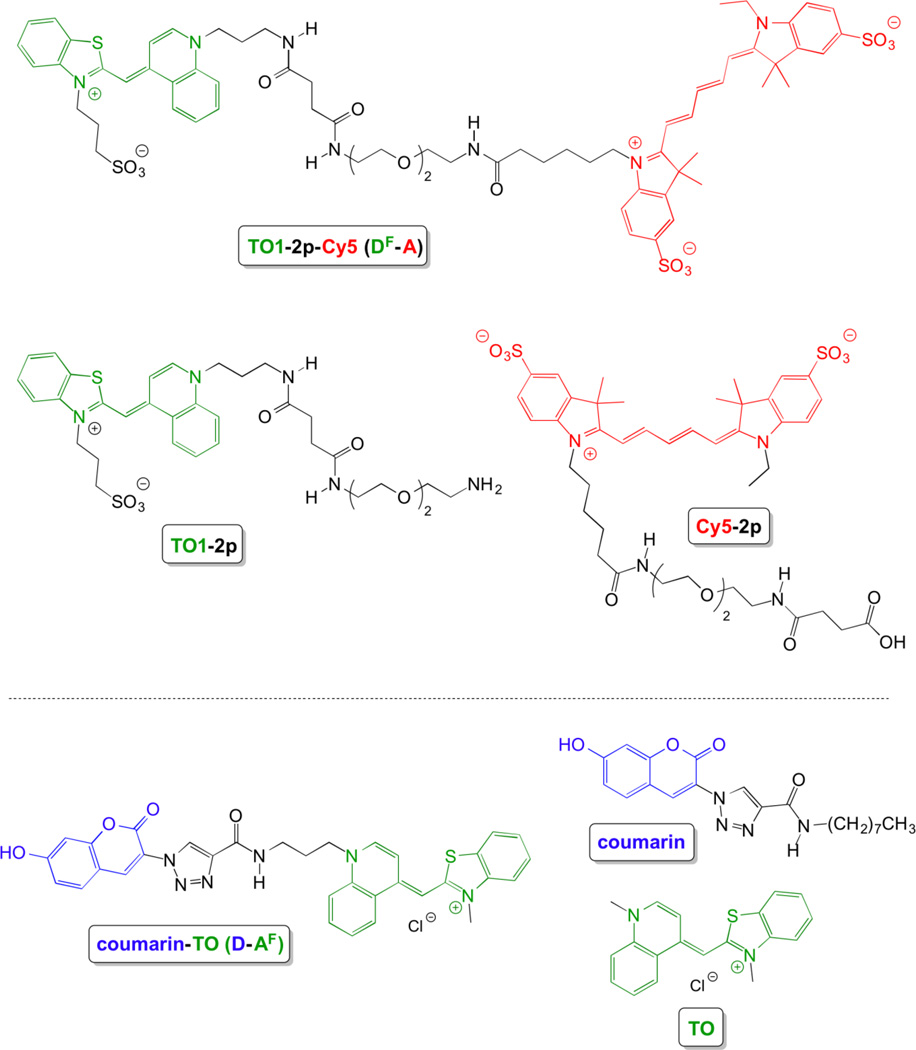
The bichromophoric dyes and relevant monochromophoric model compounds are shown in chart 1. Bichromophore DF-A consists of a fluorogenic thiazole orange (TO) donor conjugated through a flexible diethylene glycol (2p) linker to a Cy5 acceptor. We refer to DF as TO1 to distinguish it from TO, which has the same chromophore but a methyl substituent rather than a propyl sulfonate on the benzothiazole nitrogen. The second bichromophore (D-AF) features a fluorescent coumarin donor connected to a fluorogenic thiazole orange acceptor via a triazole linkage.
Scheme 1.
Bichromophoric energy transfer dyes combine with FAPs to generate new fluoromodules.
The compounds used in this study were synthesized according to Schemes 2 and 3. (Full synthetic routes are shown in Supporting Information Schemes S1 and S2.) In synthesizing TO1-2p-Cy5 (Scheme 2), we found that the best coupling strategy involved as the first step the introduction of the 2p-linker at the TO1-site; this synthesis was reported previously.18 The 2p-extended chromophore exhibits good DMF solubility, in contrast to its parental chromophore, TO1. The carboxylic acid group of the Cy5 was activated using TSTU and then reacted with TO1-2p to give the bichromophoric dye in 60% yield. The coupling yield by this route is much higher than the alternative, in which a TO1 carboxylic acid, which requires an aqueous medium for solubility, is reacted with Cy5-2p.
Scheme 3.
Synthesis of bichromophoric coumarin-TO (D-AF)
Figure 3.
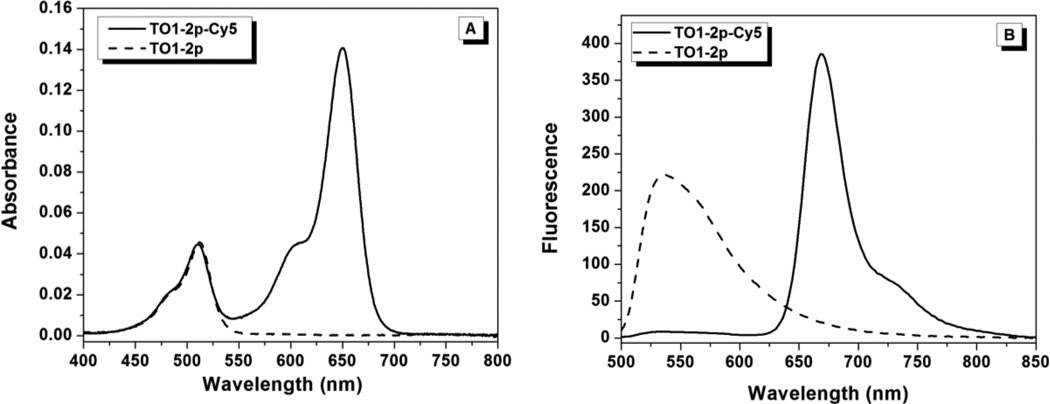
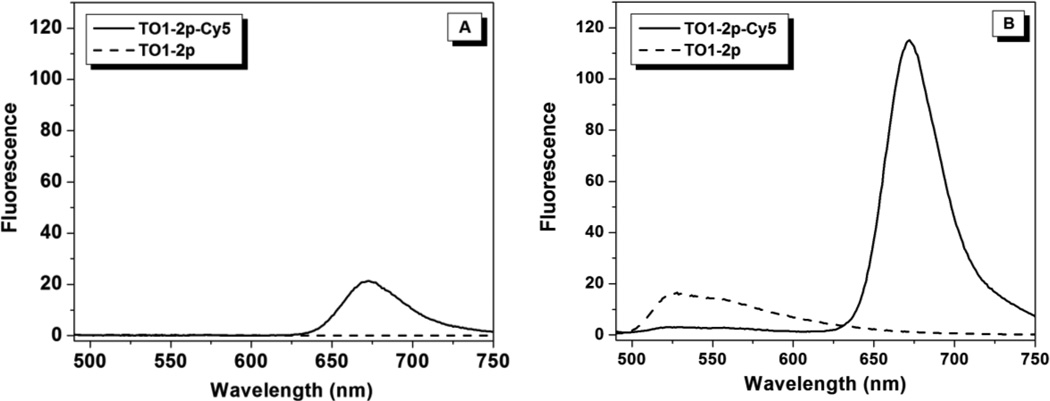
(A) Absorbance spectra of 1.0 µM TO1-2p or TO1-2p-Cy5 in the presence of 1.0 µM FAP HL1.0.1-TO1. (B) Fluorescence emission spectra recorded for 200 nM TO1-2p and TO1-2p-Cy5 in the presence of 2 µM FAP HL1.0.1-TO1. Samples were excited at 488 nm.
A different approach was taken in the synthesis of the coumarin-TO bichromophoric dye (D-AF) that employed a shorter linker and the use of click chemistry (Scheme 3). Coumarin-TO was synthesized through NHS/DCC coupling of TO-amine with propiolic acid to give the TO-alkyne, which was then subjected to standard copper(I) catalyzed azide alkyne cycloaddition conditions27 in the presence of 3-azido-7-hydroxycoumarin28 to give the coumarin-TO bichromophoric dye in 70% yield. We also synthesized various monochromophoric dyes (see supporting information), which were used as model compounds for spectroscopic comparisons to the bichromophoric dyes.
Scheme 3.
Folded conformation of bichromophore leads to moderate FRET prior to FAP binding. (An analogous scheme could be drawn for the D-AF bichromophore coumarin-TO.)
Spectroscopic Characterization of TO1-2p-Cy5 (DF-A)
TO1-2p-Cy5 was designed to function as shown at the top of Scheme 1, i.e. with donor activation upon binding to a FAP. The thiazole orange analogue TO1 serves as the light absorber for wavelengths below 550 nm and subsequently donates energy to the longer wavelength Cy5 acceptor chromophore.29 The low fluorescence quantum yield (φf) of TO1 in solution30 (2×10⁻⁴) should lead to weak energy transfer to Cy5 in the absence of the FAP, whereas binding to an appropriate FAP, which increases φf for TO1 >1000-fold,18 is expected to yield greatly enhanced energy transfer to Cy5 in the bichromophoric construct.
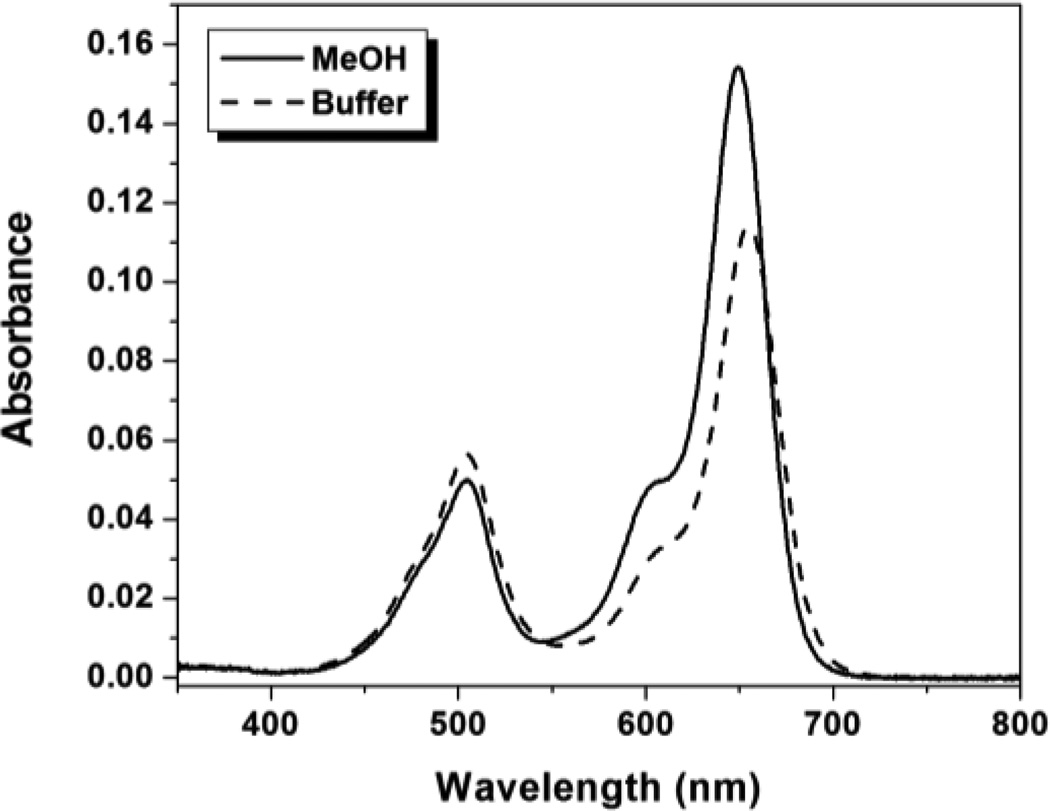
Figure 1 shows absorption spectra for TO1-2p-Cy5 in aqueous buffer and MeOH. The ratio of the Cy5:TO1 peaks differs in the two solvents with the lower value in buffer. In contrast, the TO1-2p monochromophore shows slightly higher absorbance in methanol, while the Cy5-2p monochromophore shows a considerably smaller increase in absorbance in methanol versus buffer compared to what is observed in Figure 1 for the bichromophore (supporting information, Figure S27). These results indicate that the two chromophores in TO1-2p-Cy5 interact with one another in an aqueous environment. In addition, we measured UV-vis spectra of TO1-2p-Cy5 at 5-fold higher concentration, but the spectral shape did not change significantly (Figure S28). This indicates that the perturbations evident in Figure 1 are due to intramolecular association of the TO1 and Cy5 chromophores, rather than intermolecular aggregation.
Figure 1.
UV-vis absorbance spectra of 1.0 µM TO1-2p-Cy5 in aqueous buffer and MeOH.
The interaction between the two chromophores is also evident in emission spectra recorded upon direct excitation of Cy5. In buffer, the Cy5 emission is approximately four-fold lower in the bichromophore TO1-2p-Cy5 compared with monochromophoric Cy5-2p, whereas in methanol, the difference is only 1.2-fold (Figure S29). These results indicate that the proximity of TO1 in the bichromophore can quench Cy5, whether the latter is excited directly or by energy transfer, and that this quenching is reasonably efficient in aqueous buffer, presumably due to the flexible 2p linker allowing the molecule to fold into a structure that promotes close interaction between the chromophores.
Excitation of TO1-2p-Cy5 at 480 nm should lead to Cy5 emission in the 650–700 nm range if energy transfer occurs. As shown in Figure 2A, monochromophoric TO1-2p exhibits almost no emission when excited at 480 nm. This is consistent with the low fluorescence quantum yields associated with unsymmetrical cyanines due to torsional motions that rapidly deactivate the excited state.31, 32 Observation of substantial Cy5 emission when exciting TO1-2p-Cy5 at 480 nm (Figure 2A, solid line) indicates that some energy transfer occurs in spite of the weakly fluorescent donor TO1. (Excitation of monochromophoric Cy5-2p at 480 nm does not lead to fluorescence.) This energy transfer is likely due to the close distance between the two chromophores, as described above. Interaction (e.g. pi stacking) between the TO1 donor and Cy5 acceptor could result in an enhanced φf for TO1, analogous to the higher φf reported for a dimeric oxazole yellow dye in which the two chromophores can pi-stack with one another, compared with the corresponding monomeric version.33 In addition, there are other examples in the literature of energy transfer from weakly or non-fluorescent donors to covalently attached acceptors.34, 35 In one notable example, an anthraquinone-perylenebisimide bichromophore exhibited very efficient energy transfer in spite of the anthraquinone donor being nonfluorescent on its own, although a one-bond linker and appropriate regiochemistry were required to achieve highly efficient energy transfer.35
Figure 2.
Fluorescence emission (λex = 480nm) spectra for TO1-2p and TO1-2p-Cy5 in aqueous solution (A) and in 90% v/v glycerol/water (B).
The energy transfer that gave rise to Cy5 fluorescence in buffer (Figure 2A) is significantly increased in a viscous solvent such as 90% v/v glycerol/buffer based on the 5-fold higher Cy5 emission (Figure 2B). The quantum yield of monochromophoric Cy5-2p is only enhanced ca. 25% in glycerol/buffer under the same conditions (Figure S30), so the large enhancement observed for the bichromophore is attributed to the higher quantum yield of the TO1 donor (compare dashed lines in Figures 2A and 2B). In addition, there is reduced quenching of Cy5 by TO1, as indicated by 5-fold greater fluorescence upon direct excitation of Cy5 in glycerol versus buffer (Figure S30), consistent with the findings for methanol.
The utility of TO1-2p-Cy5 as a wavelength-shifting fluorogen was next demonstrated in the context of protein-based fluoromodules. The bichromophore is activated by the FAP HL1.0.1-TO1, an scFv antibody fragment previously selected for binding to TO1-2p.18 The similarity of the TO1 absorption bands in Figure 3A indicates that the mono- and bichromophoric dyes bind to the FAP in similar environments. Nevertheless, as detailed in Table 1, the KD is ca. 40-fold higher for TO1-2p-Cy5 (12 nM) than for TO1-2p (0.3 nM), indicating a modest degree of steric and/or electronic repulsion between the protein and the Cy5 acceptor dye. Nonetheless, the low nanomolar affinity of HL1.0.1 for TO1-2p-Cy5 is sufficient for the spectroscopy and imaging experiments described below.
Table 1.
Properties of bichromophores TO1-2p-Cy5 and coumarin-TO
| TO1-2p | TO1-2p-Cy5 | TO | Coumarin-TO | |
|---|---|---|---|---|
| ε (M−1cm−1)a | 49,500 | 49,500 (TO1) 200,000 (Cy5) |
63,000 | 17,300 (coumarin) 49,200 (TO) |
| λabs (nm)b | 504 | 511 (TO1) 650 (Cy5) |
505 | 400 (coumarin) 508 (TO) |
| KD (nM)b | 0.3 | 12 | 0.17 | 1.1 |
| Φb | 0.47 | 0.37 | 0.89 | 0.87 |
| FRET%b | N/A | 96% | N/A | 99% |
Determined in MeOH.
Determined in the presence of cognate FAP.
Figure 3B shows emission spectra (λex = 488 nm) recorded for TO1-2p-Cy5 and the monochromophoric dye TO1-2p in the presence of the FAP. As reported previously, fluorescence from TO1-2p is strongly enhanced by the protein and exhibits an emission maximum of 536 nm.18 Meanwhile, performing the same experiment with TO1-2p-Cy5 demonstrates that the TO1 fluorescence is strongly quenched, but is replaced by sensitized Cy5 fluorescence at 668 nm due to energy transfer. The efficiency of energy transfer, based on the extent of TO1 quenching, is 96%. The Cy5 emission maximum is also red-shifted relative to the spectrum recorded in buffer with direct excitation of Cy5, indicating that Cy5 is not extended far away from the protein but rather is in close proximity to the FAP, as suggested by the higher KD value for TO1-2p-Cy5 relative to TO1-2p (Table 1).
Confocal Microscopy
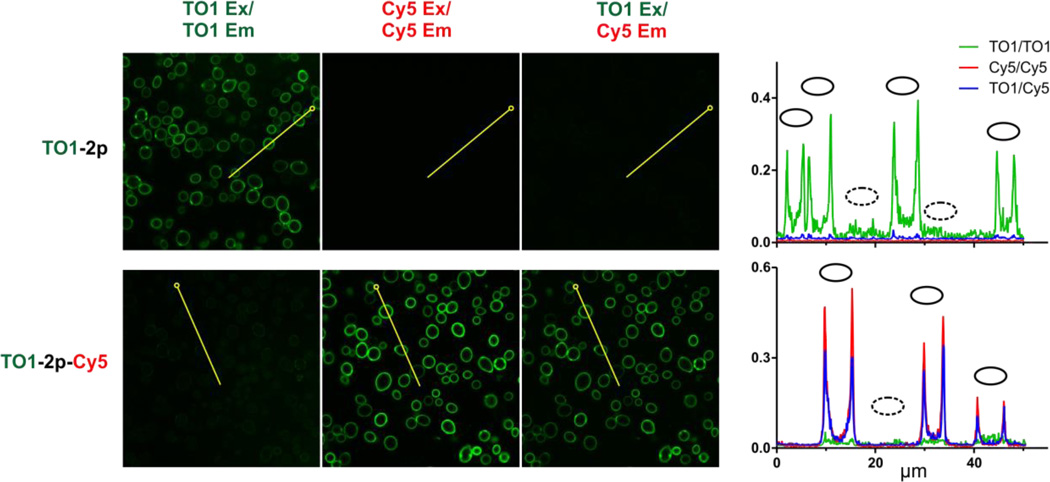
The net effect of using TO1-2p-Cy5 is to shift the emission wavelength of the TO1-based fluoromodule by ca. 130 nm to the red as shown in Figure 3B. The large spectral shift is useful for confocal microscopy, where images of yeast that display the HL1.0.1-TO1 FAP on the cell surface were stained with the cell-impermeant TO1-2p or TO1-2p-Cy5 dyes (Figure 4). Staining with the monochromophoric reagent TO1-2p yields fluorescence only in the green channel. In contrast, TO1-2p-Cy5 yields very weak TO1 fluorescence in the green channel but strong red channel fluorescence when Cy5 is directly excited or when TO1 is excited, consistent with the efficient energy transfer observed spectroscopically. Quantitative analysis of the images demonstrates the improved signal-to-noise obtained from staining with the bichromophoric reagent (right panel, Figure 4).
Figure 4.
Visualization of energy transfer using yeast surface-displayed HL1.0.1-TO1 FAP. Yeast expressing FAP on the cell surface were excited at 488 nm (TO1 Ex) or 633 nm (Cy5 Ex) and visualized by laser confocal microscopyusing either 100 nM TO1-2p or bichromophore hore TO1-2p-Cy5. Shown left to right are donor (500–550 nm BP filter), acceptor (650–710 nm BP), and FRET (650–710 nm BP) channels. At the far right are shown scan profiles of these channels through cells along 50 µm transects (horizontal axis), traced in yellow with open circles marking transect origins. Vertical axes plot per pixel signal represented as proportion of 12-bit intensity scale. Solid ovals mark positions of fluorescent cells and dotted ovals mark positions of dark cells that do not express FAP due to absence of encoding plasmid. Control images that localize dark cells and microscopy parameters are shown in Figure S26 and Table S2.
Spectroscopic Characterization of Coumarin-TO (D-AF)
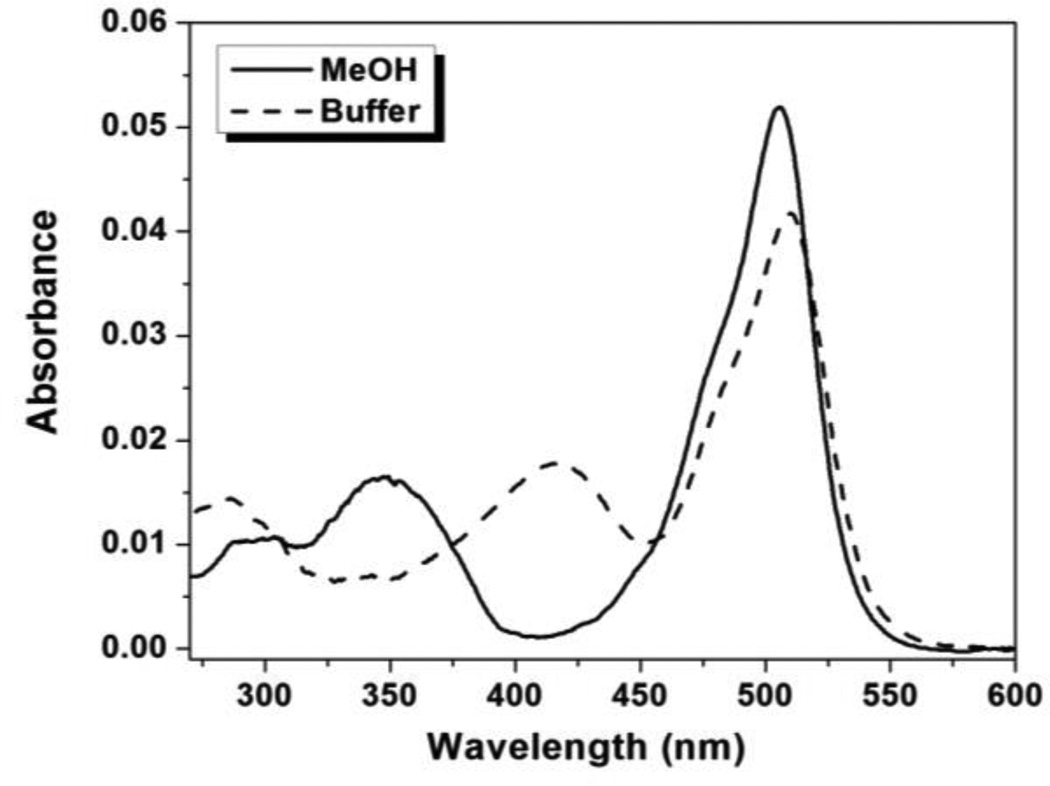
chart 1 shows the structure of our second bichromophore, coumarin-TO, along with the parental coumarin and TO controls. As noted above, TO differs from TO1 in the nature of substituents attached to the benzothiazole heterocycle (methyl vs. propylsulfonate for TO and TO1, respectively). Although this structural change does not alter the spectral properties of the fluorophore, it might affect the binding of certain dye-FAP pairs (vide infra). Figure 5 shows absorption spectra for the bichromophoric coumarin-TO compound in aqueous buffer and MeOH. While the position of the absorption peak of TO is similar in the two solvents, the coumarin absorption band noticeably red-shifts from 350 to 420 nm in aqueous buffer. A similar trend was observed in the absorption spectrum of the monochromophoric coumarin (Figure S31). These bathochromic shifts are likely due to deprotonation of the aromatic alcohol in the coumarin unit in PBS solution (pH = 7.4), consistent with previous reports on the red-shifted absorption of deprotonated 7-hydroxycoumarin in comparison to the neutral molecular species.36
Figure 5.
UV-Vis absorbance spectra for coumarin-TO in aqueous buffer and MeOH.
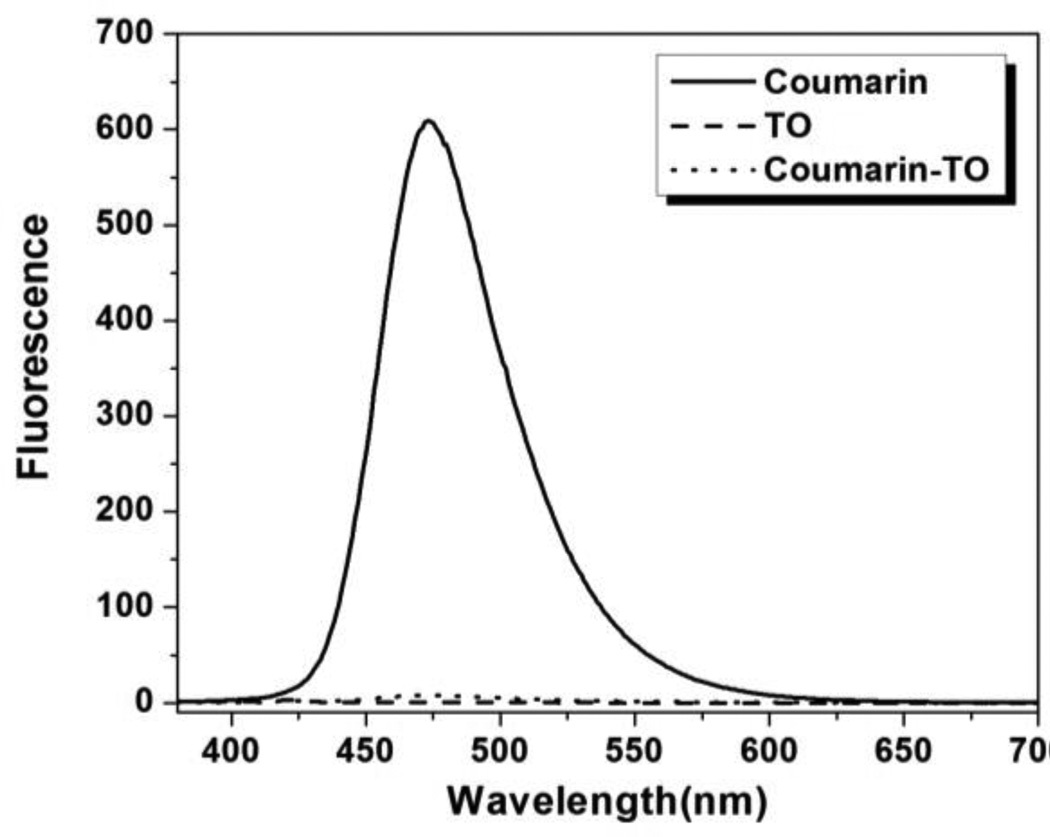
We next studied the fluorescence properties of free coumarin-TO in an aqueous environment (Figure 6). Direct excitation of the coumarin monochromophore at 370 nm yields the expected emission band that peaks at 470 nm. On the other hand, bichromophoric coumarin-TO exhibits almost no fluorescence when excited at the same wavelength. The lack of fluorescence signal is expected since, in the absence of a TO-binding FAP, the TO acceptor can readily quench the excited coumarin, but then nonradiatively dissipates energy rather than fluorescing. Moreover, the nearly complete quenching of coumarin’s emission suggests a highly efficient (>95%) energy transfer from the donor to the acceptor even in the absence of a cognate FAP.
Figure 6.
Fluorescence emission spectra (λex= 370 nm) for coumarin, TO and coumarin-TO in aqueous solution.
Interestingly, in 90% glycerol, where TO fluorescence should be activated by the viscous solvent, we observe a four-fold increase in fluorescence from bichromophoric coumarin-TO versus the monochromophore TO (Figure S32). This large increase occurs in spite of a 30% decrease in absorbance for the bichromophore. These results suggest that, similar to TO1-2p-Cy5, some degree of interaction occurs between the two chromophores in coumarin-TO. However, unlike the DF-A bichromophore TO1-2p-Cy5, where interaction leads to quenching of the Cy5 acceptor, in the D-AF bichromophore coumarin-TO, interaction leads to significantly enhanced fluorescence from the TO acceptor.
The photophysical properties of coumarin-TO in the presence of a FAP were next examined. TO gave weaker fluorescence in the presence of the protein HL1.0.1-TO1, compared with the propylsulfonate-substituted TO1 (Figure S33), so we used a different FAP for these experiments. Specifically, R1, a recombinant scFv originally selected for a photostable derivative of TO21 was used for these experiments based on its ability to bind and activate TO with subnanomolar affinity (174 pM) and strongly enhanced fluorescence quantum yield (φf = 0.89, a 4400-fold increase) (Table 1). Interestingly, R1 showed minimal activation of TO1 (Figure S33), further illustrating the sensitivity of these proteins toward the nature of the substituent on the benzothiazole heterocycle of thiazole orange dyes.
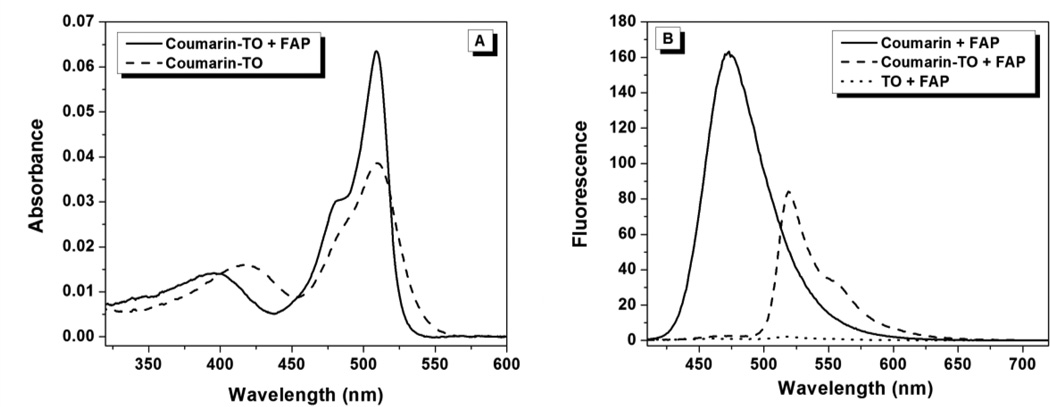
Figure 7 compares the absorption and emission spectra of coumarin-TO in the absence and presence of R1. In the presence of the FAP, the TO absorption band becomes markedly sharpened with a defined vibronic shoulder at 475 nm. A similar effect was observed for monochromophoric TO (Figure S34). These results confirmed that the TO moiety was tightly constrained within the binding pocket of the FAP, reducing the conformational freedom that contributes to spectral broadening. Similar to TO1-2p-Cy5 with its cognate FAP, a modest reduction in affinity was observed for coumarin-TO relative to TO (KD = 1.1 nM versus 174 pM, Table 1), again suggesting that steric hindrance arising from the close proximity of the donor and acceptor affects the binding of the bichromophoric dyes to their respective FAPs, although the relatively high affinities for the monochromophores provides considerable tolerance for binding of bichromophoric derivatives.
Figure 7.
(A) Absorption spectra of TO and coumarin-TO in the presence of R1 FAP. (B) Fluorescence emission spectra (λex= 400 nm) of coumarin, TO and coumarin-TO in the presence of R1.
Fluorescence emission spectra of coumarin, TO and coumarin-TO in the presence of excess R1 were recorded using 400 nm (coumarin) excitation (Figure 7B). The efficiency of energy transfer from coumarin to TO, based on the decrease in the donor emission peak, is ca. 99% and leads to strong, sensitized TO emission. (Excitation of TO alone at 400 nm leads to very weak emission.)
Confocal Microscopy
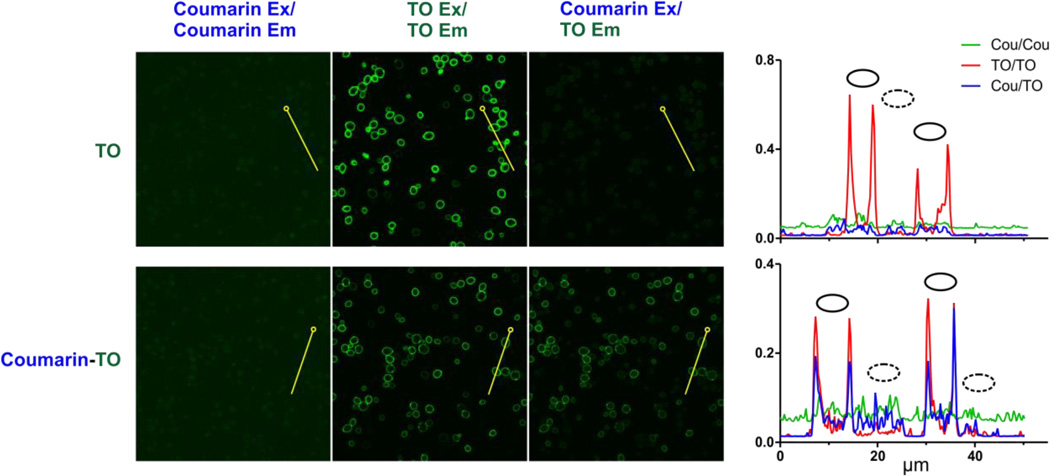
As illustrated in Figure 8, yeast cells expressing the R1 protein on their surface were imaged with either 10 nM coumarin-TO or monochromophoric TO control. As expected, direct excitation of TO using a 488 nm laser leads to bright fluorescence signals in both stained samples (center column). When excited at 405 nm, no signal is observed in the 420–480 nm range due to (a) lack of absorbance by monochromophoric TO and (b) efficient energy transfer for coumarin-TO. When the samples were excited at 405 nm (coumarin) and emission monitored at 505–550 nm (TO), the bichromophoric dye exhibited strong staining of the yeast surface (lower right image), reflecting the efficient energy transfer.
Figure 8.
Visualization of energy transfer using yeast surface surface-displayed R1 FAP. Confocal microscopy imaging was carried out in the presence of 10 nM TO control (top) or bichromophore Coumarin Coumarin-TO bottom). Samples were excited using either 405 nm (Coumarin Ex) or 488 nm (TO Ex) lasers. Three different channels were examined: donor channel (420–480 nm BP filter, left), acceptor channel (505–550 nm BP, middle) and FRET channel (505–550 nm BP, right).At the far right are shown scan profiles of these channels through cells along 50 µm transects (horizontal axis), traced in yellow with open circles marking transect origins. Vertical axes plot per pixel signal represented as proportion of 16 16-bit intensity scale. Solid ovals mark positions of fluorescent cells and dotted ovals mark positions of dark cells that do not express FAP due to absence of encoding plasmid. Control images that lo localize dark cells and other microscopy parameters are shown in Figure S26 and Table S2..
DISCUSSION
The ability to track target proteins in real time is fundamental to understanding dynamic events in living cells.6 Although fluorescent protein technology remains one of the most powerful and commonly used tools in cell biology, the inherently slow maturation time due to the post-translational chemical reactions needed to form the fluorophore as well as the susceptibility to oligomerization places limitations on the use of FPs in real-time imaging.3 When compared to synthetic probes that utilize the best organic fluorophores, FPs generally have lower brightness and photostability (collectively known as photon output), leaving room for improvement for experiments that require single-molecule resolution and/or high sensitivity.
On the other hand, the key problem in labeling proteins using chemical tags arises from the high fluorescence background of the unbound probes. Thus, extensive washing prior to imaging is often required to improve signal-to-noise ratio37 but still may not result in the complete elimination of non-specific binding.38, 39 More importantly, the necessity of a wash-out step prevents rapid and continuous detection of target protein, hence defeating the purpose of monitoring biomolecules in real time.
The fluorogenic bichromophores and genetically encodable FAPs described above represent a strategy to rationally design a class of fluorescent labels that overcome some of these limitations. The use of fluorogenic dyes, which become fluorescent only after binding to the cognate FAP, not only lowers the fluorescence background, but also reduces the labeling time by obviating the need to remove excess probes. As a result, we are able to visualize cell surface labeling immediately after the addition of appropriate bichromophores without washing (Figures 4 and 8). The use of FRET-capable bichromophores provides the opportunity to further improve signal-to-noise, due to the red-shifting of the emission relative to simpler monochromophoric dyes. The sharp contrast between non-expressing and FAP-expressing yeast cells (Figures 4,8 and S26) confirms the lack of fluorescence background in the absence of target protein. In addition, the high FRET efficiency (>95%) achieved in our bichromophoric systems leads to low signal observed in both control donor channels.
Although the results validate the strategy depicted in Scheme 1, the reality is somewhat more complicated. For example, the spectral data indicate that the TO1 and Cy5 chromophores interact, based on perturbation of the UV-vis spectra and quenching of Cy5 fluorescence in the bichromophore. Similarly, the 4-fold higher fluorescence of TO when linked to coumarin, even when directly exciting TO, indicates interaction between the two chromophores in coumarin-TO. Thus, it is likely that the bichromophore molecules adopt a folded conformation in water, bringing the two chromophores into close proximity before unfolding in order to allow the TO or TO1 fluorogen to bind to the FAP (Scheme 3).
Chart 1.
Chemical structures of bichromophoric dyes and monochromophoric model compounds.
It should be noted that the concept of fluorogenic probes has been previously exploited for live-cell protein imaging. Notable systems include the tetracysteine biarsenicals FlAsH and ReAsH,1, 8 the intramolecular association PYP tag,15 the FRET-quenched SNAP-tags, 11–13 the BL-tag14 and most recently the fluorogenic split inteins.4 Aside from the acute toxicity of arsenic, tetracysteine tags display non-specific affinity for isolated thiols,5 which counter-productively necessitates a lengthy washout.38 Moreover, ReAsH is known to generate reactive singlet oxygen species, contributing to the overall photo-instability of the examined system. Drawbacks of other FRET-based quenching approaches result from the slow kinetics of covalent interactions between the fluorogens and protein tags. This typically requires high probe concentration (e.g. at least 500 nM for BL-tag) and lengthy incubation time6, 37 relative to our immediate fluorescence response with low nanomolar concentrations of bichromophores. Further, the irreversibility of covalent bond formation in other fluoromodule technologies prevents the exchange of photobleached probes with fresh ones, a mechanism that has been shown to improve the photostabilty of FAP-based systems.22 Above all, with thousand-fold fluorescence enhancements and high FRET efficiency, our FAP-FRET design compares favorably to the fluorogenic SNAP-tag (<100-fold)12, 13 and PYP-tag (20-fold).15 A recent attempt to improve fluorescence signal for SNAP-tag technology results in ca. 300-fold activation via the use of a FAPL probe.11
The different binding affinities and emission colors of TO1-2p-Cy5 and TO1-2p in complex with HL1.0.1-TO1 FAP has recently been exploited to develop a quantitative pulse-chase flow cytometric screening technology that monitors in real time the internalization of a GPCR receptor.40 In this protocol, the FAP is fused to an extracellular domain of the ADRB2 receptor expressed on the surface of a mammalian cell. A pulse using TO1-2p-Cy5 enables one to detect the uptake of receptor into endocytic vesicles upon agonist stimulation, followed by a chase with TO1-2p that labels receptor remaining on the surface. This method was used to follow receptor desensitization and resensitization.
In other work, TO1 was conjugated to a pH-dependent version of Cy5, yielding a DF-A bichromophore that exhibits green emission from TO1 when bound to an appropriate FAP at neutral or basic pH (where the Cy5 is deprotonated and therefore inactive as an energy acceptor), but red emission at acidic pH, where Cy5 protonation promotes FRET. This property was used to monitor endocytic cell uptake of FAP-protein fusions.25
Bruchez and colleagues have documented the effectiveness of FAP-FRET systems based on FAP activation of fluorogenic malachite green acceptors for imaging proteins in live cells. For example, conjugation of 1, 2 or 4 Cy3 donor dyes to a MG fluorogen yields dendritic (DF)n-A “dyedrons” that exhibit strong red emission when the MG fluorogen is bound to a cognate FAP.24 Moreover, the presence of multiple Cy3 donors leads to amplified emission due to the higher absorbance cross section at donor wavelengths. In a second example, linking MG to tetramethylrhodamine yields D-AF bichromophores with efficient FRET and red emission.26 The authors also reported an interesting feature: the equilibrium between nonfluorescent carbinol and fluorogenic triphenylmethane forms of MG depends strongly on the nature of the linkage between the two chromophores, allowing tuning of the emission between yellow-orange (TMR) and red (MG).
The TO1-2p-Cy5 bichromophore reported here differs structurally from the previously reported conjugate by the presence of the 2p linker, which adds 14 atoms between the TO1 and Cy5 fluorophores. The extended linker length could contribute to the 5-fold higher affinity for the FAP that we observe relative to the pH-dependent TO1-Cy5 bichromophore binding to the same FAP. In addition, the quantum yield for sensitized fluorescence is 6-fold higher in the case of TO1-2p-Cy5 at neutral pH compared with the pH-dependent TO1-Cy5 under acidic conditions. This is due at least in part to the more efficient energy transfer observed in the present case.
Our work with coumarin-TO extends the range of FRET bichromophores to blue excitation with green emission. The exceptional affinity of TO for the new FAP R1 (KD = 0.17 nM) and high quantum yield (φf = 0.89) provide an excellent starting point from which to create a bichromophoric analogue. The coumarin-TO bichromophore retains reasonably high affinity for R1 (KD = 1.1 nM), while maintaining a high quantum yield ((φf = 0.87) due to the nearly quantitative FRET from coumarin to TO. If subnanomolar affinity were needed, it is possible that a longer linker between the two chromophores would restore some of the higher affinity observed for the TO monochromophore; however, this might also reduce the FRET efficiency. Alternatively, affinity maturation of R1 using the bichromophore could lead to mutants with lower KD values for coumarin-TO.
CONCLUSIONS
The results presented here demonstrate new strategies for changing the color of protein-dye fluoromodules: the fluorogen used to select complementary FAPs from the scFv library can be subsequently conjugated to an appropriate FRET donor or acceptor to obtain new fluoromodules with different excitation (D-AF) or emission (DF-A) wavelengths. This complements prior work in which promiscuous FAPs could be used to generate a range of colors.20, 23, 41 The modularity of the technology and tolerance of the FAPs to conjugating a second dye to the original fluorogen allows these new fluoromodules to be used without necessarily requiring new proteins to be selected, although subsequent affinity maturation might be useful for enhancing affinity. In principle, different fluorogenic donor-acceptor bichromophores can be created to provide a catalogue of colors that can be used for simultaneous tracking of multiple fusion proteins through multicolor imaging/detection or temporally resolved imaging/detection of a single fusion protein through labeling at different times with mono- or bichromophoric reagents.
EXPERIMENTAL SECTION
Full synthetic details and characterization data for the bi- and mono-chromophoric dyes are provided in the Supporting Information (Schemes S1–S2, Table S1 and Figures S1–S24).
Protein Purification
TO1-binding FAP HL1.0.1-TO1 is an affinity-matured version of a FAP that was originally selected to bind to TO1-2p.18 New FAP R1 emerged as one of the potential binders of αCN-TO, a photostable TO analogue.21 Sequence data and purity assessment for the R1 FAP are provided in supporting information (Figure S25) and complete details regarding the selection of R1 from a yeast surface-displayed library will be described elsewhere.
The pPNL6 plasmid containing the R1 clone was extracted using a Zymoprep I kit (Zymo Research). This plasmid was then transformed into Mach1-T1R E. coli. Sequencing was performed by GeneWiz. Expression of the soluble R1 protein in the Mach1-T1 strain was accomplished as described previously.20 HL1.0.1-TO1 protein was secreted from yeast as described.18
Buffer
All experiments were conducted in a modified phosphate buffered saline system (PBS+). The buffer contained 137 mM NaCl, 2.7 mM KCl, 10 mM Na2HPO4, 2 mM KH2PO4, 2 mM EDTA and 0.1% w/v Pluronic F-127. Buffer was adjusted to pH=7.4
Optical Spectroscopy
UV-Vis spectra were recorded with baseline correction on a Cary 300 Bio UV-Visible spectrophotometer at 20°C. For fluoromodule-containing samples, buffer was blanked in the presence of the FAP. Corrected fluorescence spectra of HL1.0.1-TO1 FAP complexes were taken at RT on a Quantamaster monochromator fluorimeter (Photon Technology International); all other fluorescence spectra were measured using a Cary Eclipse fluorescence spectrophotometer at 20°C
Determination of KD values for soluble FAP.42
Range-finding experiment
Range finding experiments were performed to determine approximate KD and binding saturation level for subsequent ligand depletion assay. A serial dilution of 10:1 FAP:dye solution starting with 1 µM FAP was prepared along with a control dye:buffer dilution. All solutions were incubated overnight at room temperature. Fluorescence signals were recorded the following day using Tecan Infinite M1000 Plate Spectrometer.
Ligand depletion assay to determine KD
Binding affinity of TO1-2p-Cy5 and coumarin-TO to their cognate FAPs were determined using 20 nM HL1.0.1-TO1 and 15 nM R1, respectively. Corresponding KD values for monochromophores TO1-2p and TO were also measured using 2 nM HL1.0.1-TO1 and 1 nM R1, respectively. In the case of bichromophores, samples were excited at the donor absorption wavelength and fluorescence signal of acceptor fluorophores Cy5 and TO were monitored. Fluorescence of each FAP-dye complex was corrected by subtracting the fluorescence of a dye only solution. All KD values were extrapolated from the non-linear regression using Graphpad Prism 5.0 and a ligand depletion algorithm43
where X is the concentration of dye and R is the concentration of FAP-dye complex at the maximal fluorescence plateau.
Determination of Fluorescence Quantum Yields
Quantum yields for TO and TO1-2p were determined in the presence of excess FAP R1 and HL1.0.1-TO1, respectively. Fluorescein in 0.1 M NaOH (Φf = 0.925 at 22°C) and Lucifer Yellow in water (Φf = 0.21 at 20°C) were used as quantum yield standards because of the spectral overlap with the examined fluorogens. Quantum yields were determined from FAP-dye complexes having an absorbance between 0.02 and 0.1 at and above λmax. The fluorescence spectrum of each sample was integrated using Origin 6.1 and plotted against its absorbance using a linear regression fit to give slope M. Quantum yields (Φx) were determined using the following equation:
where Φsd is the quantum yield of the standard dye, Mx and Msd are the slopes derived from the plot described above, and ηx and ηSD are the refractive indices of the PBS+ buffer and standard solvent, respectively. Refractive indices of 1.333 and 1.334 were used for water (also PBS+ buffer) and 0.1M NaOH.
Quantum yields of FAP-bichromophore complexes (ΦC) were calculated by the following equation:
where ΦA is the quantum yield of the acceptor chromophore and E is the energy transfer efficiency, estimated from the observed quenching of the donor fluorescence in the presence of the acceptor dye.
Fluorescence Microscopy
Confocal fluorescence of yeast surface-displayed R1 and HL1.0.1-TO1 in the presence of corresponding monochromophores and bichromophores were imaged on a Carl Zeiss LSM 510 Meta Confocal Microscope using live cells immobilized on Concanavalin-coated Mattek dishes. For R1, separate samples containing 10 nM TO and 10 nM coumarin-TO were excited using either a 405 nm or 480 nm laser line. A 420–480 nm band-pass (BP) filter was used to detect coumarin signal whereas TO fluorescence was monitored using a BP 505–550 nm filter. For yeast-expressing HL1.0.1-TO1 FAP, separate samples containing 100 nM TO1-2p and 100 nM TO1-2p-Cy5 were excited using 488 nm (8% power) or 633 nm (10% power) laser lines. TO1-2p and Cy5 signals were respectively monitored using a BP 505–550 nm filter or a BP 650–710 nm filter. Images from all channels were adjusted in Zeiss ZEN 2009 software using identical settings that display the full linear signal range. Scan profiles along transects in Figures 4 and 8 were respectively carried out in ImageJ 2.0 software on unaltered 12-bit and 16-bit LSM files.
Supplementary Material
Acknowledgement
K.J.Z. gratefully acknowledges support from a DoD, Air Force Office of Scientific Research, NDSEG Fellowship 32 CFR 168a. This work is supported by the U.S. National Institutes of Health (grant U54 RR022241). NMR instrumentation at CMU was partially supported by NSF (CHE-0130903). Mass spectrometers were funded by NSF (DBI-9729351). We are grateful to Prof. Dane Wittrup (MIT) for providing an aliquot of the yeast scFv surface-displayed library.
References
- 1.Griffin BA, Adams SR, Tsien RY. Science. 1998;281:269–272. doi: 10.1126/science.281.5374.269. [DOI] [PubMed] [Google Scholar]
- 2.Tsien RY. Nature Rev. Mol. Cell Biol. 2003;(Suppl):SS16–SS21. [PubMed] [Google Scholar]
- 3.Jing C, Cornish VW. Acc. Chem. Res. 2011;44:784–792. doi: 10.1021/ar200099f. [DOI] [PMC free article] [PubMed] [Google Scholar]
- 4.Borra R, Dong D, Elnagar AY, Woldemariam GA, Camarero JA. J. Am. Chem. Soc. 2012;134:6344–6353. doi: 10.1021/ja300209u. [DOI] [PMC free article] [PubMed] [Google Scholar]
- 5.Miyawaki A. Nature Rev. Mol. Cell Biol. 2011;12:656–668. doi: 10.1038/nrm3199. [DOI] [PubMed] [Google Scholar]
- 6.Hori Y, Kikuchi K. Curr. Opin. Chem. Biol. 2013;17:644–650. doi: 10.1016/j.cbpa.2013.05.015. [DOI] [PubMed] [Google Scholar]
- 7.Farinas J, Verkman AS. J Biol Chem. 1999;274:7603–7606. doi: 10.1074/jbc.274.12.7603. [DOI] [PubMed] [Google Scholar]
- 8.Adams SR, Campbell RE, Gross LA, Martin BR, Walkup GK, Yao Y, Llopis J, Tsien RY. J. Am. Chem. Soc. 2002;124:6063–6076. doi: 10.1021/ja017687n. [DOI] [PubMed] [Google Scholar]
- 9.Gautier A, Juillerat A, Heinis C, Corrêa IR, Jr, Kindermann M, Beaufils F, Johnsson K. Chem. Biol. 2008;15:128–136. doi: 10.1016/j.chembiol.2008.01.007. [DOI] [PubMed] [Google Scholar]
- 10.Keppler A, Gendreizig S, Gronemeyer T, Pick H, Vogel H, Johnsson K. Nat Biotechnol. 2003;21:86–89. doi: 10.1038/nbt765. [DOI] [PubMed] [Google Scholar]
- 11.Komatsu T, Johnsson K, Okuno H, Bito H, Inoue T, Nagano T, Urano Y. J. Am. Chem. Soc. 2011;133:6745–6751. doi: 10.1021/ja200225m. [DOI] [PubMed] [Google Scholar]
- 12.Sun X, Zhang A, Baker B, Sun L, Howard A, Buswell J, Maurel D, Masharina A, Johnsson K, Noren CJ, Xu M-Q, Corrêa IR. Chem Bio Chem. 2011;12:2217–2226. doi: 10.1002/cbic.201100173. [DOI] [PMC free article] [PubMed] [Google Scholar]
- 13.Zhang C-J, Li L, Chen GYJ, Xu Q-H, Yao SQ. Org. Lett. 2011;13:4160–4163. doi: 10.1021/ol201430x. [DOI] [PubMed] [Google Scholar]
- 14.Mizukami S, Watanabe S, Akimoto Y, Kikuchi K. J. Am. Chem. Soc. 2012;134:1623–1629. doi: 10.1021/ja208290f. [DOI] [PubMed] [Google Scholar]
- 15.Hori Y, Ueno H, Mizukami S, Kikuchi K. J. Am. Chem. Soc. 2009;131:16610–16611. doi: 10.1021/ja904800k. [DOI] [PubMed] [Google Scholar]
- 16.Miller LW, Cai Y, Sheetz MP, Cornish VW. Nat Meth. 2005;2:255–257. doi: 10.1038/nmeth749. [DOI] [PubMed] [Google Scholar]
- 17.Calloway NT, Choob M, Sanz A, Sheetz MP, Milller LW, Cornish VW. Chem Bio Chem. 2007;8:767–774. doi: 10.1002/cbic.200600414. [DOI] [PubMed] [Google Scholar]
- 18.Szent-Gyorgyi C, Schmidt BF, Creeger Y, Fisher GW, Zakel KL, Adler S, Fitzpatrick JA, Woolford CA, Yan Q, Vasilev KV, Berget PB, Bruchez MP, Jarvik JW, Waggoner A. Nat. Biotechnol. 2007;26:235–240. doi: 10.1038/nbt1368. [DOI] [PubMed] [Google Scholar]
- 19.Feldhaus MJ, Siegel RW, Opresko LK, Coleman JR, Feldhaus JM, Yeung YA, Cochran JR, Heinzelman P, Colby D, Swers J, Graff C, Wiley HS, Wittrup KD. Nat. Biotechnol. 2003;21:163–170. doi: 10.1038/nbt785. [DOI] [PubMed] [Google Scholar]
- 20.Özhalici-Ünal H, Lee Pow C, Marks SA, Jesper LD, Silva GL, Shank NI, Jones EW, Burnette JM, III, Berget PB, Armitage BA. J. Am. Chem. Soc. 2008;130:12620–12621. doi: 10.1021/ja805042p. [DOI] [PMC free article] [PubMed] [Google Scholar]
- 21.Shank NI, Pham HH, Waggoner AS, Armitage BA. J. Am. Chem. Soc. 2013;135:242–251. doi: 10.1021/ja308629w. [DOI] [PMC free article] [PubMed] [Google Scholar]
- 22.Shank NI, Zanotti KJ, Lanni F, Berget PB, Waggoner AS, Armitage BA. J. Am. Chem. Soc. 2009;131:12960–12969. doi: 10.1021/ja9016864. [DOI] [PMC free article] [PubMed] [Google Scholar]
- 23.Zanotti KJ, Silva GL, Creeger Y, Robertson KL, Waggoner AS, Berget PB, Armitage BA. Org. Biomol. Chem. 2011;9:1012–1020. doi: 10.1039/c0ob00444h. [DOI] [PMC free article] [PubMed] [Google Scholar]
- 24.Szent-Gyorgyi C, Schmidt BF, Fitzpatrick JAJ, Bruchez MP. J. Am. Chem. Soc. 2010;132:11103–11109. doi: 10.1021/ja9099328. [DOI] [PMC free article] [PubMed] [Google Scholar]
- 25.Grover A, Schmidt BF, Salter RD, Watkins SC, Waggoner AS, Bruchez MP. Angew. Chem. Int. Ed. 2012;51:4838–4842. doi: 10.1002/anie.201108107. [DOI] [PMC free article] [PubMed] [Google Scholar]
- 26.Yushchenko DA, Zhang M, Yan Q, Waggoner AS, Bruchez MP. Chem Bio Chem. 2012;13:1564–1568. doi: 10.1002/cbic.201200334. [DOI] [PMC free article] [PubMed] [Google Scholar]
- 27.Rostovtsev VV, Green LG, Fokin VV, Sharpless KB. Angewandte Chemie International Edition. 2002;41:2596–2599. doi: 10.1002/1521-3773(20020715)41:14<2596::AID-ANIE2596>3.0.CO;2-4. [DOI] [PubMed] [Google Scholar]
- 28.Sivakumar K, Xie F, Cash BM, Long S, Barnhill HN, Wang Q. Org. Lett. 2004;6:4603–4606. doi: 10.1021/ol047955x. [DOI] [PubMed] [Google Scholar]
- 29.Mujumdar RB, Ernst LA, Mujumdar SR, Lewis CJ, Waggoner AS. Bioconjugate Chem. 1993;4:105–111. doi: 10.1021/bc00020a001. [DOI] [PubMed] [Google Scholar]
- 30.Nygren J, Svanvik N, Kubista M. Biopolymers. 1998;46:39–51. doi: 10.1002/(SICI)1097-0282(199807)46:1<39::AID-BIP4>3.0.CO;2-Z. [DOI] [PubMed] [Google Scholar]
- 31.Karunakaran V, Lustres JLP, Zhao L, Ernsting NP, Seitz O. J. Am. Chem. Soc. 2006;128:2954–2962. doi: 10.1021/ja056862n. [DOI] [PubMed] [Google Scholar]
- 32.Silva GL, Ediz V, Armitage BA, Yaron D. J. Am. Chem. Soc. 2007;129:5710–5718. doi: 10.1021/ja070025z. [DOI] [PMC free article] [PubMed] [Google Scholar]
- 33.Fürstenburg A, Julliard MD, Deligeorgiev TG, Gadjev NI, Vasilev AA, Vauthey E. J. Am. Chem. Soc. 2006;128:7661–7669. doi: 10.1021/ja0609001. [DOI] [PubMed] [Google Scholar]
- 34.Lakowicz JR, Piszczek G, Kang JS. Anal. Biochem. 2001;288:62–75. doi: 10.1006/abio.2000.4860. [DOI] [PMC free article] [PubMed] [Google Scholar]
- 35.Langhals H, Saulich S. Chemistry: a European Journal. 2002;8:5630–5643. doi: 10.1002/1521-3765(20021216)8:24<5630::AID-CHEM5630>3.0.CO;2-Z. [DOI] [PubMed] [Google Scholar]
- 36.Moriya T. Bull. Chem. Soc. Jpn. 1988;61:1873–1886. [Google Scholar]
- 37.Mizukami S, Hori Y, Kikuchi K. Acc. Chem. Res. 2014;47:247–256. doi: 10.1021/ar400135f. [DOI] [PubMed] [Google Scholar]
- 38.Chen I, Ting AY. Curr. Opin. Biotechnol. 2005;16:35–40. doi: 10.1016/j.copbio.2004.12.003. [DOI] [PubMed] [Google Scholar]
- 39.Stroffekova K, Proenza C, Beam KG. Pflugers Arch. 2001;442:859–866. doi: 10.1007/s004240100619. [DOI] [PubMed] [Google Scholar]
- 40.Holleran JP, Brown D, Fuhrman MH, Adler SA, Fisher GW, Jarvik JW. Cytometry Part A. 2010;77A:776–782. doi: 10.1002/cyto.a.20925. [DOI] [PMC free article] [PubMed] [Google Scholar]
- 41.Gallo E, Wienbar S, Snyder AC, Vasilev KV, Armitage BA, Jarvik JW. Protein Peptide Lett. 2014 In Press. [PubMed] [Google Scholar]
- 42.Senutovitch N, Stanfield RL, Bhattacharyya S, Rule GS, Wilson IA, Armitage BA, Waggoner AS, Berget PB. Biochemistry. 2012;51:2471–2485. doi: 10.1021/bi201422g. [DOI] [PMC free article] [PubMed] [Google Scholar]
- 43.Motulsky H, Christopoulos A. Fitting Models to Biological Data Using Linear and Non-Linear Regression: A Practical Guide to Curve Fitting. Oxford: Oxford University Press; 2004. [Google Scholar]
Associated Data
This section collects any data citations, data availability statements, or supplementary materials included in this article.


