Abstract
Recently, high-resolution gamma cameras have been developed with detectors containing > 105–106 elements. Single-photon emission computed tomography (SPECT) imagers based on these detectors usually also have a large number of voxel bins and therefore face memory storage issues for the system matrix when performing fast tomographic reconstructions using iterative algorithms. To address these issues, we have developed a method that parameterizes the detector response to a point source and generates the system matrix on the fly during MLEM or OSEM on graphics hardware. The calibration method, interpolation of coefficient data, and reconstruction results are presented in the context of a recently commissioned small-animal SPECT imager, called FastSPECT III.
Index Terms: Calibration, graphics processing units (GPUs), high-performance computing, image reconstruction, ordered-subset expectation maximization (OSEM), single-photon emission computed tomography (SPECT), system matrix
I. Introduction
A DISCRETE-TO-DISCRETE model of a single-photon emission computed tomography (SPECT) system, described by a system matrix H that maps an object f into measured data g, can be described as
| (1) |
where f is an N × 1 vector of voxel elements, g is an M × 1vector of data bins (pixels), and H is an M × N matrix. When properly normalized, the individual elements of H, hmn, represent the probability of a photon emitted from the nth voxel being detected in the mth detector element [1], [2]. Detector and collimator blur, and pinhole and aperture misalignment, can be included in H by measuring the system response at a grid of discrete locations in the field of view (FOV) of the camera [3]–[6]. Using iterative algorithms, these system imperfections are at least partially compensated for, leading to improved quality of reconstructed images.
Traditional scintillation detectors that use photomultiplier tubes (PMTs) typically have ~104 resolvable detector elements. In small-animal SPECT systems based on these low-resolution detectors, g has on the order of 105–106 elements, depending on the number of projection views. For an imaging system based on classical SPECT cameras with 128×128 binning, g has ~1.5 × 10⁶ elements for 90 angles. In a few specific small-animal SPECT systems, the size of g is:
U-SPECT [7] with 512 × 512 × 3 (detectors) ≈ 7.9 × 10⁵ elements;
X-SPECT [8] with 80 × 80 × 90 (angles) ≈ 5.80 × 10⁵ elements;
FastSPECT II [9] with 80 × 80 × 16 (detectors) ≈ 105 elements.
The number of voxels in f is typically of the order ~106–107 elements.
In recent years, high-resolution gamma cameras have been developed with detectors having 105–106 pixel elements [10]–[14]. In SPECT systems based on these detectors, the size of g ranges from 106–107 elements, one to two orders of magnitude more elements compared to PMT-based SPECT systems. Additionally, the voxel size becomes smaller when utilizing high-resolution detectors. This leads to more voxels and an even larger system matrix. Consequently, we are presented with new challenges with regards to system calibration procedures, storage issues of the system matrix, and methods for performing fast tomographic reconstructions using iterative algorithms.
At the Center for Gamma-Ray Imaging, Tucson, AZ, we recently completed the system integration of FastSPECT III [15], a next-generation high-resolution stationary SPECT imager designed for neurological imaging studies of mice. Stationary SPECT imagers are composed of rings of gamma-ray detectors that provide sufficient angular sampling for tomographic reconstruction without requiring movement of the detector, imaging aperture, or imaging subject. Simultaneous acquisition of projection image data allows for dynamic 4-D imaging, time-dependent activity studies, and avoidance of artifacts due to subject motion. An image of the system is shown in Fig. 1. FastSPECT III has 20 CCD-based scintillation gamma cameras, called BazookSPECT [10]. Each BazookaSPECT comprises a columnar CsI(Tl) scintillator, an image intensifier, and a 640 × 480 CCD sensor that operates at up to 200 frames per second. Currently, the FastSPECT III imaging aperture has 20 pinholes, one per camera. The size g of for the system ~6 × 10⁶ is elements. Assuming a 1003 voxel volume, storage of the entire system matrix would require ~22 TB of space. Fortunately, for pinhole SPECT, most elements H of are zero, and storing only the nonzero elements (sparse H) significantly reduces memory storage requirements. In PMT-based systems, the entire sparse H can be loaded into memory for fast iterative reconstruction. This is done in the FastSPECT II system that has 16 modular PMT detectors (80 × 80 elements per detector). However, for FastSPECT III, even the sparse H is very large because of fine sampling with high-resolution detectors, and memory storage remains an issue. If we assume that the point spread function (PSF) from a given voxel can be modeled as a 2-D Gaussian function, then storage of the parameters that describe the Gaussian function results in a file which is significantly smaller for both types of SPECT systems. Table I shows the relative sizes of the system matrices for FastSPECT II and FastSPECT III.
Fig. 1.
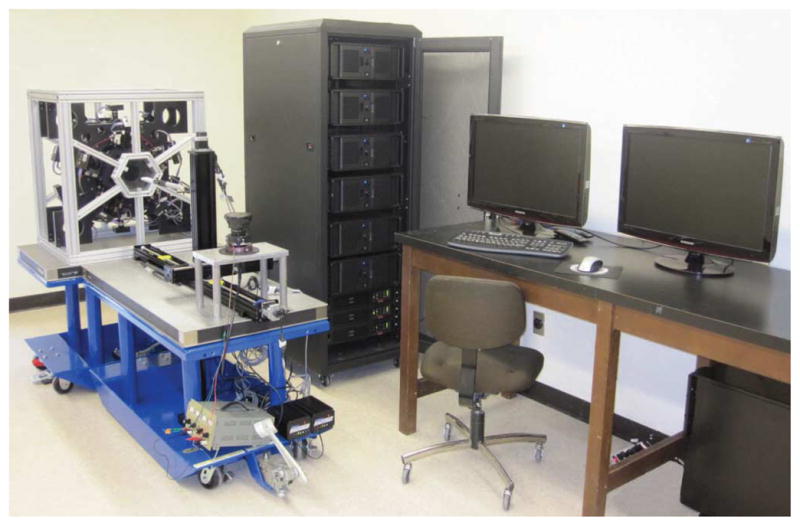
FastSPECT III stationary SPECT imaging system. The system comprises 20 BazookaSPECT detectors and acquisition hardware that processes ~1.23 Gpix/s. In the current imaging configuration, the detectors share a common FOV of ~15 mm for neurological imaging studies of the mouse brain.
TABLE I.
Matrix Storage Size Assuming a 31 × 31 Region of Pixels That Sample the Detector’s Response to a Point Source in FastSPECT III and a 9 × 9 Region for the Low-Resolution Detectors in FastSPECT II
| H-matrix for 104 × 104 × 104 voxels | ||
|---|---|---|
| Storage Options | FastSPECT II | Fast SPECT III |
| Full H | 0.37 TB | 25.14 TB |
| Sparse H | 4.82 GB | 80.54 GB |
| Gaussian Coefficients only | 366 MB | 515 MB |
To address the storage issues of the system matrix that new high-resolution gamma cameras pose for iterative reconstruction, we have developed and validated a method that uses multicore GPUs for fast, on-the-fly computation of H from coefficient data. This method can also be applied to stationary SPECT systems where g is relatively small (FastSPECT II) but f is large, such as in full-body imaging. Additionally, the method is readily extendable to other imaging geometries where the detector response to a point source is best modeled by some function other than a 2-D Gaussian, e.g., a rectangular point-source projection image from a crossed-slit collimator [16].
II. Materials and Methods
For stationary SPECT imagers at the Center for Gamma-Ray Imaging, we typically measure the system-specific components of H experimentally using a radioactive point source [4]. Using a three-axis positioning stage, the point source is stepped in object space in a 3-D grid of measurements points, where the span of the 3-D grid determines the system FOV. The calibration procedure incorporates into the system matrix imperfections or misalignment of the imaging system as well as nonuniformity in the camera response such as distortion, for example. Fig. 2 shows data from a FastSPECT III calibration measurement acquired at one position during a 3-D scan. The 99mTc point source is made using a ~Ø500-μm ion-exchange resin bead. For a given source position, we obtain a projection image from each of the 20 detectors. The system response for the given voxel location corresponds to one column of H, of the size 640 × 480 × 20 = 6144000 elements, and it is estimated by fit-ting a 2-D Gaussian function to each projection image. As can be visualized in Fig. 2, most elements in the 640 × 480 projection images are zero except for small regions of pixels, e.g., 31 × 31 pixels, corresponding to PSFs. Only the nonzero elements of the system matrix contain information needed for reconstruction.
Fig. 2.
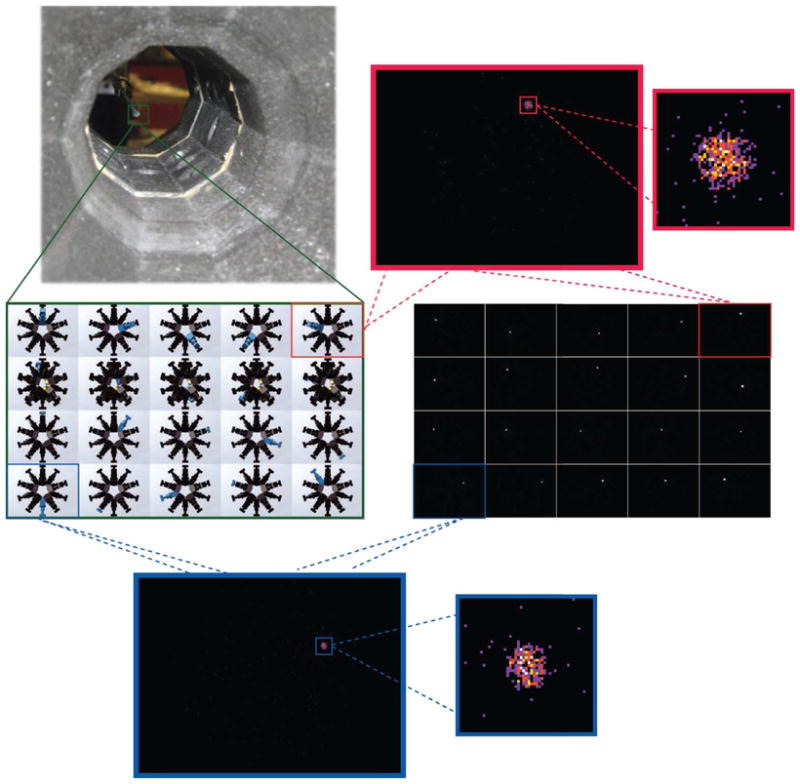
FastSPECT III system calibration. A radioactive point source, e.g., 99mTc ion-exchange resin bead, is mechanically stepped in a sparse 3-D grid of positions inside the FastSPECT III aperture. The system has 20 pinholes (one per detector), and for each source position, we acquire 20 projection images. Shown above are magnified regions of raw projection images from two FastSPECT III detectors taken at a given voxel position during calibration. The system response to the point source for the given voxel position, which we estimate by fitting a 2-D Gaussian function to raw projection data, corresponds to one column of H, 640 × 480 × 20 = 6144000 elements in length (mostly zeros).
The left images in Fig. 3(a) and (b) show the 20 PSFs of Fig. 2 for the given source position. The PSFs shown in the left image in Fig. 3(a) were generated from a 20-s acquisition, and in the left image of Fig. 3(b) from a 600-s acquisition. The activity of the point source to generate these PSFs was ~600 μCi. For system calibration, we routinely make point sources with an activity up to ~1.5 mCi (99mTc). To generate H for FastSPECT III from the raw PSF calibration data (which contains photon-counting noise), we have adopted the method employed by Chen with FastSPECT II [17], where the PSF is estimated to be a 2-D Gaussian function. For each source position, a 2-D Gaussian fit is performed on projection images using a least-squares algorithm. A total of six parameters (amplitude, x-position, y-position, x-width, y-width, and a correlation coefficient) are used to parameterize the 2-D Gaussian, and each Gaussian is normalized to the count level of the PSF projection. Images of Gaussian fits to the 20- and 600-s raw PSF projections are shown in the right images of Fig. 3. A visual comparison between the short and long PSF acquisitions shows that the Gaussian fits are quite good, even for the relatively noisy PSFs from the short acquisition. Note that several of the point-source projections in Fig. 3 have a profile that is not circularly symmetric because the point source is nonorthogonal to the detector. Two-dimensional Gaussian fits to these images are allowed through the correlation coefficient.
Fig. 3.
2-D Gaussian fits to point-source projection data. (a) (left) Nonzero, point-source projection regions of Fig. 2 from 20 detectors. Images were acquired for 20 s, using a ~600 μCi, 99mTc point source. (right) Least-squares 2-D Gaussian fits to the projection data. (b) (left) 600-s projection images and (right) their corresponding 2-D Gaussian fits.
To estimate the accuracy and reproducibility of 2-D Gaussian fits to raw PSF projection data, we positioned the point source at the same voxel locations and acquired projection data for 2 h from the 99mTc, ~600 μCi point source. PSF projection images were then generated from the listmode data into sets of acquisition times ranging from 10–600 s (with decay correction). The average 2-D Gaussian fit from the set of 600-s acquisitions was used as the gold standard, denoted h̄PSF. Fig. 4 shows the results of this comparison for two detectors.
Fig. 4.
Plots showing the accuracy and reproducibility of 2-D Gaussian fits to raw PSF projection data for an example voxel location and two different detectors as a function of the number of counts in the projections. Projection images were acquired using a ~Ø500-μm, 99mTc point source with an activity of ~604 μCi. The point source for both (a) and (b) was located inwards 2 mm, left 5 mm, and up 2.318 mm from the center of the imaging aperture (referencing the image of the FastSPECT III camera configuration above). h̄PSF is a 2-D Gaussian fit averaged using ten 600-s projection images (gPSF) and their corresponding hPSF Gaussian fits. Error bars are two standard deviations in width around the median RMSE/RMS.
To avoid prohibitively long calibration measurements, especially when using point sources with a short half-life such as 99mTc, we measure the 3-D grid of points at a relatively large step size of ~1 mm and estimate intermediate voxels by interpolating neighboring Gaussian coefficients. The next step used in previous-generation imagers (FastSPECT I and II) is to generate a sparse H from the Gaussian coefficient data and store the nonzero matrix elements to file. The system matrix is then loaded into system memory during tomographic reconstruction. For FastSPECT II, depending on the number of voxels and detector elements, the size of a sparse H ranges from 340 MB to 12 GB, a size well within the standard range of system memory in current computing systems. However, for FastSPECT III, as previously mentioned, because of the increased number of detector elements, loading a sparse system matrix, e.g., 80 GB, into system memory for tomographic reconstruction is not an attractive option as the reconstruction time would be prohibitively slow.
Since the entire coefficient file is relatively small (see Table I) and it contains all the information necessary to construct the system matrix, our solution to this dilemma with FastSPECT III is to use the inherently parallel nature of modern graphics cards, with the additional benefit of being low-cost, to generate the system matrix on the fly. For tomographic reconstruction, both projection images and the coefficient data are copied to GPU memory, and elements of H are then generated on the fly in parallel using coefficient data.
To date, we have implemented both maximum-likelihood expectation maximization (MLEM) and ordered-subset expectation maximization (OSEM) algorithms using the NVIDIA CUDA [18] programming environment on NVIDIA Fermi graphics cards. Using CUDA, within a block of parallel threads, elements of a 2-D Gaussian (PSF) are computed from a set of six coefficients. The NVIDIA GPU used for MLEM/OSEM reconstruction is a Fermi GeForce GTX 580 that has 512 processor cores and 1.5 GB of memory. This method is novel in that it combines the benefits from a faster MLEM/OSEM algorithm with a reduction in system matrix size by storing only a parameterized representation of H.
III. Results
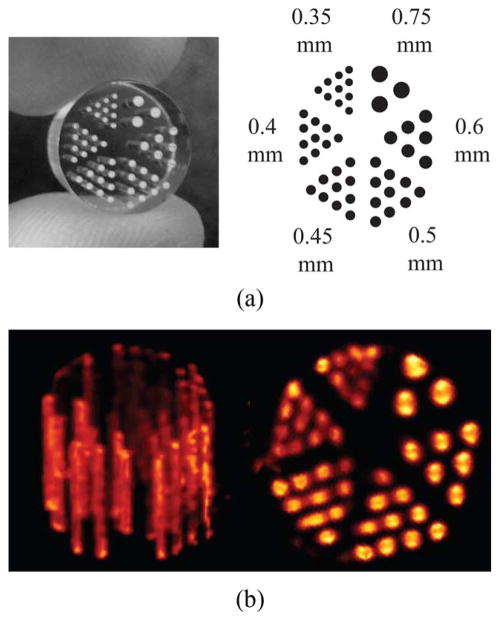
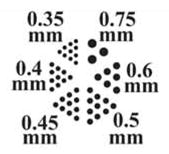
To validate our GPU-based MLEM/OSEM reconstruction algorithm, we imaged a micro-Derenzo (Jaszczak) phantom produced by VANDERWILT techniques bv [19]. The phantom bores were filled with a total of 5 mCi of 99mTc. A set of Ø500-μm pinholes were used to acquire projection images. The 20 projection images along with images of their corresponding detectors are shown in Fig. 5, and a photograph of the phantom is shown in Fig. 6. The smallest bore is Ø350 μm, and the height of the bore is 8 mm. For the tomographic reconstruction, 100 iterations of MLEM were used with a reconstruction volume of 1043 voxels (14.95 mm in each dimension). A 3-D rendering of the reconstructed Jaszczak phantom is shown in Fig. 6. Currently, each iteration of MLEM for a 1043-voxel volume takes approximately 19 s, during which approximately 160 GB of data are generated and processed using the stored coefficients, i.e., elements of the system matrix are generated for forward and back projection operations using a 31 × 31 sampling of the 2-D Gaussian PSFs. To further increase the speed of the reconstruction algorithm, we have implemented OSEM on the GPU and present results using 20 iterations of OSEM with five subsets.
Fig. 5.
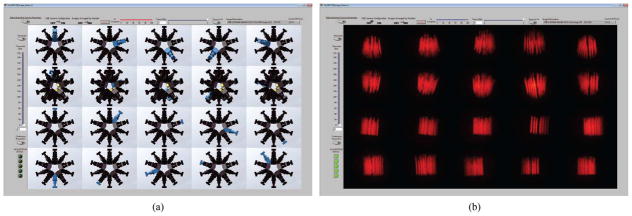
FastSPECT III projection images of a micro-Derenzo phantom. (a) Camera locations corresponding to each (b) projection image.
Fig. 6.
(a) High-resolution micro-Derenzo phantom [19]. Bore sizes range from Ø0.35 to Ø0.75 mm. The length of the phantom is 8 mm with a diameter of 10 mm, and center-to-center distances between holes is 2× the hole diameter. (b) On-the-fly, GPU-based MLEM reconstruction of the phantom filled with 5 mCi of . The voxel volume is 104 × 104 × 104, ~144 μm voxels.
Since we are generating the PSFs of the system matrix on the fly in the GPU, we have the freedom to choose what fraction of the 2-D Gaussian to generate. For example, instead of generating a 2-D Gaussian that is sampled with 31 × 31 elements, we can sample a truncated region using 11 × 11 elements. The benefit of such an approach is reduced reconstruction time at the expense of potential reconstruction artifacts. Additionally, the reconstruction time can be further reduced using a coarser voxel volume, e.g., 523-voxel volume instead of a 1043 volume. Depending upon the imaging task, reduced resolution and potential artifacts may be acceptable tradeoffs for a shorter reconstruction time, especially with imaging studies that would benefit from the capability of real-time tomographic reconstruction while projection data are being acquired. Some benefits of real-time tomography include the following:
the capability of quickly knowing whether or not the subject is properly aligned within the imaging FOV;
rapidly determining whether or not the tracer has arrived at the target volume of interest;
knowledge of when sufficient data are obtained so that the acquisition can then be stopped. This would optimize the acquisition time and consequently increase the throughput capability of the imaging system. Also, it would minimize the amount of time the subject would need to be placed under anesthesia;
the ability to acquire scout scans for adaptive SPECT systems.
Regarding the last point, future adaptive SPECT systems [16], [20]–[23] are currently being built that will have the capability to dynamically change system geometry for optimal imaging performance. These systems will initially generate a low-resolution, large-volume reconstruction (scout scan) that is used to identify a target volume of interest. The system then dynamically reconfigures the aperture/detector configuration for an optimal imaging acquisition. The capability to quickly obtain the scout tomographic reconstruction is an integral feature of adaptive SPECT systems.
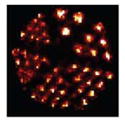
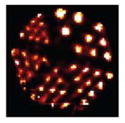
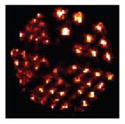
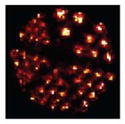
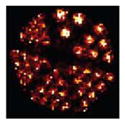
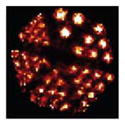
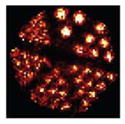
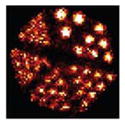
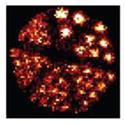
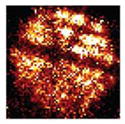
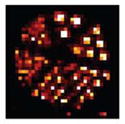
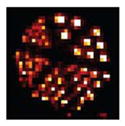
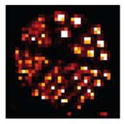
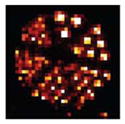
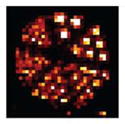
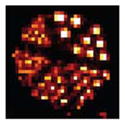
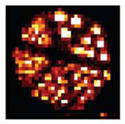
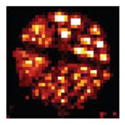
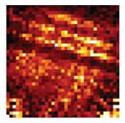
To examine the performance variability in terms of reconstruction time and spatial resolution, we reconstructed the Derenzo phantom with 1043- and 523-voxel volumes at various truncations of the PSF. Results are shown in Tables II and III and Fig. 7. Note that the GPU computational time of the reconstruction (20 iterations of OSEM using five subsets) is for the entire ~15 × 15 × 15 mm3-voxel volume. For FastSPECT III, finer sampling of the PSF (e.g., 27 × 27 or 31 × 31) qualitatively improves the reconstructed image. For comparison, in systems with lower detector resolution, such as FastSPECT II, a nontruncated sampling of the 2-D Gaussian PSF could be obtained with 9 × 9 elements. Examining Tables II and III, a key point is that even as the PSF is truncated, it is possible to reconstruct the object without significant artifacts, even with a highly truncated PSF, e.g., 7 × 7 or 5 × 5 region of the 2-D Gaussian. Shown in Table III at these sampling values, it takes only ~3 s to complete 20 iterations of OSEM. Since each PSF is normalized to the original count level, we avoid bias in the reconstruction, even as the tails are truncated.
TABLE II.
1043-Voxel Volume (~144 μm Voxels) Reconstruction Time and Resolution Comparison of the GPU-Based OSEM Reconstruction Where the Fraction of the 2-D Gaussian (PSF) is Varied
| FastSPECT III On-The-Fly OSEM Reconstruction 1043 voxels, ~144 μm (15 × 15 × 15 mm3 FOV) 20 Iterations OSEM, 5 Subsets |
|
|||
|---|---|---|---|---|
| hPSF (2D Gaussian Sampled Region) | H (Sparse) | GPU Computation Time (Total Volume) | Versus CPU (Single Core i7) | Slice (144 μm) |
 31 × 31 |
80.54 GB | 387 sec | 60.37× |
|
 27 × 27 |
61 GB | 287.8 sec | 60.87× |
|
 21 × 21 |
37 GB | 148.4 sec | 70.57× |
|
 15 × 15 |
18.8 GB | 83.22 sec | 64× |
|
 11 × 11 |
10.1 GB | 43.5 sec | 66.09× |
|
 9 × 9 |
6.7 GB | 33.3 sec | 58.34× |
|
 7 × 7 |
4.12 GB | 27.09 sec | 40× |
|
 5 × 5 |
2.09 GB | 24.39 sec | 25.67× |
|
 3 × 3 |
0.75 GB | 24.10 sec | 10.68× |
|
 1 × 1 |
0.08 GB | 19.52 sec | 3.12× |
|
TABLE III.
523-Voxel Volume (~287.5 μm-Voxels) Reconstruction Time and Resolution Comparison of the GPU-Based OSEM Reconstruction Where the Fraction of the 2-D Gaussian (PSF) is Varied
| FastSPECT III On-The-Fly OSEM Reconstruction 523 voxels, ~287.5 μm (15 × 15 × 15 mm3 FOV) 20 Iterations OSEM, 5 Subsets |

|
|||
|---|---|---|---|---|
| hPSF (2D Gaussian Sampled Region) | H (Sparse) | GPU Computation Time (Total Volume) | Versus CPU (Single Core i7) | Slice (287.5 μm) |
 31 × 31 |
10.1 GB | 47.27 sec | 56.67× |
|
 27 × 27 |
7.63 GB | 35.05 sec | 57.7× |
|
 21 × 21 |
4.62 GB | 18.06 sec | 67.8× |
|
 15 × 15 |
2.35 GB | 10.02 sec | 61.8× |
|
 11 × 11 |
1.26 GB | 5.41 sec | 61.89× |
|
 9 × 9 |
0.85 GB | 4.22 sec | 53.8× |
|
 7 × 7 |
0.51 GB | 3.48 sec | 40.06× |
|
 5 × 5 |
0.262 GB | 3.18 sec | 23.42× |
|
 3 × 3 |
0.094 GB | 3.15 sec | 9.98× |

|
 1 × 1 |
0.014 GB | 2.62 sec | 3.02× |
|
Fig. 7.
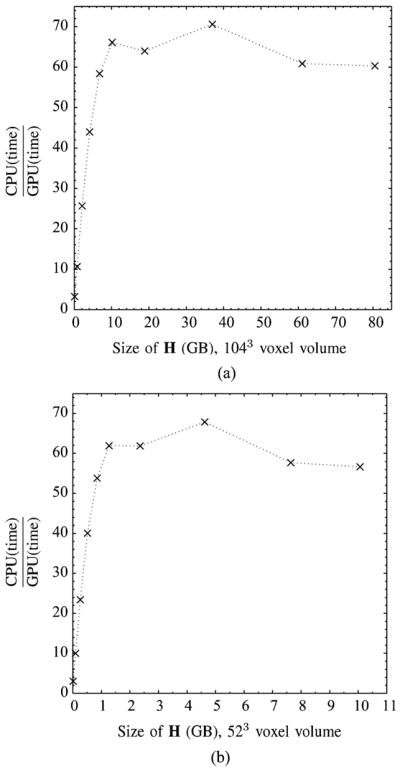
OSEM (20 iterations, five subsets) reconstruction time (CPU/GPU) as a function of the size of the sparse H in gigabytes for a 15 × 15 × 15-mm3 voxel volume. For both the CPU (single-core Intel i7 processor) and GPU reconstructions, elements of the sparse H are generated on the fly from 2-D Gaussian coefficient data where the size of the sparse H decreases with truncation of the 2-D Gaussian. (a) Voxel volume sampled with 1043 voxels. (b) Voxel volume sampled with 523 voxels.
IV. Discussion and Conclusion
The inherently parallel nature of GPUs, with hundreds of processing cores, is an attractive feature for performing fast tomographic reconstructions using iterative methods. An additional attractive feature of GPUs is their relatively low cost. In modern computing systems, which provide gigabytes of system and GPU memory, storing the nonzero, system matrix elements in memory for fast reconstruction is not feasible in next-generation SPECT systems because of the massive number of voxels and/or detector elements. Our solution to this problem is to represent the nonzero system matrix elements with a model, e.g., 2-D Gaussians, which can then be parameterized by coefficients. Storing only the coefficients is a data reduction process that overcomes memory storage issues much in the way storing listmode data in PMT-based scintillation cameras is more efficient than binning when there are many event attributes. Implementing iterative reconstruction algorithms using coefficient data requires that the system matrix elements be generated on the fly, which is accomplished in parallel using GPU processors.
We propose that as SPECT imagers with vastly more detector elements and vastly more voxels are developed, generation of the system matrix on the fly using GPUs is the method that will have to be employed to generate tomographic reconstructions within reasonable time frames. We have developed and validated this method with MLEM and OSEM in the FastSPECT III, small-animal stationary SPECT imager where we successfully reconstructed a resolution phantom at ~60× faster speed compared to a single CPU. We have demonstrated that this method allows for real-time tomography of the entire voxel volume in a matter of seconds using a reduced voxel volume and/or a truncated PSF. Real-time tomography is a feature that provides SPECT imagers with a number of benefits such as a method for obtaining the optimal acquisition time and rapid knowledge as to whether or not tracer has arrived at the target volume of interest. Most importantly, we propose it as a solution to a critical feature needed in future next-generation adaptive SPECT imagers that will require fast tomographic reconstruction of scout data.
Acknowledgments
This work was supported by the National Institutes of Health under NIBIB Grant P41-EB002035 and R37-EB000803. The work of R. Van Holen was supported by a postdoctoral fellowship of the Research Foundation Flanders (FWO).
Contributor Information
Brian W. Miller, Email: molinero@radiology.arizona.edu, Center for Gamma-Ray Imaging and the College of Optical Sciences, University of Arizona, Tucson, AZ 85724 USA.
Roel Van Holen, MEDISIP, Department of Electronics and Information Systems, Ghent University, B-9000 Ghent, Belgium.
Harrison H. Barrett, Email: barrett@radiology.arizona.edu, Center for Gamma-Ray Imaging and the College of Optical Sciences, University of Arizona, Tucson, AZ 85724 USA.
Lars R. Furenlid, Email: furen@radiology.arizona.edu, Center for Gamma-Ray Imaging and the College of Optical Sciences, University of Arizona, Tucson, AZ 85724 USA.
References
- 1.Barrett H, Myers K. Foundations of Image Science. Hoboken, NJ: Wiley; 2004. [Google Scholar]
- 2.Wilson D. Small-Animal SPECT Imaging. New York: Springer; 2005. Computational algorithms in small-animal imaging; pp. 139–162. [Google Scholar]
- 3.Rowe R, Aarsvold J, Barrett H, Chen J, Klein W, Moore B, Pang I, Patton D, White T. A stationary hemispherical SPECT imager for three-dimensional brain imaging. J Nucl Med. 1993;34:474–480. [PubMed] [Google Scholar]
- 4.Chen Y, Furenlid L, Wilson D, Barrett H. Small-Animal SPECT Imaging. New York: Springer; 2005. Calibration of scintillation cameras and pinhole SPECT imaging systems; pp. 195–201. [Google Scholar]
- 5.Have Fvd, Vastenhouw B, Rentmeester M, Beekman F. System calibration and statistical image reconstruction for ultra-high resolution stationary pinhole SPECT. IEEE Trans Med Imag. 2008 Jul;27(7):960–971. doi: 10.1109/TMI.2008.924644. [DOI] [PubMed] [Google Scholar]
- 6.Van Holen R, Miller BW, Moore JW, Vandenberghe S, Barrett HH. Object-space interpolation of SPECT system matrices from point-source measurements. Fully 3D Conf Proc. 2011:419–422. [Google Scholar]
- 7. Beekman F, van der Have F, Vastenhouw B, van der Linden A, van Rijk P, Burbach J, Smidt M. U-SPECT-I: A novel system for submillimeter-resolution tomography with radiolabeled molecules in mice. J Nucl Med. 2005;46(7):1194–1194. [PubMed] [Google Scholar]
- 8.Parnham K, Chowdhury S, Li J, Wagenaar D, Patt B. Second-generation, tri-modality pre-clinical imaging system. IEEE Nucl Sci Symp Conf Record. 2006;3:1802–1805. [Google Scholar]
- 9.Furenlid L, Wilson D, Chen Y, Kim H, Pietraski P, Crawford M, Barrett H. FastSPECT II: A second-generation high-resolution dynamic SPECT imager. IEEE Trans Nucl Sci. 2004 Jun;51(3):631–635. doi: 10.1109/TNS.2004.830975. [DOI] [PMC free article] [PubMed] [Google Scholar]
- 10.Miller B, Barrett H, Furenlid L, Barber H, Hunter R. Recent advances in BazookaSPECT: Real-time data processing and the development of a gamma-ray microscope. Nucl Instrum Methods Phys Res A. 2008;591(1):272–275. doi: 10.1016/j.nima.2008.03.072. [DOI] [PMC free article] [PubMed] [Google Scholar]
- 11.Miller B, Barber H, Barrett H, Wilson D, Chen L. A low-cost approach to high-resolution, single-photon imaging using columnar scintillators and image intensifiers. IEEE Nucl Sci Symp Conf Record. 2006;6:3540–3545. [Google Scholar]
- 12.de Vree G, van der Have F, Beekman F. EMCCD-based photon-counting mini gamma camera with a spatial resolution < 100 microns. IEEE Nucl Sci Symp Conf Record. 2004 Oct;5:2724–2728. [Google Scholar]
- 13.Meng L. An intensified EMCCD camera for low energy gamma ray imaging applications. IEEE Trans Nucl Sci. 2006 Aug;53(4):2376–2384. doi: 10.1109/TNS.2006.878574. [DOI] [PMC free article] [PubMed] [Google Scholar]
- 14.Peterson T, Wilson D, Barrett H. Application of silicon strip detectors to small-animal imaging. Nucl Instrum Methods Phys Res Sec A, Accel Spectrom Detect Assoc Equip. 2003;505(1–2):608–611. [Google Scholar]
- 15.Miller B, Moore S, Barber H, Furenlid L, Barrett H. System integration of FastSPECT III, a dedicated SPECT rodent-brain imager based on BazookaSPECT detector technology. IEEE Nucl Sci Symp Conf Record. 2009:4004–4008. doi: 10.1109/NSSMIC.2009.5401924. [DOI] [PMC free article] [PubMed] [Google Scholar]
- 16.Durko H, Peterson T, Barrett H, Furenlid L. High-resolution, anamorphic, adaptive small-animal SPECT imaging with silicon double-sided strip detectors. Proc SPIE. 2011;8143:81430G. doi: 10.1117/12.896729. [DOI] [PMC free article] [PubMed] [Google Scholar]
- 17.Chen Y. PhD dissertation. Dept. Opt. Sci., Univ. Arizona; Tucson, AZ: 2006. System calibration and image reconstruction for a new small-animal SPECT system. [Google Scholar]
- 18.CUDA, Compute Unified Device Architecture-Programming Guide Version 2.0. NVIDIA; Santa Clara, CA: 2009. [Google Scholar]
- 19.VANDERWILT techniques bv, Boxtel, The Netherlands. VANDER-WILT Techniques bv. [Online]. Available: http://www.for-med.nl.
- 20.Clarkson E, Kupinski M, Barrett H, Furenlid L. A task-based approach to adaptive and multimodality imaging. Proc IEEE. 2008 Mar;96(3):500–511. doi: 10.1109/JPROC.2007.913553. [DOI] [PMC free article] [PubMed] [Google Scholar]
- 21.Barrett H, Furenlid L, Freed M, Hesterman J, Kupinski M, Clarkson E, Whitaker M. Adaptive SPECT. IEEE Trans Med Imag. 2008 Jun;27(6):775–788. doi: 10.1109/TMI.2007.913241. [DOI] [PMC free article] [PubMed] [Google Scholar]
- 22.Freed M, Kupinski MA, Furenlid LR, Wilson DW, Barrett HH. A prototype instrument for single pinhole small animal adaptive SPECT imaging. Med Phys. 2008;35:1912–1925. doi: 10.1118/1.2896072. [DOI] [PMC free article] [PubMed] [Google Scholar]
- 23.van Holen R, Moore J, Clarkson E, Furenlid L, Barrett H. Design and validation of an adaptive SPECT system: AdaptiSPECT. IEEE NSS/MIC. 2010:2539–2544. doi: 10.1109/NSSMIC.2010.5874245. [DOI] [PMC free article] [PubMed] [Google Scholar]


