

Abstract
The enteric nervous system of the esophagus plays an important role in its sensory and motor functions. Although the esophagus contains enteric neurons, they have never been isolated and characterized in primary culture. We isolated and cultured enteric neurons of the rat esophagus and determined their morphological appearance, chemical coding for neurotransmitters, and functional characteristics. After primary culture for 2 wk, dendrites and axons appeared in the enteric neurons, which usually have one axon and several dendrites. Although the size of neuronal bodies varied from Dogiel type I to type II, their average size was 39 ± 1.8 μm in length and 23 ± 1.4 μm in width. Immmunocytochemical studies revealed that over 95% of these cells were positively stained for two general neuronal markers, PGP 9.5 or Milli-Mark Fluoro. Chemical coding showed that the neurons were positively stained for choline acetyltransferease (53 ± 6%) or nNOS (66 ± 13%). In functional studies, membrane depolarization and stimulation of several G protein-coupled receptors (GPCRs) induced Ca2+ signaling in the esophageal enteric neurons. The GPCR stimulation was found to induce both intracellular Ca2+ release and extracellular Ca2+ entry. The functional expressions of Ca2+ channels (voltage-gated Ca2+ channels and store-operated channels) and Ca2+ pump (sarcoplasmic reticulum Ca2+-ATPase) were also demonstrated on these neurons. We have grown, for the first time, esophageal enteric neurons in primary culture, and these contain excitatory and inhibitory neurotransmitters. The functional integrity of GPCRs, Ca2+ channels, and Ca2+ pump in these neurons makes them a useful cell model for further studies.
Keywords: choline acetyltransferease, nitric oxide synthase, cytoplasmic free calcium ion, G protein-coupled receptors, calcium ion channels, calcium ion pump
the enteric nervous system (ENS) plays an essential role in the regulation of gastrointestinal motility (4, 19, 35). Enteric neurons have many different functions in the ENS, and broadly they are divided into three major types, 1) sensory neurons (intrinsic primary afferent neurons), 2) interneurons, and 3) motor neurons (4, 19). Motor neurons are further divided into excitatory and inhibitory types based on their regulatory functions on the gastrointestinal motility (4, 18). Excitatory motor neurons contain excitatory neurotransmitters, such as acetylcholine (ACh), substance P, and N-methyl-d-aspartate (NMDA) (19). On the other hand, inhibitory motor neurons predominantly contain inhibitory neurotransmitters, such as NO, ATP, and VIP (19, 35).
Enteric neurons located in the wall of esophagus play an important role in its sensory and motor functions (18, 19, 42). The esophageal enteric motor neurons have their cell bodies in the myenteric ganglia, and their axons penetrate the longitudinal and circular smooth muscle layers (15, 42) of esophagus and lower esophageal sphincter (LES). Recent efforts have been directed at characterizing the neurotransmitters present in the terminals of motor neurons and the mechanisms underlying neurotransmitter-mediated contraction and relaxation of esophageal muscle and LES (15). A number of investigators have isolated, cultured, and characterized enteric neurons of the small and large intestines (18, 42).
Although it is known that the esophagus contains enteric neurons (15, 19, 24, 25), they have never been isolated and characterized in primary culture. There is no report of the morphological, immunocytochemical, and functional studies of the primary cultured esophageal enteric neurons. Moreover, the functional expression of G protein-coupled receptors (GPCRs), ion channels, and exchangers on these neurons is poorly understood. Therefore, the present study was undertaken to isolate and culture the rat esophageal enteric neurons. We determined their morphological appearance and chemical coding for neurotransmitters. Furthermore, we determined if these neurons were functional as evidenced by an increase in cytoplasmic free calcium concentrations ([Ca2+]cyt) in response to membrane receptor stimulation and membrane depolarization. Finally, we assessed the functional expressions of GPCRs, Ca2+ channels [voltage-gated Ca2+ channels (VGCC) and store-operated channels (SOC)], and Ca2+ pump [sarcoplasmic reticulum Ca2+-ATPase (SERCA)] on these neurons.
METHODS AND MATERIALS
Isolation and Primary Culture of Esophageal Enteric Neurons
To freshly isolate enteric neurons from the rat esophagus, we used magnetic bead immunoselection of p75NTR-expressing (p75 neurotrophin receptor, neural marker) cells. Briefly, the whole esophagus was isolated from the postnatal day 5 rats and placed in L15 medium (Mediatech Cellgro). After removing mucosa, L15 medium was removed, and 1 ml of collagenase (2 mg/ml) and diaspase (0.2 mg/ml) were added to prepare single-cell suspension. After incubation for 30 min at 37°C in the incubator, the tissues were triturated in N-2 medium with a sterile polished glass pipette. The dissociated cells were incubated with monoclonal antibody to low-affinity nerve growth factor receptor (p75NTR) and incubated at 4°C on a shaker for 1 h. After adding wash buffer, the solution was spun at 1,300 rpm for 10 min at 4°C. Supernatant was aspirated, the cells were resuspended in wash buffer, and magnetic beads labeled with goat anti-mouse IgG microbeads were added to let all the cells go through a column and then were put into a 15-ml tube. One milliliter of buffer was added, and a plunger was placed in the column to obtain the positive fraction. Ten microliters of cell aliquot (positive fraction) were mixed with 10 μl trypan blue (1:2 dilution), and cell counting was performed in the hemocytometer under a microscope. The cell number from each esophagus equals the average cell number counted from four squares of a hemocytometer and adjusted for the dilution factor, and then divided by the total number of esophagi used. The remainder of the cell aliquot was spun and resuspend in N-2 medium with penicillin G (50 U/ml) and streptomycin (50 μg/ml). The cells were cultured for 1–2 wk in a humidified tissue culture incubator.
Immunocytochemical Staining of Esophageal Enteric Neurons
Cultured neurons were fixed by Formal FIXX for 30 min, washed with PBS for 5 min, and then treated with PBS plus 0.05% Triton X-100 + 1% bovine serum albumin (BSA) for 30 min two times before processing for immunostaining. Triton X-100 is a detergent to permeablize the cell membranes. Samples were immunolabeled with primary antibodies and diluted with PBS/0.05% Triton X-100 plus 1% BSA as follows: 1) single labeling with primary mouse monoclonal to PGP 9.5 1:1,000 (ab72911) or Milli-Mark FluoroPan Neuronal Marker 1:100 (MAB2300X; Millipore, Temecula, CA); 2) single labeling with goat polyclonal to choline acetyltransferease (ChAT) 1:100 (AB144P) or anti-nNOS 1:1,000 (ab5380; Millipore); 3) double labeling with primary mouse monoclonal to PGP 9.5 1:1,000 (ab72911) or Milli-Mark FluoroPan Neuronal Marker 1:100 (MAB2300X; Millipore) + rabbit polyclonal to nNOS 1:1,000 (ab5380; abcam, Cambridge, MA); 4) double labeling with PGP 9.5 1:1,000 (ab72911) or Milli-Mark 1:100 (MAB2300X; Millipore) + goat polyclonal to ChAT 1:100 (AB144P); or 5) double labeling with anti-nNOS 1:1,000 (ab5380; Millipore) + goat polyclonal to ChAT 1:100 (AB144P).
Preparations were incubated for 2 h at room temperature or overnight at 4°C and then washed with PBS/0.05% Triton X-100/1% BSA three times, 5 min each time. Negative controls were performed by omitting the primary antibodies during the staining process. Secondary antibodies were as follows: 1) goat anti-mouse or donkey anti-goat DyLight 488-conjugated and 2) goat anti-rabbit DyLight 549-conjugated IgG (H_L) each at 1:200 concentrations (from Jackson Immuno Research Laboratories, West Grove, PA) for 30 min at room temperature. Preparations were washed with 0.05% Triton X-100/1% BSA three times, 5 min each time, and then preparations were incubated with 4′,6-diamidino-2-phenylindole, dihydrochloride (a popular nuclear and chromosome count stain) 1:5,000 for 5 min. After being washed one time with PBS, preparations were mounted on a slide with Fluoromount, covered with a cover slip, and sealed with nail polish. The images were viewed with a fluorescent microscope (Nikon Ti, Melville, NY) and a Zeiss LSM-710 multiphoton confocal microscope.
Determination of [Ca2+]cyt in Isolated Single Esophageal Enteric Neurons
[Ca2+]cyt levels in the enteric neurons were measured as described previously (9). Briefly, after enteric neurons were cultured on 10-mm glass cover slips for 2 wk, they were loaded with 5 μM fura 2-AM in normal physiological salt solution (PSS), as described below at room temperature (22°C) for 50 min, and then washed in PSS for at least 20 min. Thereafter, the cover slips with enteric neurons were mounted in a perfusion chamber on a Nikon microscope stage. Cells were initially superfused with PSS for 5 min and then switched to Ca2+-free or Ca2+ solutions containing drugs of interest. Fura 2 fluorescence ratio (510-nm light emission excited by 340- or 380-nm illuminations), as well as background fluorescence, was collected with the use of a ×20 Nikon UV-Fluor objective and an intensified CCD camera (ICCD200). The fluorescence signals emitted from the cells were monitored continuously using a MetaFluor Imaging System (Universal Imaging, Downingtown, PA) and recorded for later analysis. PSS used in digital Ca2+ measurement contained the following (in mM): 140 Na+, 5 K+, 2 Ca2+, 147 Cl−, 10 HEPES, and 10 glucose. The solution pH was 7.4. For the Ca2+-free PSS solution, Ca2+ was omitted, and 0.5 mM EGTA was added to the solution. The osmolality for all solutions was ∼315 mosmol/l.
Chemicals
ATP, histamine, NMDA, 5-hydroxytryptamine (5-HT), carbachol (CCh), and cyclopiazonic acid (CPA) were purchased from Sigma. 2-Aminoethoxydiphenyl borate (2-APB) and nifedipine were purchased from Tocris Bioscience (Ellisville, MO). Ryanodine was obtained from Santa Cruz Biotechnology (Dallas, TX) and fura 2-AM from Molecular Probes (Eugene, OR). The other chemicals were obtained from Fisher Scientific (Santa Clara, CA).
Statistical Analysis
Results are expressed as means ± SE. Differences between the means were considered to be statistically significant at P < 0.05 using Student's t-test or one-way ANOVA, which was followed by Newman-Keuls post hoc test when appropriate.
RESULTS
Morphological Study
Within the ENS of all mammals, two neuron morphologies are readily identified (Fig. 1A, inset). One type of neuron is monoaxonal and has short club-like dendrites, which resembles Dogiel type I as described in in situ ex vivo whole wall preparations (6, 7, 16, 37). On the other hand, another type of neuron that is larger than most other neurons has smooth cell bodies with multiple long processes. The dendrites of most Dogiel II neurons are not elaborating as described in in situ ex vivo whole gut wall preparations. Besides morphological appearance, the definition of enteric neuron types relies on their neurochemistry, electrophysiological properties, and projections to targets.
Fig. 1.
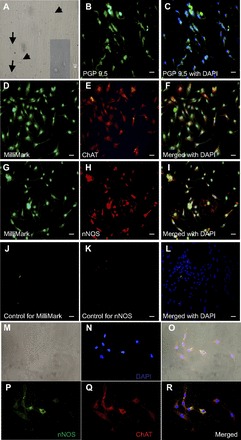
Esophageal enteric neurons isolated from the 5-day-old rat in the primary culture for 7 days. A: different types of enteric neurons: long and short arrows indicate type I and type II neurons, respectively, also in inset image. B and C: enteric neurons stained with PGP 9.5 and merged with nuclear stain 4′,6-diamidino-2-phenylindole, dihydrochloride (DAPI). D–F: enteric neurons stained with Milli-Mark (D) and choline acetyltransferease (ChAT, E) merged with nuclear stain DAPI (F). G–I: enteric neurons stained with Milli-Mark (G) and nNOS (H) merged with nuclear stain DAPI (I). J–L: enteric neurons stained with goat anti-mouse DyLight 488-conjugated and goat anti-rabbit DyLight 549-conjugated IgG (H–L and K) merged with nuclear stain DAPI (L). The scale bar is 50 μm. M–R: enteric neurons double stained with nNOS and ChAT. M: enteric neurons viewed under differential interference contrast (DIC). N: enteric neurons stained with DAPI. O: DIC image merged with nNOS, ChAT, and DAPI. P–R: enteric neurons stained with nNOS (P), ChAT (Q), and merged with DAPI (R). Magnification is ×40 from M to R. These typical images are representatives of at least 10 independent different experiments.
We studied morphological appearance of neurons in primary culture using light microscopy. Neuron count from each esophagus was 3.1 × 10⁴ ± 0.8 × 10⁴/mm3, and, for the comparison, we also isolated neurons from the small intestine (without mucosa) of the same rat using the same length as esophagus. Neuron count from the small intestine was 3.1 × 10⁴ ± 0.7 × 10⁴/mm3, not different from the esophagus. After primary culture for 7 days, dendrites and axons appeared in the enteric neurons isolated from both the esophagus (Fig. 1A) and the small intestine (data not shown). Although most neurons grew separately, some were connected with each other by dendrites. The shape of neurons resembled either “Dogiel type I” or “type II” morphology. We counted and measured the size of 50 neurons, 19 of which resemble “type I.” The size of these neuronal cell bodies varied between 25 and 49 μm in length and 16 and 32 μm in width. Thirty one of them resemble type II and the size of these neuronal cell bodies varied between 27 and 53 μm in length and 12 and 32 μm in width. Therefore, the average size of neuronal bodies is 39 ± 1.8 μm in length and 23 ± 1.4 μm in width. No significant differences in the characteristics of enteric neurons were detected between the esophagus and small intestine.
Immunocytochemistry Study
Although we used magnetic bead immunoselection of p75NTR-expressing (p75 neurotrophin receptor, neural marker) to specifically isolate neurons, we also performed immunocytochemistry staining to determine if our primary cultured esophageal cells are indeed neurons and, if so, whether they contained excitatory (acetylcholine, ChAT) and inhibitory (neuronal nitric oxide synthase, nNOS) neurotransmitters. Enteric neurons were freshly isolated from the esophagus and small intestine of postnatal rats and then cultured for 1–2 wk. Immunocytochemistry staining revealed that over 95% of cells stained positive for two general neuronal markers, PGP 9.5 (Fig. 1, B and C) and Milli-Mark (data not shown, but similar to double staining in Fig. 1, D and G). Chemical coding revealed that a fraction of the neurons stained for ChAT, and these costained with Milli-Mark (Fig. 1, D–F). A fraction of the neurons also stained for nNOS, and these also costained with Milli-Mark (Fig. 1, G–I). We counted total Milli-Mark-positive neurons and ChAT- or nNOS-positive neurons in the six high-power fields, and the percentage of ChAT or nNOS positive neurons was calculated. We found that 53 ± 6% of Milli-Mark-positive neurons costained with ChAT (n = 6), and 66 ± 13% of Milli-Mark-positive neurons costained with nNOS (n = 6). We also performed ChAT-nNOS colabeling experiments (Fig. 1, M–R) and found the costaining rate was 30 ± 5%.
Functional Identification of Membrane Receptors and Ion Channels on Esophageal Enteric Neurons
Membrane receptors and ion channels are the essential components of normal neuronal function (41). GPCRs respond to neurotransmitters, and many of them signal through an increase in the [Ca2+]cyt. We therefore characterized Ca2+ responses of isolated cells to several stimulators and inhibitors of GPCRs and ion channels. After the neurons were cultured for 2 wk (allowing for differentiation), neurons were loaded with fura 2-AM (a specific probe for [Ca2+]cyt) (20, 39), after which [Ca2+]cyt was determined in single neurons using a digital calcium-imaging system.
GPCR Coupled to Intracellular Ca2+ Release and Extracellular Ca2+ Entry
Purinergic receptors.
P2Y receptors are physiologically activated by ATP and belong to one subtype of purinergic receptor. Because ATP is an inhibitory neurotransmitter that may play an important role in esophageal motility (15), we first investigated the effect of ATP on Ca2+ signaling in the isolated esophageal neurons. ATP was found to significantly raise [Ca2+]cyt in almost all primary cultured neurons in the normal PSS with 2 mM calcium. ATP (10 μM) raised the fluorescence ratio [340/380 nm (F340/380)] in the neurons from basal levels of 0.50 ± 0.02 to 1.31 ± 0.04 (2.62-fold increase, P < 0.01, n = 100 cells). The [Ca2+]cyt responses to ATP were highly reproducible. Figure 2A shows the summary data of ATP-induced [Ca2+]cyt, and Fig. 2B shows histograms of the summary data in all tested neurons. To further investigate the ATP-induced intracellular Ca2+ sources [intracellular Ca2+ release from the endoplasmic reticulum (ER) stores or extracellular Ca2+ entry], we tested ATP-induced Ca2+ signaling in 0 mM Ca2+ or 2 mM Ca2+ solutions and found that an ATP-induced increase in [Ca2+]cyt was observed under both conditions (Fig. 2, C and D). ATP (10 μM) raised F340/380 in the neurons from basal levels of 0.51 ± 0.01 to 0.85 ± 0.04 in 0 Ca2+ solutions (P < 0.01, n = 39 cells) and to 0.70 ± 0.02 in 2 mM Ca2+ solutions (P < 0.05, n = 39 cells), suggesting that it induces intracellular Ca2+ release and extracellular Ca2+ entry into the neurons.
Fig. 2.
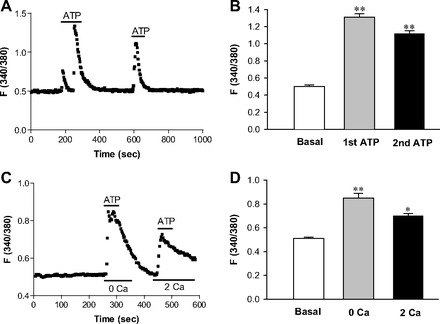
Effect of ATP on cytoplasmic free calcium concentrations ([Ca2+]cyt) in esophageal enteric neurons. A: after basal lines were stabilized, ATP (10 μM) was added as indicated by a line above the tracings to 2 mM Ca2+ normal PSS. Values are means ± SE. B: histograms of the summary data of neuronal responses to two additions of ATP (10 μM) in 2 mM Ca2+ PSS. **P < 0.01 vs. basal levels, n = 100 cells from 20 rats. C: after basal lines were stable, ATP (10 μM) was added to 0 Ca2+ or 2 mM Ca2+ normal PSS as indicated by a line above the tracings. Values are means ± SE. D: histograms of the summary data of neuronal response to ATP (10 μM) in 0 Ca2+ or 2 mM Ca2+ PSS. *P < 0.05 and **P < 0.01 vs. basal levels, n = 39 cells from 6 rats.
Histamine receptors.
As shown in Fig. 3A, histamine raised [Ca2+]cyt in almost all esophageal neurons in 2 mM Ca2+ solution. Histamine (100 μM) raised F340/380 in the neurons from basal levels of 0.55 ± 0.02 to 0.86 ± 0.05 (1.56-fold increase, P < 0.01, n = 30 cells). Figure 3B shows histograms of the summary data in all tested neurons. To further investigate the histamine-induced Ca2+ source, we tested Ca2+ signaling in either 0 Ca2+ or 2 mM Ca2+ solutions and found that, similar to ATP, histamine also induced Ca2+ signaling under both conditions (Fig. 3C). Histamine (100 μM) raised F340/380 in the neurons from basal levels of 0.48 ± 0.01 to 1.18 ± 0.04 in 0 Ca2+ solutions (P < 0.01, n = 29 cells) and to 0.68 ± 0.02 in 2 mM Ca2+ solutions (P < 0.05, n = 29 cells). Figure 3D shows histograms of the summary data in all tested neurons. Therefore, histamine also mediates both intracellular Ca2+ release and extracellular Ca2+ entry into the neurons.
Fig. 3.
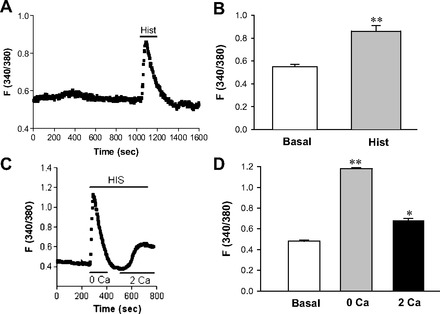
Effect of histamine on [Ca2+]cyt in esophageal enteric neurons. A: after basal lines were stable, addition of histamine (Hist, 100 μM) to 2 mM Ca2+ normal PSS is indicated by a line above the tracings. Values are means ± SE. B: histograms of the summary data of neuronal response to histamine (100 μM) in 2 mM Ca2+ PSS. **P < 0.01 vs. basal levels, n = 30 cells from 6 rats. C: after basal lines were stable, addition of histamine (HIS, 10 μM) to 0 Ca2+ or 2 mM Ca2+ normal PSS is indicated by a line above the tracings. Values are means ± SE. D: histograms of the summary data of neuronal response to histamine (100 μM) in 0 Ca2+ or 2 mM Ca2+ PSS. *P < 0.05 and **P < 0.01 vs. basal levels, n = 29 cells from 5 rats.
Nicotinic acetylcholine receptors, 5-HT, and NMDA receptors.
We also tested neuronal response to ACh (15) and CCh, two agonists of nicotinic acetylcholine receptors (nAChR) (21), 5-HT [for 5-HT receptors (5-HTR)], and NMDA [for NMDA receptors (NMDAR)] (29) in 2 mM Ca2+ solutions. Although some esophageal enteric neurons responded to ACh, better response was observed with CCh, a stable analog of ACh (Fig. 4A). CCh (100 μM) raised F340/380 in the neurons from basal levels of 0.60 ± 0.02 to 0.89 ± 0.05 (1.48-fold increase, P < 0.05, n = 40 cells). Addition of 5-HT and NMDA also raised [Ca2+]cyt in the esophageal neurons (Fig. 4, B and C). 5-HT (100 μM) raised F340/380 in the neurons from basal levels of 0.52 ± 0.02 to 1.66 ± 0.06 (3.19-fold increase, P < 0.01, n = 40 cells), and NMDA (100 μM) raised F340/380 from basal levels of 0.60 ± 0.03 to 1.19 ± 0.06 (1.98-fold increase, P < 0.01, n = 40 cells). Figure 4D shows histograms of the summary data of neuronal responses to CCh, 5-HT, and NMDA. Because nAChR plays an important role in the function of the ENS (18, 32), we further tested the neuronal response to nicotine. Nicotine dose-dependently raised [Ca2+]cyt in the enteric neurons (Fig. 4, E and F). At the concentrations of 30, 50, and 100 μM, F340/380 in the neurons increased from basal levels of 0.58 ± 0.01 to 0.67 ± 0.01, 1.05 ± 0.02, and 1.31 ± 0.03, respectively (P < 0.05 or <0.01, n = 50 cells). Figure 4F shows histograms of summary data of neuronal responses to different concentrations of nicotine. Therefore, our data suggest that nAChR, 5-HTR, and NMDAR are functionally expressed on the esophageal neurons.
Fig. 4.
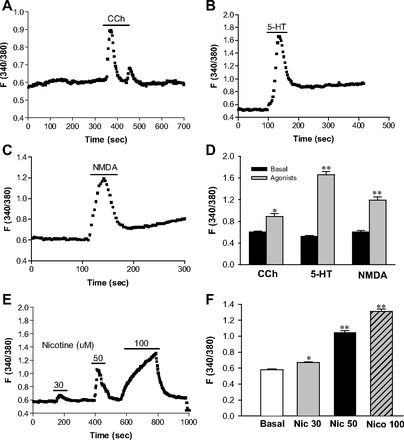
Effects of carbachol (CCh), 5-hydroxytryptamine (5-HT), and N-methyl-d-aspartate (NMDA) on [Ca2+]cyt in esophageal enteric neurons. After basal lines were stable, addition of CCh (100 μM) (A), 5-HT (100 μM) (B), or NMDA (100 μM) (C) to 2 mM Ca2+ normal PSS is indicated by a line above the tracings. D: histograms of the summary data of neuronal responses to CCh, 5-HT, and NMDA in 2 mM Ca2+ PSS. E: nicotine dose dependently raised [Ca2+]cyt in the enteric neurons at the concentrations of 30, 50, and 100 μM. F: histograms of the summary data of neuronal responses to the different concentrations of nicotine (Nic). Values are means ± SE. *P < 0.05 and **P < 0.01 vs. basal levels, n = 40–50 cells from 5–6 rats.
Ca2+-Permeable Channels and Ca2+ Pumps
VGCC.
We tested the function of VGCC using high K+ to depolarize the cell membrane in 2 mM Ca2+ solutions. As shown in Fig. 5A, membrane depolarization induced by high K+ raised [Ca2+]cyt in esophageal neurons, which was significantly blocked by nifedipine (10 μM), a well-known VGCC blocker (Fig. 5B). High K+ (100 mM) raised F340/380 in the neurons from basal levels of 0.56 ± 0.02 to 0.74 ± 0.02 (P < 0.01, n = 40 cells), which was blocked by 10 μM nifedipine (0.52 ± 0.01 of basal levels to 0.56 ± 0.02 with nifedipine, P > 0.05, n = 40 cells). Figure 5C shows histograms of the summary data of neuronal responses to high K+ in the absence and presence of nifedipine. These data suggest the functional expression of VGCC on esophageal neurons, although the subtypes of VGCC need further identification (36).
Fig. 5.
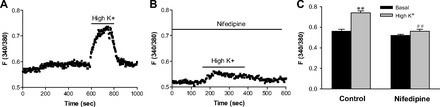
Effect of high potassium and nifedipine on [Ca2+]cyt in esophageal enteric neurons in 2 mM Ca2+ normal PSS. A: after basal lines were stable, addition of high K+ (100 mM) to 2 mM Ca2+ normal PSS is indicated by a line above the tracings. B: after esophageal enteric neurons were pretreated with nifedipine (10 μM) in 2 mM Ca2+ normal PSS for 10 min, addition of high K+ (100 mM) is indicated by a line above the tracings. Values are means ± SE. C: histograms of the summary data of neuronal response to high K+ in the absence or the presence of nifedipine in 2 mM Ca2+ PSS. **P < 0.01 vs. basal levels and ##P < 0.01 vs. high K+ in control, n = 40 cells from 6 rats.
SOC, SERCA, and inositol-1,4,5-trisphosphate receptor.
We tested the SOC function in the esophageal neurons by two approaches: first, in the neurons superfused with Ca2+-free solution (0 Ca), activation of P2Y by ATP caused a rapid increase in [Ca2+]cyt due to Ca2+ release from the ER to the cytosol initially. After ATP-induced Ca2+ mobilization from the ER was complete, restoration of extracellular Ca2+ caused an additional increase in [Ca2+]cyt due to Ca2+ entry through the SOC (Fig. 6A). ATP (10 μM) raised F340/380 in the neurons from basal levels of 0.59 ± 0.02 to 0.90 ± 0.02 in 0 Ca2+ solutions and 0.72 ± 0.03 in 2 mM Ca2+ solutions (P < 0.01 and P < 0.05, n = 39 cells). ATP-induced Ca2+ release from the ER and Ca2+ entry through the SOC was abolished by 2-APB, a blocker of inositol-1,4,5-trisphosphate receptor (IP3R) on the ER membrane and SOC on the plasma membrane (33) (Fig. 6B). After the neurons were treated with 2-APB (100 μM) for 30 min, ATP (10 μM) raised F340/380 in the neurons from basal levels of 0.52 ± 0.02 to 0.55 ± 0.02 in 0 Ca2+ solutions and 0.54 ± 0.02 in 2 mM Ca2+ solutions (P > 0.05, n = 29 cells). Therefore, ATP-induced [Ca2+]cyt in the presence of 2-APB was inhibited by 90% in 0 Ca2+ solutions and by 85% in 2 Ca2+ solutions. Figure 6C shows histograms of the summary data of neuronal responses to ATP in the absence or the presence of 2-APB. Second, we used CPA to specifically prevent SERCA from replenishing the ER Ca2+ stores from the cytosol and found an increase in [Ca2+]cyt (Fig. 7A). CPA (30 μM) raised F340/380 in the neurons from basal levels of 0.54 ± 0.01 to 0.80 ± 0.02 in 2 mM Ca2+ solutions (1.48-fold increase, P < 0.01, n = 39 cells). Taken together, our data strongly suggest the functional expression of SERCA, IP3R, and SOC on the esophageal enteric neurons (43).
Fig. 6.
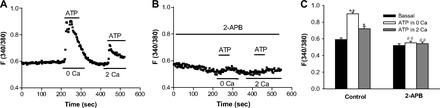
Effect of 2-aminoethoxydiphenyl borate (2-APB) on ATP-induced [Ca2+]cyt in esophageal enteric neurons. A: after basal lines were stable, addition of ATP (10 μM) to 0 Ca2+ or 2 mM Ca2+ normal PSS is indicated by a line above the tracings. B: after esophageal enteric neurons were pretreated with 2-APB (100 μM) in 2 mM Ca2+ normal PSS for 30 min, addition of ATP (10 μM) to 0 Ca2+ or 2 mM Ca2+ normal PSS is indicated by a line above the tracings. Values are means ± SE. C: histograms of the summary data of neuronal response to ATP in the absence or the presence of 2-APB. *P < 0.05 and **P < 0.01 vs. basal levels, n = 39 cells from 5 rats. ##P < 0.01 vs. control, n = 29 cells from 4 rats.
Fig. 7.
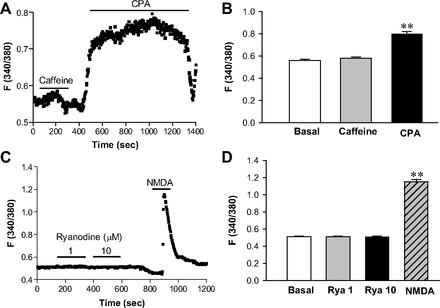
Effects of caffeine and cyclopiazonic acid (CPA) on [Ca2+]cyt in esophageal motor neurons in 2 mM Ca2+ normal PSS. A: after basal lines were stable, addition of caffeine (10 mM) or CPA (30 μM) to 2 mM Ca2+ normal PSS is indicated by a line above the tracings. Values are means ± SE. B: histograms of the summary data of neuronal response to caffeine or CPA. **P < 0.01 vs. basal levels, n = 39 cells from 5 rats. C: after basal lines were stable, addition of ryanodine (1 and 10 μM) or NMDA (100 μM) to 2 mM Ca2+ normal PSS is indicated by lines above the tracings. Values are means ± SE. D: histograms of the summary data of neuronal response to ryanodine (Rya) or NMDA. **P < 0.01 vs. basal levels, n = 50 cells from 6 rats.
Intracellular Ca2+ stores.
We further tested the functionality of intracellular Ca2+ stores in the ER of the esophageal neurons. We used CPA, a selective SERCA blocker, to demonstrate the functional expression of SERCA on the ER (Fig. 7A). However, caffeine (10 mM), a ryanodine receptor (RyR) activator (36), did not raise F340/380 in the neurons in 2 mM Ca2+ solutions (0.56 ± 0.01 of basal levels vs. 0.58 ± 0.01 in the presence of caffeine; P > 0.05, n = 39 cells). Figure 7B shows histograms of the summary data of neuronal responses to caffeine and CPA. Ryanodine (1 and 10 μM), a selective RyR agonist at these concentrations (36), did not raise F340/380 changes in the neurons in 2 mM Ca2+ solutions (0.51 ± 0.01 of basal levels vs. 0.51 ± 0.01 of 1 μM ryanodine and 0.52 ± 0.01 of 10 μM ryanodine; P > 0.05, n = 50 cells). However, same enteric neurons responded to the stimulation of NMDAR (0.51 ± 0.01 of basal levels vs. 1.15 ± 0.03 of 100 μM NMDA; P < 0.01, n = 50 cells, Fig. 7C). Figure 7D shows histograms of the summary data of neuronal responses to ryanodine and NMDA. Taken together, our data suggest that the ryanodine-sensitive Ca2+ store is not the primary intracellular Ca2+ store in the ER of the esophageal neurons.
DISCUSSION
Based upon the morphological, immunocytochemistry, and functional studies, we are confident that our primary culture cells are indeed enteric neurons because: 1) the magnetic bead immunoselection of p75NTR-expressing (p75 neurotrophin receptor, neural marker) was used to specifically isolate neurons from the rat esophagus; 2) the primary culture cells have typically morphological appearance that resembles the intestinal enteric neurons published in the literature; 3) over 95% of the cells stained positive for PGP 9.5 and Milli-Mark, two commonly used neuronal markers; 4) the primary culture cells contain ChAT and nNOS, two important chemicals coding for major neurotransmitters in enteric motor neurons; and 5) the primary culture cells functionally respond to the neurotransmitters commonly identified in the enteric neurons.
Morphological appearance is one of the identifying features of neurons in both the central nervous system and ENS (16, 19). The shape of neurons does not vary across species even with different sizes of animals (6, 7). Because we used enzymes and other processes to isolate neurons from the gastrointestinal tract and primary cultured them, their morphological appearance may not necessarily be the same as the ones in situ. However, we are certain of our ability to obtain primary culture of the esophageal enteric neurons with morphological appearance that resembles the intestinal enteric neurons published in the literature (6, 7, 16, 37).
The neurochemical and morphological identities of all neuron types in the myenteric ganglia of the small intestine of the guinea pig were established about 10 years ago (6, 7, 16, 19). Since then, many markers that define subclasses of intestinal enteric neurons have emerged (6, 7). We performed immunocytochemistry staining to first determine if our cultured esophageal cells are indeed enteric neurons, and our data revealed that over 95% of cells stained positive for two general neuronal markers, PGP 9.5 and Milli-Mark. Our immunocytochemistry staining further revealed that the neurons in primary culture contained excitatory (acetylcholine, ChAT) and inhibitory (nNOS) neurotransmitters, which are the two major neurotransmitters in the enteric motor neurons. ChAT can be found in sensory neurons and excitatory motor neurons, but nNOS is mostly found in the inhibitory motor neurons (19). Sixty six percent of our primary cultured esophageal cells stained positive for nNOS. From the percent of neurons that were stained positive for nNOS and CHAT, it appears that some neurons contained both nNOS and CHAT. In vivo and ex vivo whole gut wall preparation immunostaining studies show that the majority of the neurons contain either nNOS or CHAT but not both. The reason for the above differences is not clear, but it is possible that some of our neurons are not fully differentiated in the primary culture.
In recent years, it has become clear that a large number of plasma membrane receptors express on the neurons of the central and peripheral nervous system. They are the essential components of normal neuronal function (41). These receptors include purinergic receptors, histamine receptors, 5-HTRs, AChR, and glutamate (NMDAR) (19). Most of them are GPCRs, the molecular and functional expression of which have been well documented in the central and enteric neurons (5, 14, 22, 23, 26, 34). These neuronal receptors respond to neurotransmitters, such as ACh, ATP, histamine, 5-HT, and NMDA (19), and, importantly, these neurotransmitters signal through an increase in [Ca2+]cyt, either by directly facilitating Ca2+ influx through an ion channel or through the activation of GPCRs that couple to intracellular Ca2+ stores or VGCC (13). Therefore, assessment of Ca2+ fluxes is a broadly applicable approach for detailed functional studies on neurons. An increase in [Ca2+]cyt in neurons is also an important indicator of the neurotransmitter release because Ca2+ signaling is essential for the neurotransmitter release (38). Although it has been suggested that [Ca2+]cyt is involved in the action potential generation of myenteric neurons in the esophagus (12), functional characterization of membrane receptors expressed on the esophageal enteric neurons has not been performed in terms of Ca2+-signaling pathways. We therefore characterized Ca2+ responses to several stimulators and inhibitors of endogenous GPCRs on the primary cultured esophageal enteric neurons.
Broadly, purinergic receptors are divided into two groups: ligand-gated ion channels (P2X) and GPCRs (P2Y) (17). Several subtypes of purinergic receptors respond to ATP with increases in [Ca2+]cyt (41). Our data show that ATP induced Ca2+ signaling in 0 Ca2+ or 2 mM Ca2+ solutions, suggesting that ATP induced both intracellular Ca2+ release from the ER stores and extracellular Ca2+ entry. Because of the lack of highly selective pharmacological modulators of purinergic receptors, it is currently difficult to functionally assess the precise receptor subtypes involved in these responses. However, the ability of ATP to elicit Ca2+ responses in the absence of extracellular Ca2+ (0 Ca) suggests predominant involvement of P2Y rather than P2X receptors on these neurons (41).
All four subtypes of histamine receptors, H1–H4, belong to the GPCR family of receptors, with H1 linked to intracellular Ca2+ mobilization through Gq-coupled inositol-1,4,5-trisphosphate (IP3) production and subsequent store release (41). H2, H3, and H4 receptors are also thought to couple to other G protein effectors, including adenylate cyclase and VGCC. While H1 and H2 subtypes demonstrate relatively low affinity to histamine (EC50 over 10 μM), H3 and H4 receptors are high-affinity histamine receptors with EC50 values in the nanomolar range (28, 30, 31). In the present study, the ability of histamine (100 μM) to elicit Ca2+ responses in the absence of extracellular Ca2+ (0 Ca) suggests predominant involvement of H1 rather than H2–H4 receptors (41).
Although AChR, 5-HTR, and NMDAR are well documented on intestinal enteric neurons (5, 14, 22, 23, 26, 34), their expression and function on esophageal enteric neurons in primary culture have not been studied previously. Our data reveal the functional expression of AChR, 5-HTR, and NMDAR on esophageal enteric neurons, although the subtypes of these receptors need further identification. We also demonstrate that activation of these receptors triggers Ca2+ signaling in the esophageal enteric neurons, which is consistent with the previous reports that neural NMDAR and most subtypes of AChR and 5-HTR are coupled to the intracellular Ca2+ pathway (15, 21). Because NMDAR is mainly expressed in the neurons, its functional identification in our primary culture cells further supports that these cells are indeed enteric neurons. However, the physiological function of these receptors on esophageal enteric neurons needs further investigation using their specific antagonists and genetic knockdown/knockout approaches.
Ion channels and pumps are also the essential components of the normal neuronal function (41). These include VGCC, SOC, and SERCA. Although VGCC can be classified into six different subtypes based on their functional characteristics, L- and N-type channels are the important channels for voltage-gated Ca2+ entry into neurons (11, 36). Both types of VGCC are not only controlled directly by membrane depolarization but can also be targeted indirectly through the GPCRs by a host of intracellular second-messenger systems that are activated by various agonists (13). Because molecular expression of L- and N-type VGCC was shown previously on esophageal enteric neurons (11, 12), we further demonstrated functional expression of these channels and their involvement in Ca2+ signaling in these particular neurons. Our data show that membrane depolarization induced Ca2+ signaling, which was blocked by nifedipine, a selective blocker of both L- and N-type VGCC (40), providing further evidence for their function in esophageal enteric neurons.
Stimulation of membrane receptors (such as GPCR) results in activation of phospholipase C and production of IP3 (1), which stimulates the IP3R. The latter is a Ca2+ release channel on the ER membrane that releases Ca2+ from the ER into the cytosol (43). It leads to the depletion of ER Ca2+ store. Upon depletion of Ca2+ from the ER, a Ca2+ deficiency signal is transmitted to SOC on the plasma membrane, causing SOC to open and allow extracellular Ca2+ to flow into the cytosol. The above process is referred to as the store-operated Ca2+ entry (SOCE). The cytosolic Ca2+ is then sequestered into the ER by the SERCA, thus replenishing Ca2+ stores. Although somewhat controversial, many agree that the stromal interacting molecule, Orai channels (27), and transient receptor potential channels (8, 43) are the essential components involved in SOCE and play an important role in the increase in [Ca2+]cyt and refilling of Ca2+ into the intracellular stores (43). We have demonstrated the IP3-sensitive Ca2+ store and its involvement in the function of SOC in esophageal enteric neurons although the molecular candidates of SOC on these neurons need further identification.
Enteric neurons have an elaborate smooth ER that stores intracellular Ca2+ in sequestered compartments within the cytosol (33, 36). Both IP3R and RyR distributed throughout the ER are responsible for releasing Ca2+ from this internal store (2). Although both receptors appear to be on discrete and separated Ca2+ stores, they share a partial functional overlap in generating a Ca2+ response (33, 36). We have demonstrated the existence of an IP3-sensitive Ca2+ store in the ER of the esophageal enteric neurons since ATP and histamine activated GPCR and then released Ca2+ from intracellular store in the absence of extracellular Ca2+, which was abolished by 2-APB, an IP3R antagonist (33). In addition, CPA induced an increase in [Ca2+]cyt by preventing the SERCA from replenishing the IP3-sensitive Ca2+ stores in the ER. However, we did not functionally identify a ryanodine-sensitive Ca2+ store in the ER since these neurons did not respond to caffeine and ryanodine, two commonly used RyR agonists (36). Therefore, the IP3-sensitive Ca2+ store rather than the ryanodine-sensitive Ca2+ store is likely the primary intracellular Ca2+ store in the ER of the esophageal enteric neurons although the subtypes of IP3 receptor expression on these neurons need further identification. Moreover, our data revealed the functional expression of SERCA on the ER of esophageal enteric neurons. SERCA is also a key player in controlling [Ca2+]cyt signaling (3), which is involved in many aspects of neuronal function (10). Membrane receptor stimulation and/or membrane depolarization of active cells cause an extensive influx of Ca2+ into the cytoplasm. Afterward, to reduce [Ca2+]cyt for proper cellular functions, SERCA uses ATP to actively pump [Ca2+]cyt into the ER for storage (3, 10). Therefore, these data further indicate the functional integrity of our esophageal enteric neurons in primary cultures.
One of the limitations in our study is that we isolated enteric neurons from the rat esophagus, which is composed of striated muscle. The role of myenteric neurons in the skeletal muscle peristalsis is not known. It is possible though that some myenteric neurons located in the distal esophagus actually innervate the LES. The major purpose of our study was to establish the methodology of isolating, growing in culture, and testing the functionality of esophageal neurons. We believe our methodology can be applied to the animals and humans with a smooth muscle esophagus.
In summary, we show the feasibility of isolating and primary culturing the esophageal enteric neurons. We characterized these neurons morphologically, immunocytochemically, and functionally. We also provided the first evaluation of Ca2+ signaling for the study of membrane receptors and ion channels in single esophageal enteric neurons. While precise identification of their specific subtypes remains to be verified on these neurons at the levels of mRNA and proteins, insight into possible subtypes involved was provided by pharmacological characterization using specific agonists and antagonists. Systematic characterization of these receptors and channels endogenously expressed in the esophageal enteric neurons is likely to enhance our understanding of neuronal signaling and their functional role in the regulation of esophageal motility.
GRANTS
This work was supported by a Veterans Affair Merit Grant to R. K. Mittal.
DISCLOSURES
No conflicts of interest, financial or otherwise, are declared by the authors.
AUTHOR CONTRIBUTIONS
Author contributions: H.D. and R.K.M. conception and design of research; H.D. and Y.J. performed experiments; H.D. and Y.J. analyzed data; H.D. and R.K.M. interpreted results of experiments; H.D. and Y.J. prepared figures; H.D. and Y.J. drafted manuscript; H.D., Y.J., S.S., and R.K.M. edited and revised manuscript; H.D. and R.K.M. approved final version of manuscript.
REFERENCES
- 1.Alicia S, Angelica Z, Carlos S, Alfonso S, Vaca L. STIM1 converts TRPC1 from a receptor-operated to a store-operated channel: Moving TRPC1 in and out of lipid rafts. Cell Calcium 44: 479–491, 2008. [DOI] [PubMed] [Google Scholar]
- 2.Berridge MJ. Capacitative calcium entry. Biochem J 312: 1–11, 1995. [DOI] [PMC free article] [PubMed] [Google Scholar]
- 3.Berridge MJ, Bootman MD, Roderick HL. Calcium signalling: dynamics, homeostasis and remodelling. Nat Rev Mol Cell Biol 4: 517–529, 2003. [DOI] [PubMed] [Google Scholar]
- 4.Bornstein JC, Costa M, Grider JR. Enteric motor and interneuronal circuits controlling motility. Neurogastroenterol Motil 16, Suppl 1: 34–38, 2004. [DOI] [PubMed] [Google Scholar]
- 5.Bowie D. Ionotropic glutamate receptors & CNS disorders. CNS Neurol Disord Drug Targets 7: 129–143, 2008. [DOI] [PMC free article] [PubMed] [Google Scholar]
- 6.Brehmer A, Schrodl F, Neuhuber W. Morphological classifications of enteric neurons–100 years after Dogiel. Anat Embryol (Berl) 200: 125–135, 1999. [DOI] [PubMed] [Google Scholar]
- 7.Brehmer A, Schrodl F, Neuhuber W, Hens J, Timmermans JP. Comparison of enteric neuronal morphology as demonstrated by Dil-tracing under different tissue-handling conditions. Anat Embryol (Berl) 199: 57–62, 1999. [DOI] [PubMed] [Google Scholar]
- 8.Cheng KT, Ong HL, Liu X, Ambudkar IS. Contribution of TRPC1 and Orai1 to Ca(2+) entry activated by store depletion. Adv Exp Med Biol 704: 435–449, 2011. [DOI] [PMC free article] [PubMed] [Google Scholar]
- 9.Chow JY, Estrema C, Orneles T, Dong X, Barrett KE, Dong H. Calcium-sensing receptor modulates extracellular Ca(2+) entry via TRPC-encoded receptor-operated channels in human aortic smooth muscle cells. Am J Physiol Cell Physiol 301: C461–C468, 2011. [DOI] [PMC free article] [PubMed] [Google Scholar]
- 10.Clapham DE. Calcium signaling. Cell 131: 1047–1058, 2007. [DOI] [PubMed] [Google Scholar]
- 11.De Laet A, Adriaensen D, Van Bogaert PP, Scheuermann DW, Timmermans JP. Immunohistochemical localization of voltage-activated calcium channels in the rat oesophagus. Neurogastroenterol Motil 14: 173–181, 2002. [DOI] [PubMed] [Google Scholar]
- 12.De Laet A, Cornelissen W, Adriaensen D, Van Bogaert PP, Scheuermann DW, Timmermans JP. Ca2+ involvement in the action potential generation of myenteric neurones in the rat oesophagus. Neurogastroenterol Motil 14: 161–172, 2002. [DOI] [PubMed] [Google Scholar]
- 13.Dolphin AC. G protein modulation of voltage-gated calcium channels. Pharmacol Rev 55: 607–627, 2003. [DOI] [PubMed] [Google Scholar]
- 14.Dray A. Neuropathic pain: emerging treatments. Br J Anaesth 101: 48–58, 2008. [DOI] [PubMed] [Google Scholar]
- 15.Farre R, Sifrim D. Regulation of basal tone, relaxation and contraction of the lower oesophageal sphincter. Relevance to drug discovery for oesophageal disorders. Br J Pharmacol 153: 858–869, 2008. [DOI] [PMC free article] [PubMed] [Google Scholar]
- 16.Foong JP, Nguyen TV, Furness JB, Bornstein JC, Young HM. Myenteric neurons of the mouse small intestine undergo significant electrophysiological and morphological changes during postnatal development. J Physiol 590: 2375–2390, 2012. [DOI] [PMC free article] [PubMed] [Google Scholar]
- 17.Franke H, Krugel U, Illes P. P2 receptors and neuronal injury. Pflugers Arch 452: 622–644, 2006. [DOI] [PubMed] [Google Scholar]
- 18.Furness J. Structure of the enteric nervous system. Enteric Nerv Sys 1, 2006. [Google Scholar]
- 19.Furness JB. The enteric nervous system and neurogastroenterology. Nat Rev Gastroenterol Hepatol 9: 286–294, 2012. [DOI] [PubMed] [Google Scholar]
- 20.Grynkiewicz G, Poenie M, Tsien RY. A new generation of Ca2+ indicators with greatly improved fluorescence properties. J Biol Chem 260: 3440–3450, 1985. [PubMed] [Google Scholar]
- 21.Harrington AM, Hutson JM, Southwell BR. Cholinergic neurotransmission and muscarinic receptors in the enteric nervous system. Prog Histochem Cytochem 44: 173–202, 2010. [DOI] [PubMed] [Google Scholar]
- 22.Hogg RC, Raggenbass M, Bertrand D. Nicotinic acetylcholine receptors: from structure to brain function. Rev Physiol Biochem Pharmacol 147: 1–46, 2003. [DOI] [PubMed] [Google Scholar]
- 23.Jensen AA, Frolund B, Liljefors T, Krogsgaard-Larsen P. Neuronal nicotinic acetylcholine receptors: structural revelations, target identifications, and therapeutic inspirations. J Med Chem 48: 4705–4745, 2005. [DOI] [PubMed] [Google Scholar]
- 24.Jiang Y, Bhargava V, Lal HA, Mittal RK. Variability in the muscle composition of rat esophagus and neural pathway of lower esophageal sphincter relaxation. Am J Physiol Gastrointest Liver Physiol 301: G1014–G1019, 2011. [DOI] [PubMed] [Google Scholar]
- 25.Jiang Y, Sandler B, Bhargava V, Mittal RK. Antireflux action of Nissen fundoplication and stretch-sensitive mechanism of lower esophageal sphincter relaxation. Gastroenterology 140: 442–449, 2011. [DOI] [PubMed] [Google Scholar]
- 26.Khosravani H, Zamponi GW. Voltage-gated calcium channels and idiopathic generalized epilepsies. Physiol Rev 86: 941–966, 2006. [DOI] [PubMed] [Google Scholar]
- 27.Lewis RS. Store-operated calcium channels: new perspectives on mechanism and function. Cold Spring Harb Perspect Biol 3, 2011. [DOI] [PMC free article] [PubMed] [Google Scholar]
- 28.Liu C, Ma X, Jiang X, Wilson SJ, Hofstra CL, Blevitt J, Pyati J, Li X, Chai W, Carruthers N, Lovenberg TW. Cloning and pharmacological characterization of a fourth histamine receptor (H(4)) expressed in bone marrow. Mol Pharmacol 59: 420–426, 2001. [DOI] [PubMed] [Google Scholar]
- 29.Liu MT, Rothstein JD, Gershon MD, Kirchgessner AL. Glutamatergic enteric neurons. J Neurosci 17: 4764–4784, 1997. [DOI] [PMC free article] [PubMed] [Google Scholar]
- 30.Lovenberg TW, Pyati J, Chang H, Wilson SJ, Erlander MG. Cloning of rat histamine H(3) receptor reveals distinct species pharmacological profiles. J Pharmacol Exp Ther 293: 771–778, 2000. [PubMed] [Google Scholar]
- 31.Lovenberg TW, Roland BL, Wilson SJ, Jiang X, Pyati J, Huvar A, Jackson MR, Erlander MG. Cloning and functional expression of the human histamine H3 receptor. Mol Pharmacol 55: 1101–1107, 1999. [PubMed] [Google Scholar]
- 32.Mandl P, Kiss JP. Role of presynaptic nicotinic acetylcholine receptors in the regulation of gastrointestinal motility. Brain Res Bull 72: 194–200, 2007. [DOI] [PubMed] [Google Scholar]
- 33.Parekh AB, Putney JW., Jr Store-operated calcium channels. Physiol Rev 85: 757–810, 2005. [DOI] [PubMed] [Google Scholar]
- 34.Raggenbass M, Bertrand D. Nicotinic receptors in circuit excitability and epilepsy. J Neurobiol 53: 580–589, 2002. [DOI] [PubMed] [Google Scholar]
- 35.Schemann M, Neunlist M. The human enteric nervous system. Neurogastroenterol Motil 16, Suppl 1: 55–59, 2004. [DOI] [PubMed] [Google Scholar]
- 36.Smith TK, Kang SH, Vanden Berghe P. Calcium channels in enteric neurons. Curr Opin Pharmacol 3: 588–593, 2003. [DOI] [PubMed] [Google Scholar]
- 37.Song ZM, Brookes SJ, Costa M. Projections of specific morphological types of neurons within the myenteric plexus of the small intestine of the guinea-pig. Cell Tissue Res 285: 149–156, 1996. [DOI] [PubMed] [Google Scholar]
- 38.Suudhof TC. Neurotransmitter release. Handb Exp Pharmacol 184: 1–21, 2008. [DOI] [PubMed] [Google Scholar]
- 39.Takahashi A, Camacho P, Lechleiter JD, Herman B. Measurement of intracellular calcium. Physiol Rev 79: 1089–1125, 1999. [DOI] [PubMed] [Google Scholar]
- 40.Uneyama H, Takahara A, Dohmoto H, Yoshimoto R, Inoue K, Akaike N. Blockade of N-type Ca2+ current by cilnidipine (FRC-8653) in acutely dissociated rat sympathetic neurones. Br J Pharmacol 122: 37–42, 1997. [DOI] [PMC free article] [PubMed] [Google Scholar]
- 41.Vetter I, Lewis RJ. Characterization of endogenous calcium responses in neuronal cell lines. Biochem Pharmacol 79: 908–920, 2010. [DOI] [PubMed] [Google Scholar]
- 42.Worl J, Neuhuber WL. Enteric co-innervation of motor endplates in the esophagus: state of the art ten years after. Histochem Cell Biol 123: 117–130, 2005. [DOI] [PubMed] [Google Scholar]
- 43.Worley PF, Zeng W, Huang GN, Yuan JP, Kim JY, Lee MG, Muallem S. TRPC channels as STIM1-regulated store-operated channels. Cell Calcium 42: 205–211, 2007. [DOI] [PMC free article] [PubMed] [Google Scholar]