

Abstract
EVI1 (ecotropic viral integration site 1) is one of the most aggressive oncogenes associated with myeloid leukemia. We investigated DNA copy number aberrations in human hepatocellular carcinoma (HCC) cell lines using a high-density oligonucleotide microarray. We found that a novel amplification at the chromosomal region 3q26 occurs in the HCC cell line JHH-1, and that MECOM (MDS1 and EVI1 complex locus), which lies within the 3q26 region, was amplified. Quantitative PCR analysis of the three transcripts transcribed from MECOM indicated that only EVI1, but not the fusion transcript MDS1–EVI1 or MDS1, was overexpressed in JHH-1 cells and was significantly upregulated in 22 (61%) of 36 primary HCC tumors when compared with their non-tumorous counterparts. A copy number gain of EVI1 was observed in 24 (36%) of 66 primary HCC tumors. High EVI1 expression was significantly associated with larger tumor size and higher level of des-γ-carboxy prothrombin, a tumor marker for HCC. Knockdown of EVI1 resulted in increased induction of the cyclin-dependent kinase inhibitor p15INK4B by transforming growth factor (TGF)-β and decreased expression of c-Myc, cyclin D1, and phosphorylated Rb in TGF-β-treated cells. Consequently, knockdown of EVI1 led to reduced DNA synthesis and cell viability. Collectively, our results suggest that EVI1 is a probable target gene that acts as a driving force for the amplification at 3q26 in HCC and that the oncoprotein EVI1 antagonizes TGF-β-mediated growth inhibition of HCC cells.
Keywords: Cyclin-dependent kinase inhibitor p15, EVI1, gene amplification, hepatocellular carcinoma, transforming growth factor β
Hepatocellular carcinoma is the third leading cause of cancer death worldwide.1 Several risk factors for HCC have been reported, including infection with hepatitis B and hepatitis C viruses, and alcohol consumption. However, the molecular pathogenesis of this widespread type of cancer remains poorly understood.
Amplification of DNA in certain regions of chromosomes plays a crucial role in the development and progression of human malignancies, specifically when proto-oncogenic target genes within those amplicons are overexpressed. A common criterion for designation of a gene as a putative target of amplification is that gene amplification leads to its overexpression.2
To identify genes potentially involved in HCC, we investigated DNA copy number aberrations in human HCC cell lines using high-resolution SNP arrays. Here we show that a novel amplification at the chromosomal region 3q26 occurs in an HCC cell line and that the oncogene EVI1, which lies within the 3q26 region, was amplified.
The EVI1 gene codes for a zinc finger transcriptional factor that plays an important role in normal development and in oncogenesis.3 EVI1 was first identified in mice as the integration site of an ecotropic retrovirus that leads to murine myeloid leukemia.4 In humans, rearrangements of chromosome 3q26 often activate EVI1 expression in AML, chronic myeloid leukemia, and myelodysplastic syndrome. High EVI1 expression also occurs in AML patients without 3q26 rearrangements, suggesting that other mechanisms of aberrant EVI1 expression exist.3 Importantly, high EVI1 expression is an independent negative prognostic indicator of survival in AML.5 Although the majority of investigations have focused on the contribution of EVI1 to the pathogenesis and clinical characteristics of hematopoietic malignancies, overexpression of EVI1 has also been found in several solid tumors.6–8 However, little is known about its relevance for HCC.
The oncoprotein EVI1 has been reported to influence a number of signaling pathways. Thus, EVI1 activates the PI3K/AKT and RAS/ERK signaling pathways.9–11 Moreover, EVI1 has been reported to suppress TGF-β signaling by inhibiting Smad3.12 Transforming growth factor-β acts as a tumor suppressor by arresting the growth of cells in the early stages of cancer and, paradoxically, contributes to the phenotype of tumor invasiveness by promoting EMT in the late stages of cancer.13 Transforming growth factor-β inhibition of proliferation is complex and affects a number of signaling targets including CDK inhibitor p15INK4B and c-Myc. Briefly, TGF-β induces p15INK4B expression. The induced p15INK4B forms a complex with CDK4 and prevents the activation of CDK4 by cyclin D1, thereby resulting in inhibition of CDK4-mediated Rb phosphorylation. The Rb protein inhibits entry into the cell-division cycle when it is unphosphorylated and, conversely, phosphorylation of Rb by the complex of CDK4 and cyclin D1 encourages cell proliferation. The TGF-β-induced p15INK4B expression shuts down cell-cycle progression in the early/mid G1 phase of the cell cycle. Although c-Myc can repress the expression of p15INK4B, this action of c-Myc is preemptively blocked by TGF-β, which dispatches Smad3 to form a complex with E2F4 or E2F5 plus p107 that represses expression of the c-Myc gene,13 thereby ensuring that TGF-β succeeds in inducing the expression of p15INK4B. Thus, TGF-β influences a number of key signaling molecules to inhibit cell proliferation and suppress the early stages of cancer growth.
Here, we provide evidence that EVI1 is a novel target gene that acts as a driving force for the amplification at 3q26 in HCC and that EVI1 antagonizes the growth inhibition mediated by TGF-β in HCC cells.
Materials and Methods
Reagents and antibodies
Antibodies against EVI1 (#2593; C50E12), cyclin D1 (#2922), c-Myc (#5605; D84C12), phospho-Rb (#9308), poly (ADP-ribose) polymerase (#9542), BrdU (#5292; Bu20a), and β-actin (#4967) were purchased from Cell Signaling Technology (Beverly, MA, USA). The antibody against p15INK4B (ab53034) was purchased from Abcam (Cambridge, UK). Small interfering RNA duplex oligoribonucleotides targeting EVI1 and negative control siRNA duplexes were purchased from Ambion (Foster City, CA, USA). Human TGF-β1 was obtained from R&D Systems (Minneapolis, MN, USA).
Cell lines and tumor samples
Twenty HCC cell lines14 were obtained from ATCC (Manassas, VA, USA) and the JCRB Cell Bank (Osaka, Japan). All cell lines were maintained in DMEM supplemented with 10% FCS. Primary HCC tissues were obtained from patients who underwent surgery at the Hospital of Tokyo Medical and Dental University (Tokyo, Japan). All specimens were immediately frozen in liquid nitrogen and stored at −80°C until required. Genomic DNA and total RNA were isolated as described previously.14 Sixty-six tumor samples were available for DNA analyses, and 36 paired tumor and non-tumor samples were available for mRNA analyses. The protocol of this study was approved by ethics committees and carried out in accordance with the Declaration of Helsinki. Informed consent was obtained from each patient.
Array analysis
DNA copy number changes were analyzed using the GeneChip Mapping 100K array set or the 250K Sty array (Affymetrix, Santa Clara, CA, USA) according to the instructions from the manufacturer, as described previously.14,15
Fluorescence in situ hybridization
Fluorescence in situ hybridization was carried out using the BACs RP11-721P22 and RP11-137H17 as probes (Invitrogen, Carlsbad, CA, USA), as described previously.14 The BACs were selected based on their homology to locations in the human genome according to the database provided by the University of California Santa Cruz (http://genome.ucsc.edu/).
Real-time Quantitative PCR
Genomic DNA of EVI1 was quantified using a real-time fluorescence detection method, as described previously.14 Transcripts of EVI1, MDS1-EVI1, and MDS1 were quantified using the StepOnePlus real-time PCR system (Applied Biosystems, Foster City, CA, USA) and TaqMan universal PCR master mix (Applied Biosystems) with specific primers and TaqMan probes, as described previously.7 The EVI1 probe (against EVI1 exon 1) is designed to specifically recognize EVI1 but not the fusion transcript, MDS1–EVI1. The MDS1–EVI1 probe recognizes the mRNA fusion site and is specific to MDS1/EVI1. The MDS1 probe (against MDS1 exon 4) recognizes a domain that is not included in the MDS1–EVI1 fusion gene. ACTB expression was used as an endogenous control for mRNA levels, and the long interspersed nuclear element 1 was used as an endogenous control for genomic DNA levels. Real-time quantitative RT-PCR experiments for SERPINE1 (PAI-1), CDKN2B (p15INK4B), CCND1 (cyclin D1), MYC (c-Myc), and ITGA1 (integrin α1) were carried out, as described previously.14 The sequences of the primers and probes used are shown in Table S1.
Immunoblotting
Immunoblotting was carried out as described previously.14 All antibodies were used at dilutions of 1:1000, with the exception of anti-β-actin antibody (1:5000). For immunodetection, secondary anti-rabbit IgG or anti-mouse IgG (Amersham, Piscataway, NJ, USA) antibodies were used at a dilution of 1:5000. Antibody binding was detected using the ECL system (Amersham).
RNA interference and TGF-β treatment
The two siRNAs targeting EVI1 (#1 and #2) and control (non-silencing) siRNA were delivered into cells using Lipofectamine RNAiMAX (Invitrogen), according to the manufacturer’s protocol. The medium was replaced with medium without FCS 48 h after transfection, and cells were cultured overnight. A final concentration of 10 ng/mL TGF-β1 or vehicle was then added to medium without FCS. After 24 h of incubation in the presence of TGF-β1, cells were harvested for RT-PCR and immunoblotting analyses, or cells were labeled with BrdU for 6 h. Incorporation of BrdU was determined using the Cell Proliferation ELISA, BrdU (colorimetric) (Roche, Basel, Switzerland). Cell viability was determined using the WST-8 assay (Cell Counting Kit-8; Dojindo, Kumamoto, Japan).
Enforced expression of EVI1
The full-length human EVI1 expression vector (#RC226310) was obtained from OriGene (Rockville, MD, USA). The EVI1 expression vector, or the empty vector, was transfected into cells using the Effectene Transfection Reagent kit (Qiagen, Venlo, Netherlands) according to the manufacturer’s instructions. The medium was replaced with medium without FCS 48 h after transfection, and the cells were cultured overnight. Transforming growth factor-β1 at a final concentration of 10 ng/mL was then added to medium without FCS. After 12 h incubation in the presence of TGF-β1, the cells were labeled with BrdU for 12 h and were then analyzed using immunofluorescence.
Immunofluorescence
Cells were fixed with 4% paraformaldehyde and were then incubated with a combination of anti-EVI1 (1:500) and anti-BrdU (1:200) antibodies. Alexa Fluor 555-conjugated anti-rabbit IgG and Alexa Fluor 488-conjugated anti-mouse IgG (Cell Signaling Technology) were used to detect the primary antibodies. Nuclei were counterstained with DAPI (Sigma-Aldrich, St Louis, MO, USA). Positive cells were counted.
Statistical analysis
Statistical analyses were carried out using spss 15.0 software (SPSS, Chicago, IL, USA). Comparisons were made using the Wilcoxon signed-rank test, Student’s t-test, anova, χ2-test, or the Mann–Whitney U-test. P-values < 0.05 were considered to indicate statistical significance.
Results
Detection of 3q26 amplicon
Twenty HCC cell lines were screened for DNA copy number aberrations using GeneChip Mapping 100K and 250K arrays. Gains at the chromosomal region 3q26 were frequently found in 11 (55%) of the 20 cell lines (Fig.1a). Of these cell lines, JHH-1 cells showed a high-level copy number gain that is indicative of gene amplification at 3q26 (Fig.1b). The estimated extent of the amplification in JHH-1 cells was approximately 1.0 Mb. This chromosomal region lies between the Affymetrix markers, SNP_A-1696905 and SNP_A-1677515, and includes only MECOM, which is an officially assigned, but rarely used, gene name (Fig.1b). MECOM consists of MDS1 and EVI1 genes.
Fig 1.
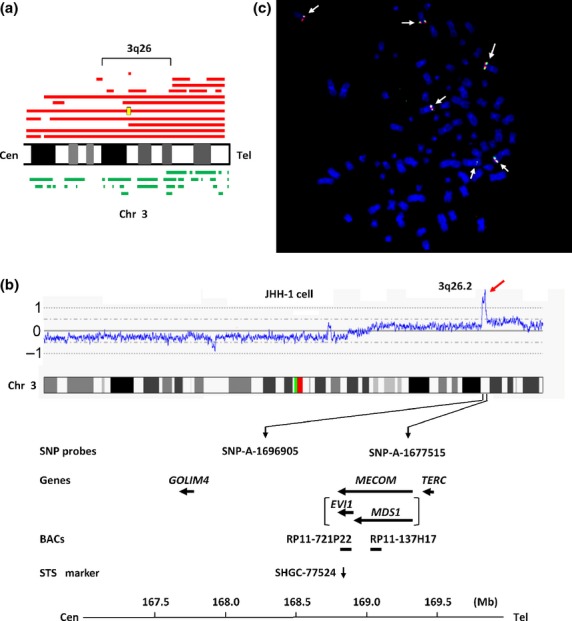
Map of the amplicon at 3q26 in the JHH-1 hepatocellular carcinoma (HCC) cell line. (a) Recurrent copy number gains on the chromosomal region 3q26 in HCC cell lines assessed using a GeneChip Mapping array. Copy number gains are indicated by red horizontal lines above the chromosome ideogram. A high-level gain (amplification) is indicated by the yellow rectangle. Copy number losses are indicated by green lines under the chromosome ideogram. Each horizontal line represents an aberration detected in a single HCC cell line. (b) Copy number profile of chromosome (Chr) 3 in JHH-1 cells. The position of the Affymetrix single nucleotide polymorphism (SNP) probes, the genes present, the bacterial artificial chromosomes (BACs) used as probes for FISH experiments, and the sequence-tagged site (STS) marker used for real-time quantitative PCR are shown based on the University of California Santa Cruz genome database. (c) Representative images of FISH analysis of metaphase chromosomes from JHH-1 cells using the following bacterial artificial chromosome probes: paired RP11-721P22 (containing EVI1; green) and RP11-137H17 (containing MDS1; red). The arrow indicates six signals each for red and green. Cen, centromere; Tel, telomere.
Whereas EVI1 possesses its own transcription start site(s), mRNA transcripts initiating at MDS1, located upstream of EVI1, can splice from exon 2 of MDS1 into exon 2 of EVI1 to form the fusion transcript, MDS1–EVI1. Both MDS1 and MDS1–EVI1 are expressed independently of EVI1.
To confirm amplification of MDS1 and EVI1 in JHH-1 cells, these cells were analyzed using FISH with the BACs, RP11-721P22 (containing EVI1) and RP11-137H17 (containing MDS1), as probes. This analysis indicated an increase in the number of RP11-721P22 and RP11-137H17 FISH signals (six signals each) (Fig.1c). These data confirm that MDS1 and EVI1 are amplified in JHH-1 cells.
DNA copy number and expression of EVI1 in HCC cell lines
The DNA copy number of EVI1 was then determined in the 20 HCC cell lines by using quantitative PCR. The sequence-tagged site marker, SHGC-77524, which is specific for EVI1, was used for this PCR (Fig.1b). For this analysis, copy number changes were counted as gains if the copy number for a given tumor cell line exceeded the mean plus two standard deviations of that in normal lymphocytes. A copy number gain of EVI1 was observed in seven (35%) of the 20 cell lines (Fig.2a). As expected, JHH-1 cells showed the highest copy number gain.
Fig 2.

DNA copy number of EVI1, mRNA levels of EVI1, MDS1–EVI1, and MDS1, and EVI1 protein expression in hepatocellular carcinoma (HCC) cell lines. (a) DNA copy number of EVI1 in 20 HCC cell lines and four normal peripheral blood lymphocytes as measured by quantitative PCR. Values are normalized such that the average copy number in genomic DNA derived from four normal lymphocytes has a value of 1 (solid horizontal line). A value corresponding to the mean + two SD of the copy number of normal lymphocytes was used as the cut-off value for copy number gain (dotted line). Asterisks indicate cell lines showing copy number gain. (b) Relative levels of EVI1, MDS1–EVI1, and MDS1 mRNAs in 18 HCC cell lines as determined by quantitative TaqMan PCR. (c) Immunoblot analyses of EVI1 protein in the indicated cell lines. β-actin was blotted as an internal control.
As EVI1, MDS1–EVI1, and MDS1 can all be transcribed from the MECOM locus, we next determined which transcript might be the target that acts as a driving force for the 3q26 amplification. We therefore used different primer and probe combinations to discriminate between EVI1, MDS1–EVI1, and MDS1 and quantified their transcript levels in 18 of the HCC cell lines using quantitative TaqMan PCR analysis. EVI1 and MDS1–EVI1, but not MDS1, were overexpressed in JHH-1 cells relative to the other cell lines (Fig.2b).
To confirm that enhanced EVI1 and MDS1–EVI1 transcription resulted in enhanced protein expression, we further analyzed EVII protein expression in a number of these cell lines. Immunoblot analysis using the anti-EVI1 antibody showed that EVI1 protein expression was upregulated in JHH-1 cells relative to the other cell lines (Fig.2c). Three forms of EVI1 protein were detected: MDS1–EVI1, EVI1, and the truncated form of EVI1 (EVI1Δ).3 The MDS1–EVI1 protein is of higher molecular weight as it possesses 188 additional amino acids at its N-terminus, which is encoded by exon 1 and 2 of MDS1 and exon 2 and the untranslated part of exon 3 of EVI1, in addition to the entire EVI1 sequence.16 Of these three forms, the EVI1 protein was the most prominent.
DNA copy number and expression of EVI1 in primary HCC tumors
To determine whether the amplification of EVI1 that was observed in JHH-1 cells was relevant to primary human carcinomas, the copy number of EVI1 in primary HCC tumors was determined by quantitative PCR using a method similar to that used for the cell lines. A copy number gain of EVI1 was observed in 24 (36%) of the 66 tumors (Fig.3a).
Fig 3.
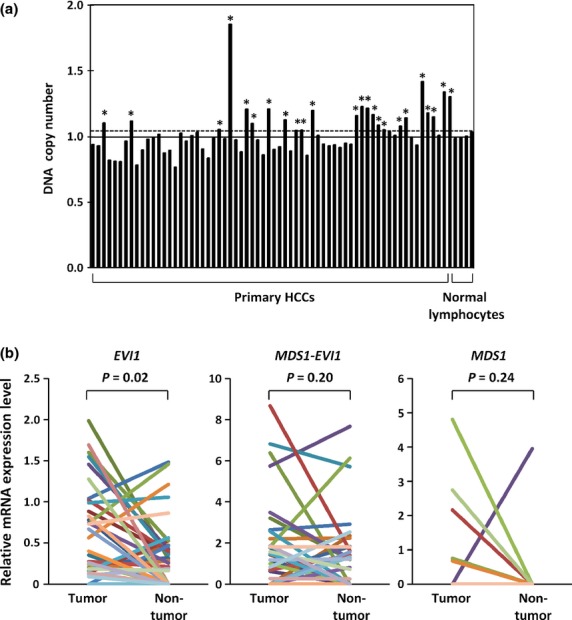
DNA copy number of EVI1 and mRNA levels of EVI1, MDS1–EVI1, and MDS1 in primary hepatocellular carcinoma (HCC) tumors. (a) DNA copy number of EVI1 in 66 primary HCC tumors and four normal peripheral blood lymphocytes was determined by quantitative PCR. $Primary tumors showing copy number gain. (b) Relative levels of EVI1, MDS1–EVI1, and MDS1 mRNA in paired tumor and non-tumor tissues from 36 patients with primary HCC.
Next, the mRNA levels of EVI1, MDS1–EVI1, and MDS1 were measured in paired tumor and non-tumor liver tissues from 36 of the HCC patients using quantitative TaqMan PCR (Fig.3b). EVI1, MDS1–EVI1, and MDS1 mRNAs were detectable in 32, 25, and 5 of the 36 HCC tumors, respectively, and in 22, 19, and 1 of the 36 non-tumor liver tissues, respectively. Only EVI1, but not MDS1–EVI1 or MDS1, was significantly overexpressed in 22 (61%) of the 36 HCC tumors when compared with their non-tumorous counterparts (Wilcoxon signed-rank test, P = 0.02). These combined results suggest that EVI1 is a probable target for the 3q26 amplification in HCC. The copy numbers of EVI1 in primary HCC tumors tended to correlate with EVII mRNA levels, although the correlation was not statistically significant (Fig. S1).
To clarify the relationship between the elevated expression of EVI1 in HCC tumors and various clinicopathological parameters, we correlated the EVI1 expression level with available clinical data. For this purpose, tumors were divided into “high” and “low” expression groups with respect to the median mRNA level of EVI1. High EVI1 expression was significantly associated with larger tumor size and higher level of DCP, which is also known as prothrombin induced by vitamin K absence-II (PIVKA-II) and is a tumor marker for HCC (Table1). No significant correlations were apparent between the level of EVI1 mRNA and other parameters, including age, sex, hepatitis B or hepatitis C virus infection, α-fetoprotein level, and clinical stage. No relationship was observed between the levels of EVI1 mRNA and overall or disease-free survival (data not shown).
Table 1.
Relationship between clinicopathological features and levels of expression of EVI1 mRNA in 36 hepatocellular carcinomas
| Characteristic | EVI1 mRNA | P-value | |
|---|---|---|---|
| Low (<median) (n = 18) | High (>median) (n = 18) | ||
| Age, years | 66 (44–79) | 65 (35–77) | 0.98 |
| Sex | |||
| Male | 15 | 15 | 0.67 |
| Female | 3 | 3 | |
| Tumor size, cm | 4.5 (2.9–10.0) | 5.7 (2.9–26.0) | 0.03 |
| Stage | |||
| I, II, III | 13 | 12 | 0.50 |
| IV | 5 | 6 | |
| HBV infection | |||
| Positive | 5 | 4 | 0.50 |
| Negative | 13 | 14 | |
| HCV infection | |||
| Positive | 9 | 9 | 0.63 |
| Negative | 9 | 9 | |
| AFP, ng/mL | 21.4 (0.9–114 859) | 28.2 (2.4–94 560) | 0.63 |
| DCP, mAU/mL | 100 (1–17 000) | 1020 (18–111 000) | 0.04 |
χ2-test or Mann–Whitney U-test. Values are medians (range) or numbers. Where no other unit is specified, values refer to numbers of patients. AFP, α-fetoprotein; DCP, des-γ-carboxy prothrombin; HBV, hepatitis B virus; HCV, hepatitis C virus.
Suppression of TGF-β-mediated growth inhibition by EVI1 in HCC cells
The oncoprotein EVI1 is known to suppress TGF-β signaling by inhibiting Smad3 and to activate the PI3K/AKT and RAS/ERK signaling pathways. To determine whether EVI1 affects any of these signaling pathways in HCC cells, EVI1 protein expression in JHH-1 cells was knocked down using two different siRNAs (#1 and #2). EVI1 siRNA (#1) was also used to knockdown the EVII protein in a second cell line, JHH-7, that had the second highest level of EVII expression (Fig.2). Immunoblot analysis indicated successful knockdown of EVI1 in all cases (Fig.4a). Knockdown of EVI1 using EVI1 siRNA (#1) had little effect on the phosphorylated levels of AKT or ERK (data not shown), suggesting that EVI1 does not regulate the PI3K/AKT or RAS/ERK signaling pathways. To assay if EVI1 affects TGF-β signaling in HCC cells, JHH-1 cells that were transfected with EVI1 siRNA (#1) or control siRNA were treated with TGF-β for 24 h, following which the mRNA expression of PAI-1, a classic TGF-β-responsive gene, was analyzed using RT-PCR. The expression of PAI-1 mRNA was induced by TGF-β and was higher in JHH-1 cells treated with EVI1 siRNA compared to those treated with control siRNA (Fig.4b), suggesting that EVI1 attenuates TGF-β-mediated gene induction in JHH-1 cells.
Fig 4.

Effect of EVI1 knockdown on transforming growth factor-β (TGF-β)-mediated growth inhibition in JHH-1 hepatocellular carcinoma cells. (a) Immunoblot analysis of EVI1 and β-actin, an internal control, in JHH-1 and JHH-7 cells transfected with EVI1 (#1) or EVII (#2) siRNA as indicated or with control siRNAs. (b) Relative mRNA expression levels of the indicated genes in JHH-1 cells that were transfected with EVI1 (#1) or control (Cont) siRNAs and were then treated with TGF-β1 (10 ng/mL) or vehicle for 24 h. (c) Immunoblot analysis of the indicated proteins in JHH-1 and JHH-7 cells that were transfected with EVI1 siRNA (#1 or #2 as indicated) or with control siRNA and were then treated with TGF-β1 for 24 h. (d) BrdU incorporation as determined by ELISA. JHH-1 cells transfected with EVI1 siRNA (#1) or control siRNA were treated with TGF-β1 for 24 h and were then labeled with BrdU for 6 h. $P < 0.01. (e) Immunoblot analysis of EVI1 in SNU398 cells transfected with the EVI1 expression vector or an empty vector. JHH-7 cells were used as a positive control. (f, g) SNU398 cells transfected with the EVI1 expression vector were treated with TGF-β1 for 12 h then labeled with BrdU for 12 h. (f) Immunofluorescence. The cells were triple-labeled with anti-EVI1 (red), anti-BrdU (green), and DAPI (blue; nuclei). In this image, EVI1-positive cells were positive for BrdU, whereas EVI1-negative cells were negative for BrdU (arrows). (g) Percentage of BrdU-positive cells in EVI1-positive or -negative cells. More than 300 cells were counted for each group. $$P < 0.05. (h) JHH-1 cells were transfected with EVI1 siRNA (#1 or #2) or control siRNA then treated with TGF-β1. Relative cell viability (%) is shown at the indicated times after TGF-β1 treatment. $$P < 0.05.
Based on these data, we further examined the relationship between EVI1 and components of the TGF-β signaling pathway related to cell proliferation using the EVI1 knockdown and control cells. The RT-PCR analysis of siRNA-control cells indicated that TGF-β treatment induced p15INK4B mRNA and decreased c-Myc mRNA expression in JHH-1 cells (Fig.4b). Furthermore, TGF-β-treated JHH-1 cells that were transfected with EVI1 siRNA showed increased p15INK4B expression, and decreased c-Myc and cyclin D1 expression at both the mRNA and protein levels compared to TGF-β-treated control siRNA cells (Fig.4b,c). Consistent with these data, the level of phosphorylated Rb protein after TGF-β treatment was lower in JHH-1 cells treated with EVI1 siRNA compared to those treated with control siRNA (Fig.4c). To rule out siRNA off-target effects and toxicity, we then confirmed these results using siRNA (#2) in JHH-1 cells and siRNA (#1) in JHH-7 cells (Fig.4c). These data suggested that EVI1 attenuates the induction of p15INK4B by TGF-β and antagonizes TGF-β-mediated repression of c-Myc and cyclin D1, resulting in decreased Rb phosphorylation. These effects of EVI1 suggest that EVI1 might inhibit TGF-β-mediated inhibition of proliferation.
We therefore further examined the effect of EVI1 knockdown on TGF-β modulation of cell proliferation by analysis of BrdU incorporation. BrdU is known to be incorporated into the newly synthesized DNA of replicating cells during the S phase of the cell cycle. BrdU incorporation was significantly lower in TGF-β-treated JHH-1 cells treated with EVI1 siRNA (#1) compared to those treated with control siRNA (Fig.4d). To confirm this finding, we next determined if overexpression of EVII might enhance TGF-β induced BrdU incorporation. We therefore transfected the EVI1 expression vector into SNU398 cells (Fig.4e), which showed little expression of EVI1 (Fig.2), and treated them with TGF-β. Immunocytochemistry with triple staining for EVI1, BrdU, and DAPI showed that EVI1 was expressed in the nuclei of a portion of SNU398 cells transfected with the EVI1 expression vector and that the EVI1-expressing cells had a higher percentage of BrdU positive cells than cells without EVI1 expression (Fig.4f,g). We next determined the effect of knockdown of EVI1 on the viability of TGF-β-treated JHH-1 cells. Cell viability was assayed using the WST-8 assay after TGF-β treatment of JHH-1 cells that were transfected with EVI1 siRNAs (#1 or #2) or control siRNA. Cell viability of all cells decreased in a time-dependent manner, because the cells were treated with TGF-β in serum-free medium. However, the rate of decrease in cell viability was significantly faster in cells transfected with EVI1 siRNAs (#1 or #2) than in those transfected with control siRNA (Fig.4h). These findings further suggested that EVI1 antagonizes TGF-β-mediated growth inhibition. However, EVI1 knockdown did not inhibit the growth of JHH-1 cells under normal culture conditions in the absence of TGF-β (data not shown).
Regarding other TGF-β functions, EVI1 knockdown had little effect on TGF-β-mediated induction of integrin α1, which is one of the earliest manifestations of EMT (data not shown). Moreover, TGF-β treatment did not induce apoptosis in either the control or the EVI1 siRNA transfected JHH-1 cells as assessed by cleavage of poly (ADP-ribose) polymerase, suggesting that EVI1 may not affect TGF-β-mediated induction of apoptosis (data not shown).
Discussion
We identified a novel amplification at 3q26 in the HCC cell line JHH-1, and found that EVI1, which lies within the 3q26 region, is amplified in these cells. A copy number gain of EVI1 was frequently observed in both a number of HCC cell lines and in primary HCCs. Subsequent experiments suggested that EVI1, but not MDS1–EVI1 or MDS1, is the most likely target for the amplicon, as only the EVI1 transcript was overexpressed in JHH-1 cells and was significantly upregulated in primary HCC tumors when compared with non-tumorous counterparts. Moreover, we showed that EVI1 antagonizes TGF-β-mediated growth inhibition in JHH-1 cells through attenuation of p15INK4B induction.
Increased DNA copy number involving 3q26 is frequently found in a number of epithelial cancers, suggesting that the 3q26 region harbors one or more target genes, the amplification of which renders them oncogenic. Potential target genes in the 3q26 amplicon have been identified in epithelial cancers, including PIK3CA,17 PKCiota,18 and EVI17 in ovarian cancer, SOX2 in squamous cell lung cancer19 and small-cell lung cancer,20 and FNDC3B21 in HCC. We previously identified TERC22 and SOX223 as the targets for the 3q26 amplification in non-small-cell lung cancer and esophageal squamous cell carcinoma, respectively. Amplification of EVI1 has been found in primary ovarian cancers,7,8 colon cancer cell lines,9 and non-small-cell lung cancer cell lines.22 However, to our knowledge, this is the first report to describe the amplification and overexpression of EVI1 in HCC.
Expression experiments in the present study showed that EVI1 and MDS1–EVI1 mRNAs were detectable in non-tumor liver tissues in approximately half of cases, whereas MDS1 was rarely detected. It is known that EVI1 is highly expressed in adult hematopoietic stem cells.24,25 Although EVI1 is also expressed in the hematopoietic stem/progenitor fraction in the fetal liver of mouse embryos,26 the physiological function of EVI1and MDS1–EVI1 in the adult liver is unknown. The function of MDS1 also remains unknown.
Our results showed that high EVI1 expression was significantly associated with larger tumor size and higher level of DCP, a diagnostic and surveillance marker for HCC. It has been shown that DCP is a predictor of microvascular invasion, which is a major risk factor for tumor recurrence and mortality in HCC.27 These observations supported the notion that upregulation of EVI1 might be involved in the progression of HCC. Unlike in myeloid leukemia, no relationship was observed between the levels of EVI1 mRNA and survival in our HCC patients. However, our sample size was too small to draw a definite conclusion. Further studies with more numerous primary samples are needed to determine the clinical importance of EVI1 in HCC.
Although the role of EVI1 in tumorigenesis has not been fully elucidated, it is suggested that EVI1 possesses diverse functions as an oncoprotein and affects cell proliferation and apoptosis in a cell-type specific manner. EVI1 can prevent apoptosis by negatively regulating the c-Jun N-terminal kinase pathway28 or by activating the PIK3/AKT pathway.9 Moreover, it can stimulate cell growth by activating the PIK3/AKT pathway10 or the RAS/ERK pathway.11 Our results showed that knockdown of EVI1 resulted in increased induction of p15INK4B by TGF-β and decreased expression of c-Myc, cyclin D1, and phosphorylated Rb. Consequently, knockdown of EVI1 led to reduced BrdU incorporation and reduced cell viability, implying reduced cell proliferation. These findings suggested that EVI1 antagonizes TGF-β-mediated growth inhibition in HCC cells and are consistent with a previous report that EVI1 suppresses TGF-β-mediated growth inhibition.12 Therefore, EVI1 may be involved in hepatocarcinogenesis, in part, through suppression of the TGF-β signaling pathway. To determine if EVI1 expression might be associated with alterations in genes of the TGF-β signaling pathway in the HCC cell lines that we used, we searched the Catalogue Of Somatic Mutations In Cancer database (http://cancer.sanger.ac.uk/cancergenome/projects/cosmic/) for mutations in such genes. This search indicated that the TGF-β receptor 1 gene (TGFBR1) is mutated in JHH-1 cells, but not in JHH-7 or SNU398 cells. However, in our study, the fact that the expression of PAI-1 mRNA was strongly induced by TGF-β in JHH-1 cells suggested that TGF-β signaling was active in JHH-1 cells. No mutation in the TGF-β receptor 2 gene (TGFBR2) or in the Smad4 gene (SMAD4) is found in these three cell lines. Although other signaling pathways may be involved in the oncogenic role of EVI1 in HCC, we could not find evidence of the involvement of EVI1 with any pathway other than the TGF-β pathway, at least, under the conditions of our experiments. Further studies are needed to determine the functional role of EVI1 in HCC and the exact mechanism by which EVI1 antagonizes TGF-β-mediated growth inhibition in HCC cells.
Transforming growth factor-β signaling has been shown to act as a tumor suppressor or a promoter in HCC in a context-dependent manner.29,30 Transforming growth factor-β inhibits the growth of hepatocytes, acting as a tumor suppressor. Because only a fraction of HCCs show inactivating mutations in components of the TGF-β signaling pathway, other mechanisms for perturbing TGF-β signaling appear critical for the development of HCC. However, TGF-β signaling promotes HCC progression and EMT by acting as an autocrine or paracrine growth factor and by inducing microenvironmental changes, including changes in the numbers of cancer-associated fibroblasts and T regulatory cells, and in the levels of inflammatory mediators. The switch of TGF-β function from tumor suppression to promotion is not well understood. Most HCC arises on a background of cirrhosis, which is characterized by the accumulation of ECM proteins. The deposition of ECM is largely stimulated by TGF-β. This tight interaction between the tumor and the surrounding cirrhotic liver is one of the most remarkable hallmarks of HCC.
In conclusion, we have identified EVI1 as a novel target for the amplification event at 3q26 in HCC. Our results suggest that EVI1 antagonizes TGF-β-mediated growth inhibition in HCC cells and could therefore represent a potential molecular target for the development of novel therapies to treat HCC.
Acknowledgments
This study was supported by a Grant-in-Aid for Scientific Research (No. 20590408) (to K Yasui) from the Japan Society for the Program of Science.
Glossary
- AKT
protein kinase B
- AML
acute myeloid leukemia
- BAC
bacterial artificial chromosome
- CDK
cyclin-dependent kinase
- DCP
des-γ-carboxy prothrombin
- EMT
epithelial–mesenchymal transition
- EVI1
ecotropic viral integration site 1
- HCC
hepatocellular carcinoma
- MDS1
myelodysplastic syndrome 1
- MECOM
MDS1 and EVI1 complex locus
- phospho-Rb
phosphorylated Rb
- PI3K
phosphatidylinositol 3-kinase
- SNP
single nucleotide polymorphism
- TGF-β
transforming growth factor-β
Disclosure Statement
The authors have no conflict of interest.
Supporting Information
Additional supporting information may be found in the online version of this article:
Fig. S1. Correlation between copy numbers and relative mRNA expression levels of EVI1.
Table S1. Primers and probes used for PCR.
References
- Ferlay J, Shin HR, Bray F, Forman D, Mathers C, Parkin DM. Estimates of worldwide burden of cancer in 2008: GLOBOCAN 2008. Int J Cancer. 2010;127:2893–917. doi: 10.1002/ijc.25516. [DOI] [PubMed] [Google Scholar]
- Collins C, Rommens JM, Kowbel D, et al. Positional cloning of ZNF217 and NABC1: genes amplified at 20q13.2 and overexpressed in breast carcinoma. Proc Natl Acad Sci U S A. 1998;95:8703–8. doi: 10.1073/pnas.95.15.8703. [DOI] [PMC free article] [PubMed] [Google Scholar]
- Goyama S, Kurokawa M. Evi-1 as a critical regulator of leukemic cells. Int J Hematol. 2010;91:753–7. doi: 10.1007/s12185-010-0618-5. [DOI] [PubMed] [Google Scholar]
- Morishita K, Parker DS, Mucenski ML, Jenkins NA, Copeland NG, Ihle JN. Retroviral activation of a novel gene encoding a zinc finger protein in IL-3-dependent myeloid leukemia cell lines. Cell. 1988;54:831–40. doi: 10.1016/s0092-8674(88)91175-0. [DOI] [PubMed] [Google Scholar]
- Barjesteh van Waalwijk van Doorn-Khosrovani S, Erpelinck C, van Putten WL, et al. High EVI1 expression predicts poor survival in acute myeloid leukemia: a study of 319 de novo AML patients. Blood. 2003;101:837–45. doi: 10.1182/blood-2002-05-1459. [DOI] [PubMed] [Google Scholar]
- Brooks DJ, Woodward S, Thompson FH, et al. Expression of the zinc finger gene EVI-1 in ovarian and other cancers. Br J Cancer. 1996;74:1518–25. doi: 10.1038/bjc.1996.583. [DOI] [PMC free article] [PubMed] [Google Scholar]
- Nanjundan M, Nakayama Y, Cheng KW, et al. Amplification of MDS1/EVI1 and EVI1, located in the 3q26.2 amplicon, is associated with favorable patient prognosis in ovarian cancer. Cancer Res. 2007;67:3074–84. doi: 10.1158/0008-5472.CAN-06-2366. [DOI] [PubMed] [Google Scholar]
- Sunde JS, Donninger H, Wu K, et al. Expression profiling identifies altered expression of genes that contribute to the inhibition of transforming growth factor-beta signaling in ovarian cancer. Cancer Res. 2006;66:8404–12. doi: 10.1158/0008-5472.CAN-06-0683. [DOI] [PubMed] [Google Scholar]
- Liu Y, Chen L, Ko TC, Fields AP, Thompson EA. Evi1 is a survival factor which conveys resistance to both TGFbeta- and taxol-mediated cell death via PI3K/AKT. Oncogene. 2006;25:3565–75. doi: 10.1038/sj.onc.1209403. [DOI] [PubMed] [Google Scholar]
- Yoshimi A, Goyama S, Watanabe-Okochi N, et al. Evi1 represses PTEN expression and activates PI3K/AKT/mTOR via interactions with polycomb proteins. Blood. 2011;117:3617–28. doi: 10.1182/blood-2009-12-261602. [DOI] [PubMed] [Google Scholar]
- Tanaka M, Suzuki HI, Shibahara J, et al. EVI1 oncogene promotes KRAS pathway through suppression of microRNA-96 in pancreatic carcinogenesis. Oncogene. 2014;33:2454–63. doi: 10.1038/onc.2013.204. [DOI] [PubMed] [Google Scholar]
- Kurokawa M, Mitani K, Irie K, et al. The oncoprotein Evi-1 represses TGF-beta signalling by inhibiting Smad3. Nature. 1998;394:92–6. doi: 10.1038/27945. [DOI] [PubMed] [Google Scholar]
- Weinberg Robert A. The Biology of Cancer. 2nd edn. New York: Garland Science; 2014. [Google Scholar]
- Zen K, Yasui K, Nakajima T, et al. ERK5 is a target for gene amplification at 17p11 and promotes cell growth in hepatocellular carcinoma by regulating mitotic entry. Genes Chromosom Cancer. 2009;48:109–20. doi: 10.1002/gcc.20624. [DOI] [PubMed] [Google Scholar]
- Endo M, Yasui K, Zen Y, et al. Alterations of the SWI/SNF chromatin remodelling subunit-BRG1 and BRM in hepatocellular carcinoma. Liver Int. 2013;33:105–17. doi: 10.1111/liv.12005. [DOI] [PubMed] [Google Scholar]
- Fears S, Mathieu C, Zeleznik-Le N, Huang S, Rowley JD, Nucifora G. Intergenic splicing of MDS1 and EVI1 occurs in normal tissues as well as in myeloid leukemia and produces a new member of the PR domain family. Proc Natl Acad Sci U S A. 1996;93:1642–7. doi: 10.1073/pnas.93.4.1642. [DOI] [PMC free article] [PubMed] [Google Scholar]
- Shayesteh L, Lu Y, Kuo WL, et al. PIK3CA is implicated as an oncogene in ovarian cancer. Nat Genet. 1999;21:99–102. doi: 10.1038/5042. [DOI] [PubMed] [Google Scholar]
- Eder AM, Sui X, Rosen DG, et al. Atypical PKCiota contributes to poor prognosis through loss of apical-basal polarity and cyclin E overexpression in ovarian cancer. Proc Natl Acad Sci U S A. 2005;102:12519–24. doi: 10.1073/pnas.0505641102. [DOI] [PMC free article] [PubMed] [Google Scholar]
- Bass AJ, Watanabe H, Mermel CH, et al. SOX2 is an amplified lineage-survival oncogene in lung and esophageal squamous cell carcinomas. Nat Genet. 2009;41:1238–42. doi: 10.1038/ng.465. [DOI] [PMC free article] [PubMed] [Google Scholar]
- Rudin CM, Durinck S, Stawiski EW, et al. Comprehensive genomic analysis identifies SOX2 as a frequently amplified gene in small-cell lung cancer. Nat Genet. 2012;44:1111–6. doi: 10.1038/ng.2405. [DOI] [PMC free article] [PubMed] [Google Scholar]
- Chen CF, Hsu EC, Lin KT, et al. Overlapping high-resolution copy number alterations in cancer genomes identified putative cancer genes in hepatocellular carcinoma. Hepatology. 2010;52:1690–701. doi: 10.1002/hep.23847. [DOI] [PubMed] [Google Scholar]
- Yokoi S, Yasui K, Iizasa T, Imoto I, Fujisawa T, Inazawa J. TERC identified as a probable target within the 3q26 amplicon that is detected frequently in non-small cell lung cancers. Clin Cancer Res. 2003;9:4705–13. [PubMed] [Google Scholar]
- Gen Y, Yasui K, Zen Y, et al. SOX2 identified as a target gene for the amplification at 3q26 that is frequently detected in esophageal squamous cell carcinoma. Cancer Genet Cytogenet. 2010;202:82–93. doi: 10.1016/j.cancergencyto.2010.01.023. [DOI] [PubMed] [Google Scholar]
- Chen W, Kumar AR, Hudson WA, et al. Malignant transformation initiated by Mll-AF9: gene dosage and critical target cells. Cancer Cell. 2008;13:432–40. doi: 10.1016/j.ccr.2008.03.005. [DOI] [PMC free article] [PubMed] [Google Scholar]
- Goyama S, Yamamoto G, Shimabe M, et al. Evi-1 is a critical regulator for hematopoietic stem cells and transformed leukemic cells. Cell Stem Cell. 2008;3:207–20. doi: 10.1016/j.stem.2008.06.002. [DOI] [PubMed] [Google Scholar]
- Kataoka K, Sato T, Yoshimi A, et al. Evi1 is essential for hematopoietic stem cell self-renewal, and its expression marks hematopoietic cells with long-term multilineage repopulating activity. J Exp Med. 2011;208:2403–16. doi: 10.1084/jem.20110447. [DOI] [PMC free article] [PubMed] [Google Scholar]
- Shirabe K, Itoh S, Yoshizumi T, et al. The predictors of microvascular invasion in candidates for liver transplantation with hepatocellular carcinoma-with special reference to the serum levels of des-gamma-carboxy prothrombin. J Surg Oncol. 2007;95:235–40. doi: 10.1002/jso.20655. [DOI] [PubMed] [Google Scholar]
- Kurokawa M, Mitani K, Yamagata T, et al. The evi-1 oncoprotein inhibits c-Jun N-terminal kinase and prevents stress-induced cell death. EMBO J. 2000;19:2958–68. doi: 10.1093/emboj/19.12.2958. [DOI] [PMC free article] [PubMed] [Google Scholar]
- Matsuzaki K, Seki T, Okazaki K. TGF-β signal shifting between tumor suppression and fibro-carcinogenesis in human chronic liver diseases. J Gastroenterol. 2014;49:971–81. doi: 10.1007/s00535-013-0910-2. [DOI] [PubMed] [Google Scholar]
- Giannelli G1, Villa E, Lahn M. Transforming growth factor-β as a therapeutic target in hepatocellular carcinoma. Cancer Res. 2014;74:1890–4. doi: 10.1158/0008-5472.CAN-14-0243. [DOI] [PubMed] [Google Scholar]
Associated Data
This section collects any data citations, data availability statements, or supplementary materials included in this article.
Supplementary Materials
Fig. S1. Correlation between copy numbers and relative mRNA expression levels of EVI1.
Table S1. Primers and probes used for PCR.