Abstract
♦ Introduction:
Encapsulating peritoneal sclerosis (EPS) is a serious complication of peritoneal dialysis in which gastrointestinal (GI) symptoms reduce appetite and dietary intake. Adequate nutrition is important, especially if surgery is required. Although the incidence of EPS is low, the present report is able to detail preoperative nutrition status and treatment in a large cohort of patients from a national EPS referral center.
♦ Methods:
Of 51 patients admitted to this EPS specialist center hospital for their first peritonectomy in the study period, 50 had a preoperative dietetic assessment, and 49 underwent upper-arm anthropometry.
♦ Results:
Mean body mass index (BMI) was 20.6 kg/m2. Mean weight loss was 14% of body weight in the preceding 6 months, with 35 of 50 patients losing more than 10%. On anthropometry, 25 of 49 patients were below the 5th percentile for mid-arm circumference (MAC), 17 of 49 were below for triceps skinfold thickness (TSF), and 21 of 49 were below for mid-arm muscle circumference (MAMC). Mean handgrip strength (HGS) was 60% of normal, with 43 of 49 patients being below 85% of normal. Appetite was poor in 21 of 50 patients, and 37 of 50 had upper and 40 of 50 had lower GI symptoms. By subjective global assessment, 27 of 51 patients were graded as severely malnourished, and 5 of 51, as well-nourished. Mean serum albumin was 28 g/L and did not correlate with BMI, MAC, TSF, MAMC, or HGS. In most patients, C-reactive protein was elevated (mean: 111 mg/L). Preoperative parenteral nutrition was given to 46 of 51 patients for a mean of 21 days.
♦ Discussion:
Our findings demonstrate the poor nutrition status of patients admitted for EPS surgical intervention. Anthropometrics reveal depleted fat and lean body mass in EPS patients, which might be a result of anorexia and inflammation, and the reason that albumin was not an accurate marker of nutrition. Poor nutrition status is likely to negatively affect outcome in this patient group.
♦ Conclusions:
Early recognition of GI symptoms may herald a diagnosis of EPS. Optimization of preoperative nutrition status with intensive nutrition support is needed.
Keywords: Anthropometry, encapsulating peritoneal sclerosis, EPS, nutrition, wasting
Encapsulating peritoneal sclerosis (EPS) is an uncommon but serious complication of peritoneal dialysis (PD), characterized by sclerotic thickening of the peritoneal membrane leading to bowel obstruction (1–4). Patients develop gastrointestinal (GI) symptoms with reduced appetite and weight loss (5).
Encapsulating peritoneal sclerosis is a complex condition requiring integrated care from the renal multi-disciplinary team, including dietitians (6). Once bowel obstruction is diagnosed, surgical intervention is necessary (7). The unit at Manchester is a specialist center in EPS surgery. The surgical procedure is often lengthy, involving peritonectomy and enterolysis to release the bowel. Bowel resection or a stoma can be required. Patients often have long hospital admissions, involving intensive care and repeated surgical interventions.
Adequate nutrition is important, especially if surgery is required (5,6). Malnutrition can lead to impaired wound healing, wound dehiscence, pressure ulcers, and pneumonia (8); patients therefore have to be well nourished to allow for optimal healing and to help avoid infection. Malnutrition also increases the hospital stay and costs (9). Risk of refeeding syndrome in this patient group is high because of initiation of preoperative feeding combined with their malnourished state (5,10).
In many EPS patients, ascites and edema mean that weight alone is an insufficient marker of nutrition status (6). Body composition can also be altered in renal patients, making body mass index (BMI) a less reliable marker of nutrition. Additional anthropometric measures are therefore required to make an accurate assessment of nutrition status in EPS patients. Measuring body composition offers a qualitative aspect. Upper-arm anthropometry—mid-arm circumference (MAC), triceps skinfold thickness (TSF), and mid-arm muscle circumference (MAMC)—provides an objective measurement of fat and muscle stores. Measurement of muscle function using handgrip strength (HGS) provides a dynamic indicator of muscle mass and functional ability.
Lean body mass (LBM) is largely skeletal muscle, and it is essential to maintain normal metabolism, organ function, immune function, and healing. Muscle and fat mass can both deplete in chronic illness (such as chronic kidney disease) in which low-grade inflammation is constantly present. Inflammation suppresses appetite, causing muscle proteolysis (11); reduces the effective use of protein and energy intake; and augments catabolism (12). In patients with EPS, weight loss and elevated C-reactive protein (CRP) cause protein-preserving mechanisms to be inhibited (8) and, with severe GI symptoms, culminate in accelerated loss of LBM and muscle function. As a surrogate marker of muscle strength, HGS declines as part of disease-related malnutrition and is significantly lower in malnourished than in well-nourished individuals (13).
Subjective global assessment (SGA) is a series of bedside measures of nutrition status that are assessed by clinical examination to categorize patients into groups from well-nourished to severely malnourished (14–17).
Albumin is a poor indicator of nutrition status because of the presence of inflammation in EPS patients; however, it can give an indication of disease severity and prognosis (18,19), signaling which patients requiring closer nutrition monitoring or more intensive nutrition therapies.
The aim of the present study was to determine the preoperative nutrition status of EPS patients by reporting anthropometrics, GI symptoms, and SGA scores in patients referred to our center for surgical intervention.
Methods
Encapsulating peritoneal sclerosis was recognized by GI symptoms and diagnostically confirmed by laparotomy or computed tomography imaging at base hospitals before patients were referred to our EPS center for surgical assessment. If appropriate for surgery, patients ideally had a planned admission; however, some patients were admitted as emergency cases, and therefore time from EPS diagnosis to surgery varied widely and was unable to be reported for the present study. Patients who underwent primary surgical intervention (peritonectomy) between October 2007 and December 2010 at our EPS specialist hospital underwent a full preoperative dietetic assessment and received nutrition support as part of their standard care. Medical and demographic details of the 51 patients admitted during that period were prospectively recorded within their dietetic assessment. Secondary analysis of data collected within the course of normal patient care was performed at a later time as a service evaluation. No data were missing. Data were anonymized and entered into a spreadsheet. Analysis was performed on the cohort data with no individually identifiable patient factors.
Patients receive a preoperative dietetic assessment so that any nutritional deficiencies are recognized and treated. An assessment was able to be completed for 50 of the 51 patients (1 was admitted straight to intensive care). Weight was measured to the nearest 0.1 kg on ward scales, and edema and ascites were estimated in consultation with the patient under dietetic guidance (20). Edema- and ascites-free weight was recorded and used for calculations of nutrition. Height was recorded from patient recall and used to calculate BMI. Patients recalled their weight from 3–6 months earlier, which was used to calculate a percentage weight loss.
Upper-arm anthropometry was performed in 49 of the 51 patients, 48 of whom were assessed by the same practitioner, using techniques taught by the Parenteral and Enteral Group of the British Dietetic Association (21). Where possible, the nondominant arm was used. If there was a functioning fistula on the nondominant arm, the dominant arm was used. A tape measure was used to measure MAC at the midpoint of the ulnar length. Harpenden calipers (Baty International, Burgess Hill, UK) were used to measure TSF (fat mass), and the mean of 3 measures was recorded. From the MAC and TSF readings, MAMC (muscle mass) was calculated using a set formula (21). A handgrip dynameter (British Indicators, Luton, UK) was used to measure HGS (functional assessment), and the best of three measures was recorded. Anthropometric results were compared with published norms for a sex- and age-matched healthy population (22–24).
A checklist of the presence and severity of GI symptoms was completed, together with a history of current and recent dietary intake and prescribed nutrition support. The overall nutrition information was summarized in the 3-point SGA nutrition assessment tool using the protocol developed by Detsky and colleagues (17). Biochemical blood tests measuring electrolytes, bone profile, liver profile, triglycerides, bicarbonate, CRP, albumin, hemoglobin, white cell count, glucose, and zinc were reviewed. Serum CRP and albumin determined on the morning of surgery are reported. The refeeding risk was reviewed, and relevant recommendations were made. The dietitian calculated energy, protein, fluid, and electrolyte requirements and advised on appropriate pre- and postoperative nutrition support.
Column statistics were used for all variables. The Pearson test was used to analyze correlations between the various indices of nutrition; the Student t-test was used to look for statistical differences between weight-loss groups; and analysis of variance was used to test for statistical differences between the SGA groups. Figures were rounded to the nearest decimal, where appropriate.
Results
Table 1 shows patient demographics. In all patients, PD was stopped before EPS surgery, and so no active peritonitis was present at the time of surgery, although some patients had experienced many episodes in their history. Notably, 18 of 50 patients (36%) had been on PD for 5 years or more.
TABLE 1.
Patient Demographics
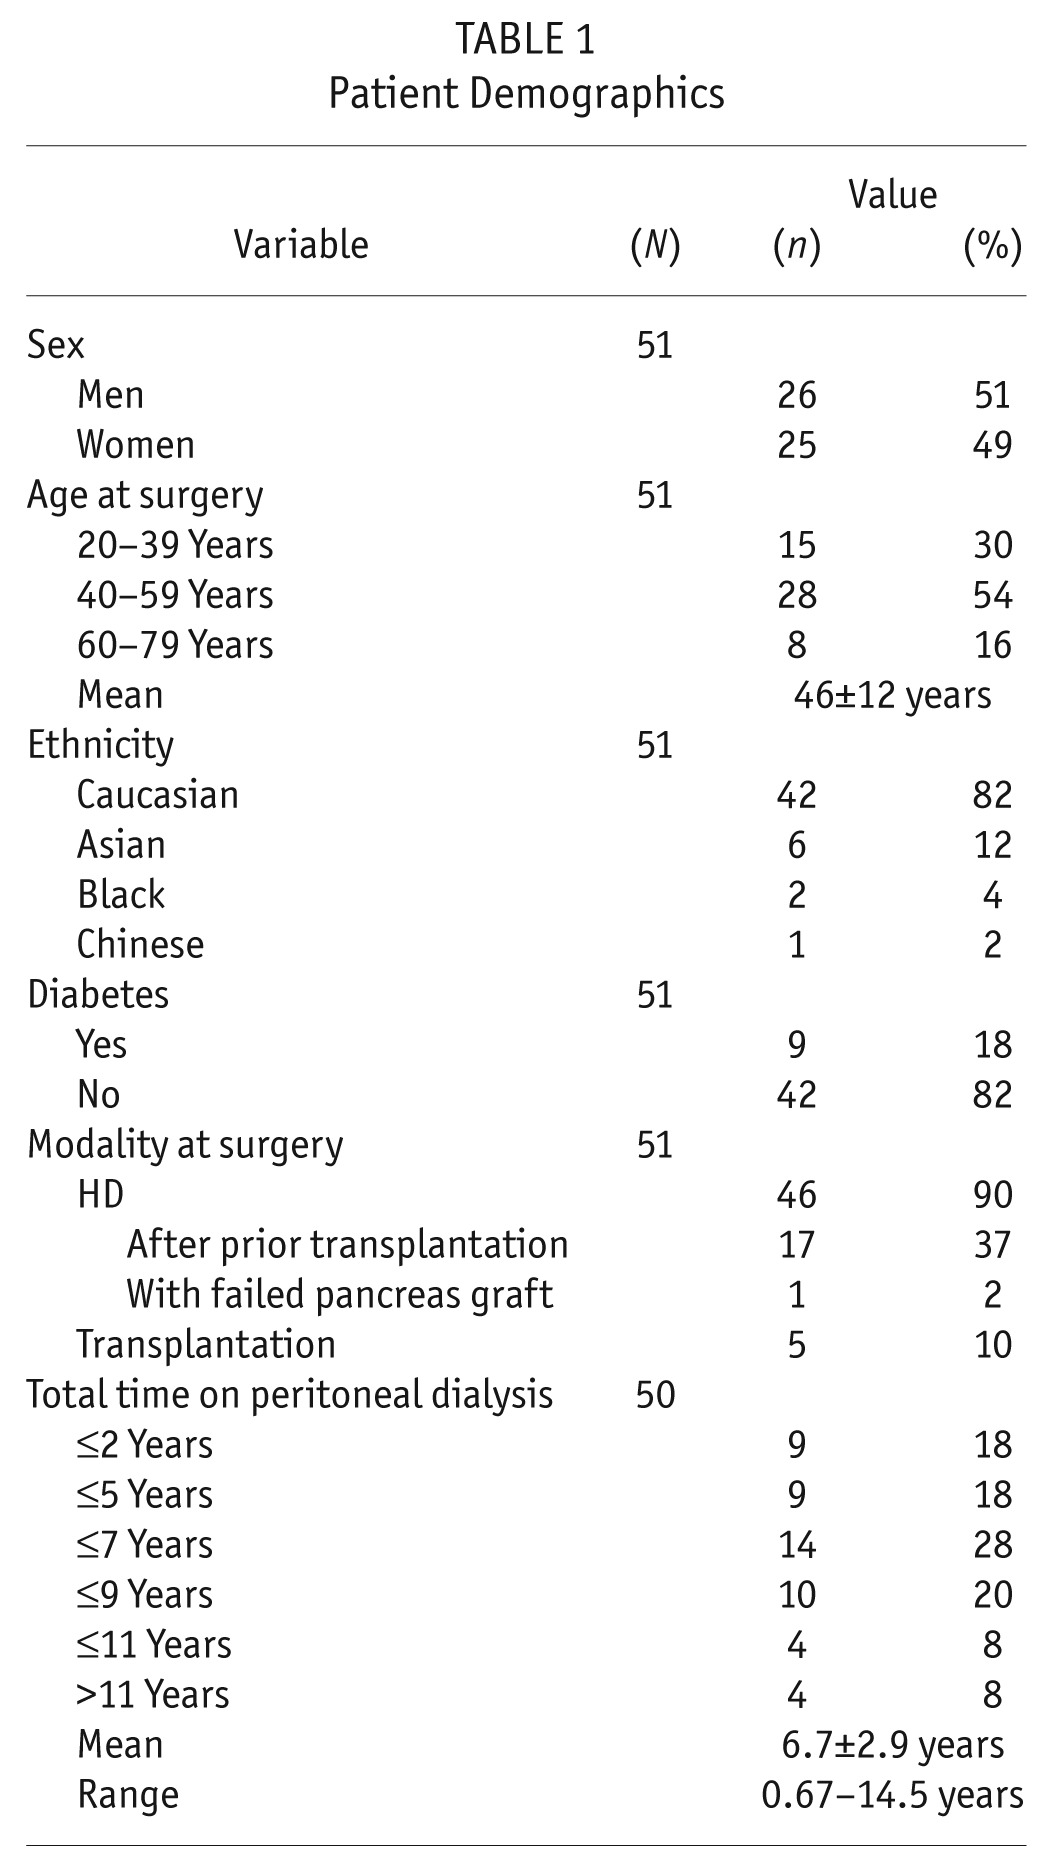
Table 2 shows measures of nutrition at the time of EPS surgery. Preoperative weight loss in the preceding 6 months was recorded in 47 of 50 patients, with 35 patients (70%) having lost more than 10% of their body weight in the preceding 3 – 6 months, which is an indicator of malnutrition. Only 3 patients were not below their usual body weight (from 6 months before admission). Upper-arm anthropometry showed depleted fat and muscle stores, demonstrating a picture of wasting malnutrition. Preoperative serum albumin was low, and CRP was elevated in most patients.
TABLE 2.
Measures of Nutrition at the Time of Surgery for Encapsulating Peritoneal Sclerosis
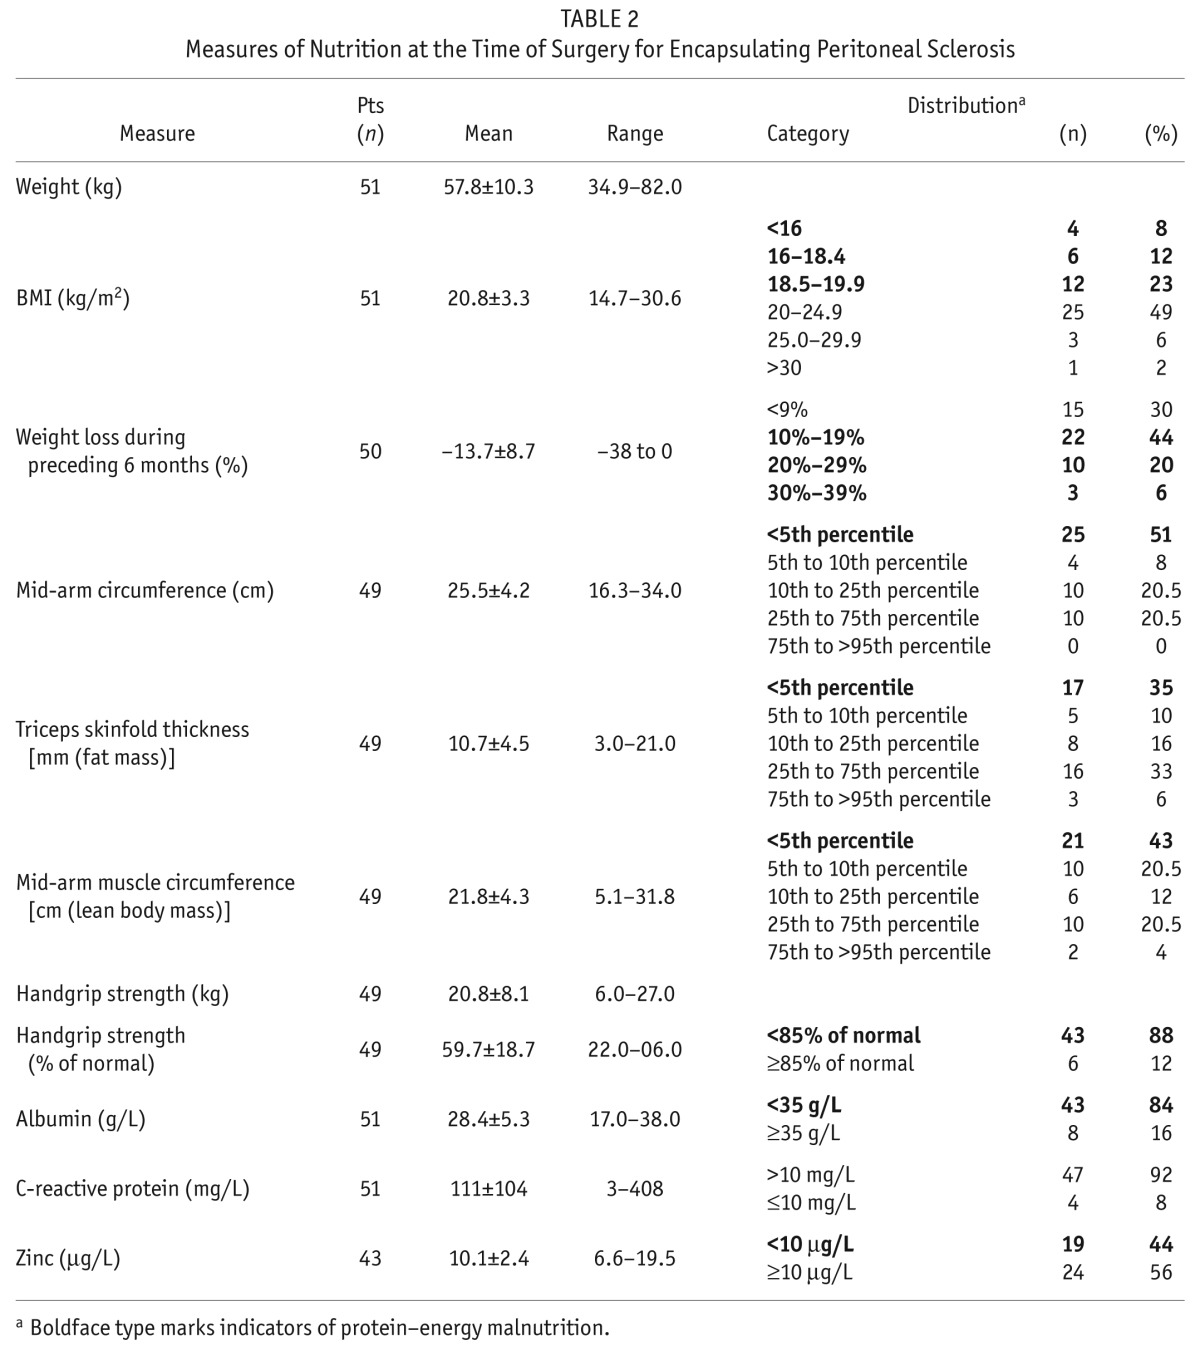
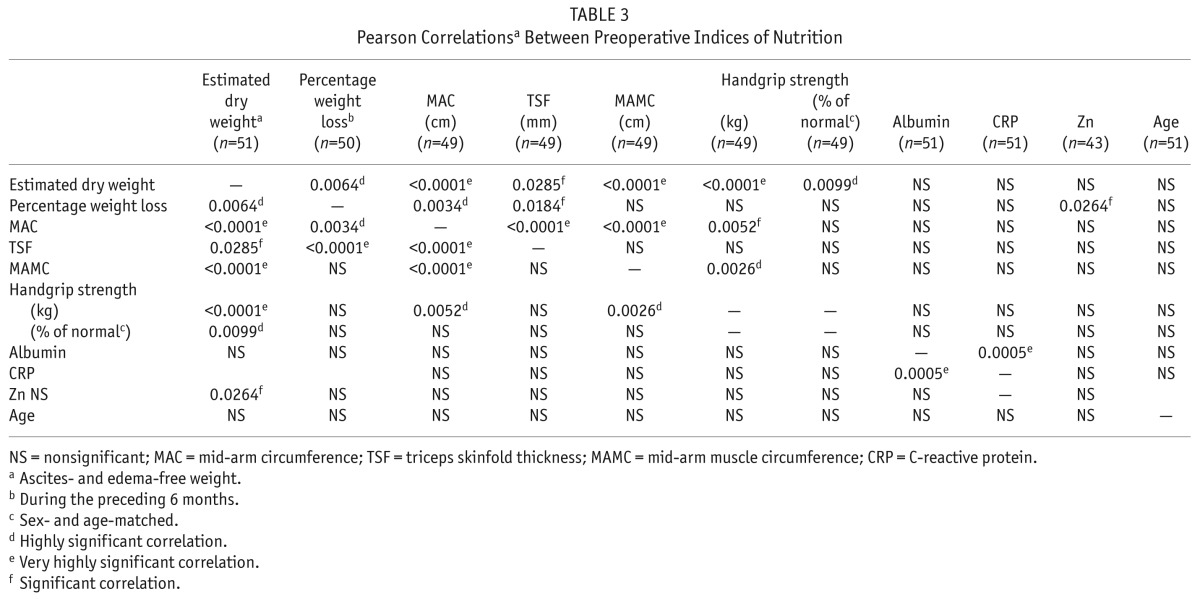
Table 3 shows correlations between the indices of nutrition. The MAC and TSF measurements correlated with percentage weight loss. None of the nutrition measures correlated significantly with albumin or age. Highly significant correlations were observed between BMI and MAC (p < 0.0001, r = 0.7897), TSF (p = 0.0004, r = 0.4883), MAMC (p = 0.0001, r = 0.5156), HGS expressed in kilograms (p = 0.0098, r = 0.3654), and percentage weight loss (p = 0.0006, r = 0.4693), but not with albumin, CRP, zinc, age, or HGS expressed as percentage of normal. Parameters of nutrition were compared in patients who had lost more than 10% or lost 0% – 10% of body weight, and no significant differences were found between the groups.
TABLE 3.
Pearson Correlationsa Between Preoperative Indices of Nutrition
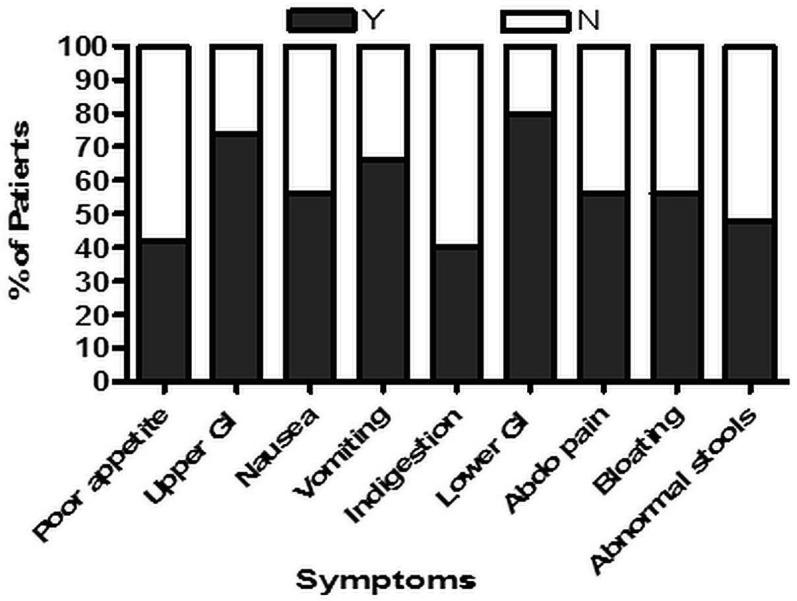
Details of preoperative symptoms were collected in 50 of 51 patients. Of upper GI symptoms (nausea, vomiting, indigestion), 4 patients (8%) had 1 symptom, 20 (40%) had 2 symptoms, and 13 (26%) had 3 symptoms. Of lower GI symptoms (abdominal pain, bloating, abnormal bowel function), 15 patients (30%) had 1 symptom, 13 (26%) had 2 symptoms, and 12 patients (24%) had 3 symptoms. Figure 1 shows the proportion of patients with each type of GI symptom.
Figure 1 —
Proportion of patients (n = 50) with each gastrointestinal (GI) symptom: poor appetite (n = 21), upper GI symptoms (n = 37), nausea (n = 28), vomiting (n = 33), indigestion (n = 20), lower GI symptoms (n = 40), abdominal pain (n = 28), bloating (n = 28), stool abnormalities (n = 24).
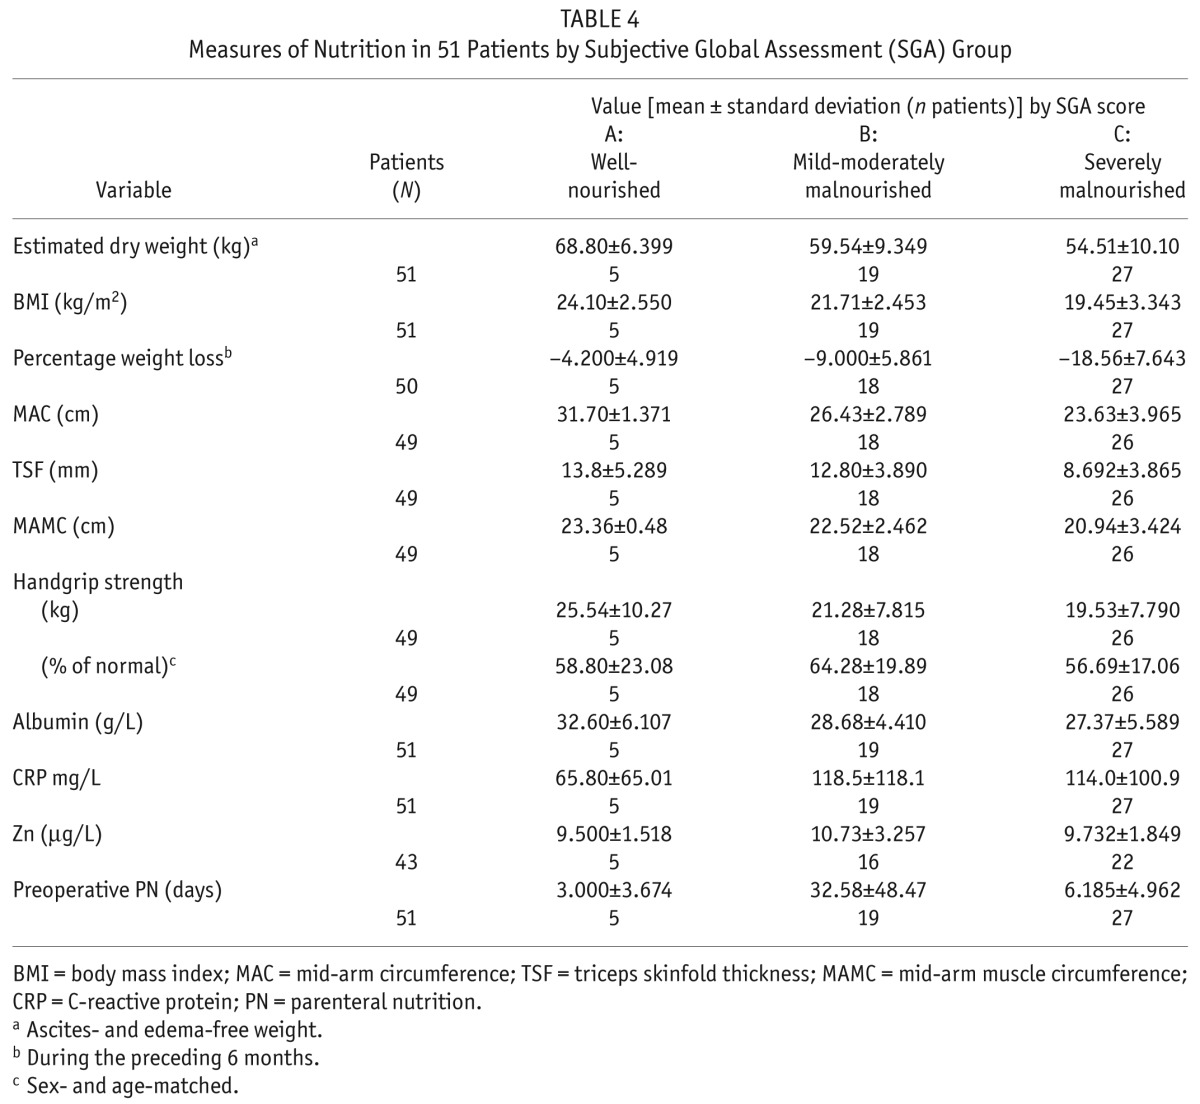
Scores on the SGA showed that, at time of surgery, 27 patients (53%) were grade C (severely malnourished), 19 (37%) were grade B (mildly-to-moderately malnourished), and 5 (10%) were grade A (well-nourished). Table 4 shows details of the nutrition measurements for each SGA group. We observed no significant differences between the SGA groups in serum albumin, CRP, or zinc. The SGA groups also showed no significant differences in their time on PD, number of preoperative days of parenteral nutrition (PN), or total length of hospital stay.
TABLE 4.
Measures of Nutrition in 51 Patients by Subjective Global Assessment (SGA) Group
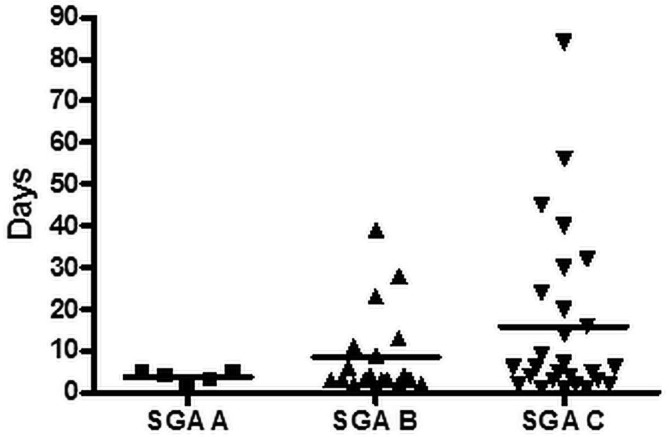
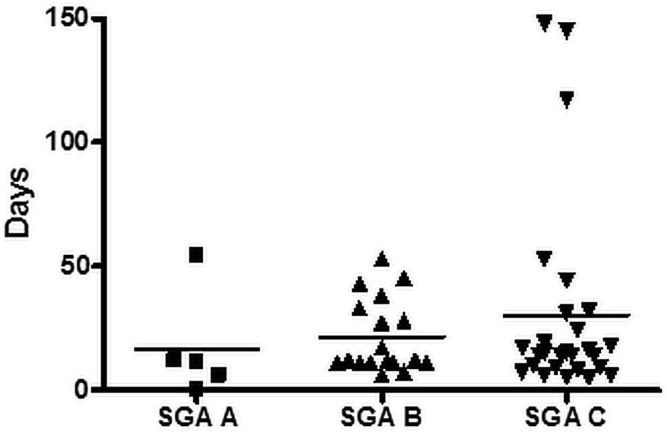
Correlations between SGA group and selected postoperative variables were preliminarily analyzed. We observed no significant differences between the groups with respect to total length of stay or duration of enteral nutrition. As Figures 2 and 3 show, there were nonsignificant trends toward a longer postoperative critical care stay and a longer postoperative time on PN in patients with a lower SGA score. We observed no significant difference in SGA score for patients who died and those who did not.
Figure 2 —
Postoperative critical care by subjective global assessment (SGA) group. Mean postoperative critical care stay in the SGA A group (n = 5) was 3.6 days (range: 1 – 5 days); in the SGA B group (n = 19), it was 8.5 days (range: 1 – 39 days); and in the SGA C group (n = 27), it was 15.9 days (range: 1 – 84 days).
Figure 3 —
Postoperative parenteral nutrition (PN) days at our center, by SGA group. Mean postoperative PN days in the SGA A group (n = 5) were 16.6 (range: 0 – 54 days); in the SGA B group (n = 19), they were 21.6 (range: 6 – 53 days); and in the SGA C group (n = 270), they were 30.2 (range: 5 – 148 days).
Before surgery, 46 of 51 patients received PN for a mean of 21.1 ± 34.5 days (range: 0 – 180 days). Preoperative PN was not given in 3 patients because of reluctance for line insertion or a stay in hospital, failed line placement, recovery from GI symptoms, and meeting anabolic or maintaining weight gain requirements with oral or enteral nutrition. Mean preoperative length of stay was 10.5 ± 10.9 days (range: 1 – 56 days).
Postoperatively, the PN course was 25 ± 32 days (range: 0 – 148 days), with a mean duration of enteral nutrition of 9 ± 18 days (range: 0 – 99 days). Mean time in critical care was 12 ± 13 days (range: 1 – 152 days), with a mean total postoperative hospital stay of 37 ± 25 days (range: 9 – 152 days). The number of EPS deaths in this cohort was 18 (35%).
Discussion
Our study describes in detail the nutrition status of patients undergoing surgery for EPS. This group of EPS patients might represent severe cases of EPS, given that they had been assessed as requiring surgical intervention. Other EPS patient groups on medical or conservative management could vary from the present results, depending on their nutritional intake.
This study is the first to report full nutrition status, including BMI calculated from ascites- and edema-free weight, upper-arm anthropometry, and SGA in a cohort of EPS patients referred for surgery. Malnutrition in other surgical groups has been shown to result in significantly longer hospital stays, increased morbidity and mortality, impaired wound healing, increased infections and complications, and higher treatment costs (25). It is therefore useful to investigate and report the presence of malnutrition in this patient group.
The incidence of EPS increases with time on PD (1); however, in this cohort, more than one third of the patients had been on PD for 5 years or more, and half had been on PD for 2 years or less, which is considered a short time for EPS development. Patients were in no way selected; all consecutive patients were included, and so selection bias is unlikely to be the reason for those findings. Research into the causes of EPS continues (4,26–28); unknown genetic and environmental factors might be involved. Early monitoring for EPS is therefore important.
Hemodialysis (HD) patients show an inverse relationship between BMI and mortality (29). Compared with a healthy population, patients in the present study had a lower BMI and less adipose tissue, similar to what has previously been shown in HD patients (30). Dialysis per se might therefore have contributed to some of the measured reduction in BMI and fat mass; however, the patients in our EPS group were more severely wasted than those in the BMI study in HD patients. In future, it might be useful to investigate whether nutrition status correlates with dialysis vintage and what effect long-term dialysis might have on anthropometric markers.
In clinical practice, percentage weight loss is used as an indicator of nutrition status. This parameter is a good predictor, a loss of more than 10% in 6 months being associated with poor surgical outcomes (31,32), and most predictive of surgical mortality when compared with other nutrition variables (33). Unintentional weight loss is independently predictive of clinical outcome in HD patients (34). Most patients in our study experienced more than 10% loss of body weight, which might lead to poor postoperative outcomes in this patient group.
Upper-arm anthropometrics and HGS are useful for nutrition assessment in EPS patients because of their fluid accumulation, chronic disease, and potential for long-term PN. Additional anthropometric measurements reveal that a large percentage of these patients are malnourished (defined as wasting, with depleted fat and LBM), which might be a result of anorexia and inflammation in these individuals. Low body fat and fat loss over time are independently associated with higher mortality (35). Previous studies have shown MAC to be predictive of complications in surgical patients (31,36) and to correlate closely with BMI (31).
A large percentage of our patients had reduced HGS, which is an indicator of malnutrition in surgical patients and a predictor of postoperative complications (37), with 85% or less of normal values being indicative (38). As a marker of LBM, HGS is a good prognostic indicator independent of albumin and CRP (39); it also correlates with malnutrition–inflammation score (40). Extensive losses of muscle mass, strength, and function likely contributes to prolonged recovery, especially in the presence of a pre-existing deficiency of muscle mass (41). In the present study, clinically significant weight loss was linked with low HGS, suggesting that, as patients lose weight, their functional status declines in advance of any surgical intervention. As seen in other cohorts, BMI correlated positively with all upper-arm anthropometrics and with HGS (13). No correlation of parameters of nutrition with age was observed, suggesting that sarcopenia was not a factor.
Preoperative anthropometrics provided detailed information on body composition to guide and tailor the nutrition prescription and to serve as a baseline for postoperative monitoring and prescription adaptation. These measures are particularly useful when patients are bedbound or have significant fluid overload. Anthropometry should be used in EPS patients to identify those who require nutrition support and to monitor that support, particularly in patients who might require surgical intervention. It is important that patients are not greatly nutritionally depleted before surgery (6).
Surprisingly, the SGA showed that 10% of patients were well-nourished, indicating that not all EPS patients are malnourished, and highlighting the value of thoroughly investigating the underlying nutrition status of these patients to ensure appropriate and individualized nutrition support. The SGA analyses did not correlate with outcome, however. The number of patients with a grade A score was small, which made a categorical analyses difficult. A larger study is needed to understand how SGA might affect outcomes.
Serum albumin in our study patients was low before surgery and did not correlate with other nutrition variables. That finding supports results from previous studies demonstrating that hypoalbuminemia is a consequence of disease and does not reflect nutrition status (42) or relate to other measures of nutrition in HD patients (43). However, hypoalbuminemia does predict mortality in HD patients (44), which may be a consequence of its relationship with inflammation (12). Preoperatively, our cohort had high serum CRP, which has the greatest effect on serum albumin (45). That relationship is thought to be attributable to malnutrition–inflammation syndrome in which proinflammatory cytokines link protein–energy malnutrition in HD patients with raised CRP and low albumin levels, subsequent cardiovascular disease, and poor outcomes (46). The cytokines released in EPS (47,48) trigger a “stress response,” increasing serum CRP, which subsequently affects the way the body utilizes and preserves nutrients (46).
Zinc levels were below normal in many of our EPS patients, a finding that has also been seen in HD populations (49,50). Zinc is required for normal nutrient metabolism and body function; deficiency might impair immune function and wound healing. Identification and treatment of zinc deficiency in EPS surgical patients is therefore very important.
Bowel adhesion conditions in EPS restrict normal digestive motion (51); however, patients have varying degrees of the various GI symptoms, and many do not show poor appetite. In our cohort, the common GI symptoms related to features of bowel obstruction were vomiting, nausea, abdominal pain, and bloating. There is a need for early recognition of GI symptoms, which may herald a diagnosis of EPS, and for preoperative optimization of nutrition status with intensive nutrition support. In the present study, more than half the patients were classified as severely malnourished by SGA score. Enia et al. (52) found the SGA to be a reliable measure of nutrition status in dialysis patients, showing relationships with serum albumin, MAMC, and fat; however, other studies reported poor reliability (45,53).
Preoperative time after an EPS diagnosis ranged widely in our patients, sometimes because of long-term periods on PN at referring hospitals or at home before the decision for surgery was taken. Patients tended to be admitted 7 – 11 days before surgery. Feeding for 7 days, even in the presence of inflammation, creates significant metabolic improvement at a cellular level, even before any changes in nutrition assessment measures are seen (54). When undertaken by experienced teams, carefully calculated to individual requirements, and monitored to avoid overfeeding, PN is a suitable feeding option (55). In severely malnourished patients, 7 – 10 days of preoperative PN improves outcomes (56). In our cohort, 6 patients were admitted on an emergency basis, with no time for preoperative feeding. Emergency surgery must go ahead despite the nutrition status of the patients. Ideally, patients would have a more planned admission, with time scheduled for preoperative feeding to optimize their nutrition status.
Still, in considering the effect that preoperative nutrition status has on outcomes, the impact of other factors such as age, infections, and surgical issues must be recognized. Preliminary analysis in our patient group revealed that poor nutrition status negatively affected the postoperative course in terms of critical care stay and postoperative PN dependence. Some patients were transferred from our center back to their referring hospital still on PN. At that point, dietetic care is taken over by the base hospital and follow-up from our center is lost. We therefore have no access to details of total postoperative PN time or nutrition outcomes in terms of whether patients were able eventually to resume normal eating. Further work looking at various outcome measures and the effects of nutrition status and treatment are needed.
Our study highlights how dietetic assessment provides essential details of the nutrition status of patients, which can then be used to guide nutrition management. In the future, we hope to report changes in nutrition status over time and longer-term postoperative follow-up with respect to outcomes at 12 and 24 months. With a larger cohort, we can analyze differences between groups by SGA score, presence or absence of diabetes, modality, and ethnicity, potentially highlighting nutrition or outcome trends in those groups.
Conclusions
The results of the present study detail the severe impact of EPS on nutrition and the need for preoperative dietetic support for this nutritionally challenged cohort of patients. Early dietetic referral and careful monitoring of nutrition status, with support through oral, enteral, or (often) parenteral supplementation is essential before the patient becomes too nutritionally deficient (6,56–58). The significant risk of refeeding syndrome in these patients must also be recognized (5,10).
Disclosures
The authors report that no financial conflict of interest exists.
REFERENCES
- 1. Brown EA, Van Biesen W, Finkelstein FO, Hurst H, Johnson DW, Kawanishi H, et al. on behalf of the ISPD working party Length of time on peritoneal dialysis and encapsulating peritoneal sclerosis: position paper for ISPD. Perit Dial Int 2009; 29:595–600. [PubMed] [Google Scholar]
- 2. Lo WK, Kawanishi H. Encapsulating peritoneal sclerosis—medical and surgical treatment. Perit Dial Int 2009; 29(Suppl 2):S211–14. [PubMed] [Google Scholar]
- 3. Gayomali C, Hussein U, Cameron SF, Protopapas Z, Finkelstein FO. Incidence of encapsulating peritoneal sclerosis: a single-center experience with long-term peritoneal dialysis in the United States. Perit Dial Int 2011; 31:279–86. [DOI] [PubMed] [Google Scholar]
- 4. Korte MR, Sampimon DE, Lingsma HF, Fieren MW, Looman CWN, Zietse R, et al. on behalf of the Dutch Multicenter EPS Study Risk factors associated with encapsulating peritoneal sclerosis in Dutch EPS study. Perit Dial Int 2011; 31:269–78. [DOI] [PubMed] [Google Scholar]
- 5. De Freitas D, Jordaan A, Williams R, Alderdice J, Curwell J, Hurst H, et al. Nutritional management of patients undergoing surgery following diagnosis with encapsulating peritoneal sclerosis. Perit Dial Int 2008; 28:271–6. [PubMed] [Google Scholar]
- 6. Woodrow G, Augustine T, Brown EA, Cowling M, El-Sherbini N, Hurst H, et al. UK Encapsulating Peritoneal Sclerosis Clinical Practice Guidelines. Petersfield, UK: Renal Association; 2009. [Google Scholar]
- 7. Kawanishi H, Moriishi M, Ide K, Dohi K. Recommendation of the surgical option for treatment of encapsulating peritoneal sclerosis. Perit Dial Int 2008; 28(Suppl 3):S205–10. [PubMed] [Google Scholar]
- 8. Demling RH. Nutrition, anabolism and the wound-healing process: an overview. Eplasty 2009; 9:e9. [PMC free article] [PubMed] [Google Scholar]
- 9. Correia MI, Waitzberg DL. The impact of malnutrition on morbidity, mortality, length of hospital stay and costs evaluated through a multivariate model analysis. Clin Nutr 2003; 22:235–9. [DOI] [PubMed] [Google Scholar]
- 10. Jordaan A, De Freitas DG, Hurst H, Alderdice J, Curwell J, Brenchley PE, et al. Malnutrition and refeeding syndrome associated with encapsulating peritoneal sclerosis. Perit Dial Int 2007; 27:100–1. [PubMed] [Google Scholar]
- 11. Kalantar–Zadeh K, Stenvinkel P, Pillon L, Kopple JD. Inflammation and nutrition in renal insufficiency. Adv Ren Replace Ther 2003; 10:155–69. [DOI] [PubMed] [Google Scholar]
- 12. Don BR, Kaysen G. Serum albumin: relationship to inflammation and nutrition. Semin Dial 2004; 17:432–7. [DOI] [PubMed] [Google Scholar]
- 13. Norman K, Schütz T, Kemps M, Josef Lübke H, Lochs H, Pirlich M. The subjective global assessment reliably identifies malnutrition-related muscle dysfunction. Clin Nutr 2005; 24:143–50. [DOI] [PubMed] [Google Scholar]
- 14. Baker JP, Detsky AS, Wesson DE, Wolman SL, Stewart S, Whitewell J, et al. Nutritional assessment: a comparison of clinical judgement and objective measurements. N Engl J Med 1982; 306:969–72. [DOI] [PubMed] [Google Scholar]
- 15. Baker JP, Detsky AS, Whitwell J, Langer B, Jeejeebhoy KN. A comparison of the predictive value of nutritional assessment techniques. Hum Nutr Clin Nutr 1982; 36:233–41. [PubMed] [Google Scholar]
- 16. Detsky AS, Baker JP, Mendelson RA, Woodman SL, Wesson DE, Jeejeebhoy KN. Evaluating the accuracy of nutritional assessment techniques applied to hospitalized patients: methodology and comparisons. JPEN J Parenter Enteral Nutr 1984; 8:153–9. [DOI] [PubMed] [Google Scholar]
- 17. Detsky AS, McLaughlin JR, Baker JP, Johnston N, Whittaker S, Mendelson RA, et al. What is subjective global assessment of nutritional status? JPEN J Parenter Enteral Nutr 1987; 11:8–13. [DOI] [PubMed] [Google Scholar]
- 18. Bergström J, Heimbürger O, Lindholm B, Qureshi AR. Elevated serum C-reactive protein is a strong predictor of increased mortality and low serum albumin in haemodialysis (HD) patients [Abstract]. J Am Soc Nephrol 1995; 6:573. [Google Scholar]
- 19. Yeun JY, Levine RA, Mantadilok V, Kaysen GA. C-Reactive protein predicts all-cause and cardiovascular mortality in hemodialysis patients. Am J Kidney Dis 2000; 35:469–76. [DOI] [PubMed] [Google Scholar]
- 20. Wicks C, Madden A, on behalf of the Liver Interest Group of the British Dietetic Association A Practical Guide to Nutrition in Liver Disease. Birmingham, UK: British Dietetic Association; 1994. [Google Scholar]
- 21. Todorovic VE, Micklewright A, on behalf of the Parenteral and Enteral Group of the British Dietetic Association A Pocket Guide to Clinical Nutrition: A Collection of Data to Provide Basic Guidelines for the Dietician Involved in Nutritional Support. 3rd ed. Birmingham, UK: British Dietetic Association; 2004. [Google Scholar]
- 22. Bishop CW, Bowen PE, Ritchey SJ. Norms for nutritional assessment of American adults by upper arm anthropometry. Am J Clin Nutr 1981; 34:2530–9. [DOI] [PubMed] [Google Scholar]
- 23. Goode AW, Howard P, Woods S. Clinical Nutrition and Dietetics for Nurses. London, UK: Hodder and Stoughton; 1985: 130. [Google Scholar]
- 24. Klidijan AM, Archer TJ, Foster KJ, Karran SJ. Detection of dangerous malnutrition. JPEN J Parenter Enteral Nutr 1982; 6:119–21. [DOI] [PubMed] [Google Scholar]
- 25. Norman K, Pichard C, Lochs H, Pirlich M. Prognostic impact of disease-related malnutrition. Clin Nutr 2008; 27:5–15. [DOI] [PubMed] [Google Scholar]
- 26. Dunn WB, Summers A, Brown M, Goodacre R, Lambie M, Johnson T, et al. Proof-of-principle study to detect metabolic changes in peritoneal dialysis effluent in patients who develop encapsulating peritoneal sclerosis. Nephrol Dial Transplant 2012; 27:2502–10. [DOI] [PubMed] [Google Scholar]
- 27. Yaginuma T, Yamamoto I, Yamamoto H, Mitome J, Tanno Y, Yokoyama K, et al. Increased lymphatic vessels in patients with encapsulating peritoneal sclerosis. Perit Dial Int 2012; 32:617–27. [DOI] [PMC free article] [PubMed] [Google Scholar]
- 28. Loureiro J, Gónzalez–Mateo G, Jimenez–Heffernan J, Selgas R, López–Cabrera M, Aguilera Peralta A. Are the mesothelial-to-mesenchymal transition, sclerotic peritonitis syndromes, and encapsulating peritoneal sclerosis part of the same process? Int J Nephrol 2013; 2013:263285. [DOI] [PMC free article] [PubMed] [Google Scholar]
- 29. Herselman M, Esau N, Kruger JM, Labadarios D, Moosa MR. Relationship between body mass index and mortality in adults on maintenance hemodialysis: a systematic review. J Ren Nutr 2010; 20:281–92. [DOI] [PubMed] [Google Scholar]
- 30. Chumlea W, Dwyer J, Burgen C, Burkart J, Parandandi L, Frydrych A, et al. on behalf of the Hemodialysis Study Group Nutritional status assessed from anthropometric measures in the HEMO study. J Ren Nutr 2003; 13:31–8. [DOI] [PubMed] [Google Scholar]
- 31. Windsor JA, Hill GL. Weight loss with physiologic impairment. A basic indicator of surgical risk. Ann Surg 1988; 207:290–6. [DOI] [PMC free article] [PubMed] [Google Scholar]
- 32. Parekh NR, Steiger E. Percentage weight loss as a predictor of surgical risk: from the time of Hiram Studley to today. Nutr Clin Pract 2004; 19:471–6. [DOI] [PubMed] [Google Scholar]
- 33. Powell–Tuck J, Hennessy EM. A comparison of mid upper arm circumference, body mass index and weight loss as indices of undernutrition in acutely hospitalized patients. Clin Nutr 2003; 22:307–12. [DOI] [PubMed] [Google Scholar]
- 34. Campbell KL, MacLaughlin HL. Unintentional weight loss is an independent predictor of mortality in a haemodialysis population. J Ren Nutr 2010; 20:414–18. [DOI] [PubMed] [Google Scholar]
- 35. Kalantar–Zadeh K, Kuwae N, Wu DY, Shantouf RS, Fouque D, Anker SD, et al. Associations of body fat and its changes over time with quality of life and prospective mortality in haemodialysis patients. Am J Clin Nutr 2006; 83:202–10. [DOI] [PubMed] [Google Scholar]
- 36. Klidjian AM, Foster KJ, Kammerling RM, Cooper A, Karran SJ. Relation of anthropometric and dynometric variables to serious postoperative complications. Br Med J 1980; 281:899–901. [DOI] [PMC free article] [PubMed] [Google Scholar]
- 37. Hunt DR, Rowlands BJ, Johnston D. Hand grip strength—a simple prognostic indicator in surgical patients. JPEN J Parenter Enteral Nutr 1985; 9:701–4. [DOI] [PubMed] [Google Scholar]
- 38. Webb AR, Newman LA, Taylor M, Keogh JB. Hand grip dynamometry as a predictor of postoperative complications reappraisal using age standardized grip strengths. JPEN J Parenter Enteral Nutr 1989; 13:30–3. [DOI] [PubMed] [Google Scholar]
- 39. Wang AY, Sea MM, Ho ZS, Lui S, Li PK, Woo J. Evaluation of handgrip strength as a nutritional marker and prognostic indicator in peritoneal dialysis patients. Am J Clin Nutr 2005; 81:79–86. [DOI] [PubMed] [Google Scholar]
- 40. Silva LF, Matos CM, Lopes GB, Martins TS, Martins MS, Arias LU, et al. Handgrip strength as a simple indicator of possible malnutrition and inflammation in men and women on maintenance haemodialysis. J Ren Nutr 2011; 21:235–45. [DOI] [PubMed] [Google Scholar]
- 41. Wolfe RR. The underappreciated role of muscle in health and disease. Am J Clin Nutr 2006; 84:475–82. [DOI] [PubMed] [Google Scholar]
- 42. Klein S. The myth of serum albumin as a measure of nutritional status. Gastroenterology 1990; 99:1845–6. [DOI] [PubMed] [Google Scholar]
- 43. Heimbürger O, Qureshi AR, Blaner WS, Blerglund L, Stenvinkel P. Hand-grip muscle strength, lean body mass, and plasma proteins as markers of nutritional status in patients with chronic renal failure close to start of dialysis therapy. Am J Kidney Dis 2000; 36:1213–25. [DOI] [PubMed] [Google Scholar]
- 44. Lowrie EG, Lew NL. Death risk in haemodialysis patients: the predictive value of commonly measured variables and an evaluation of death rate differences between facilities. Am J Kidney Dis 1990; 15:458–82. [DOI] [PubMed] [Google Scholar]
- 45. Jones CH, Wolfenden RC, Wells LM. Is subjective global assessment a reliable measure of nutritional status in haemodialysis. J Ren Nutr 2004; 14:26–30. [DOI] [PubMed] [Google Scholar]
- 46. Kalantar–Zadeh K, Kopple JD. Relative contributions of nutrition and inflammation to clinical outcome in dialysis patients. Am J Kidney Dis 2001; 38:1343–50. [DOI] [PubMed] [Google Scholar]
- 47. Schmidt DW, Flessner MF. Pathogenesis and treatment of encapsulating peritoneal sclerosis: basic and translational research. Perit Dial Int 2008; 28(Suppl 5):S10e–15. [PubMed] [Google Scholar]
- 48. Summers AM. Encapsulating peritoneal sclerosis—have we found the perpetrator? Perit Dial Int 2009; 29:499–501. [PubMed] [Google Scholar]
- 49. Muirhead N, Kertesz A, Flanagan PR, Hodsman AB, Hollomby DJ, Valberg LS. Zinc metabolism in patients on maintenance hemodialysis. Am J Nephrol 1986; 6:422–6. [DOI] [PubMed] [Google Scholar]
- 50. Cabral PC, Diniz Ada S, De Arruda IK. Vitamin A and zinc in patients on maintenance haemodialysis. Nephrology (Carlton) 2005; 10:459–63. [DOI] [PubMed] [Google Scholar]
- 51. Wright B, Summer A, Fenner J, Gillott R, Hutchinson CE, Spencer PA, et al. Initial observations using a novel “cine” magnetic resonance imaging technique to detect changes in abdominal motion caused by encapsulating peritoneal sclerosis. Perit Dial Int 2011; 31:287–90. [DOI] [PubMed] [Google Scholar]
- 52. Enia G, Sicuso C, Alati G, Zoccali C. Subjective global assessment of nutrition in dialysis patients. Nephrol Dial Transplant 1993; 8:1094–8. [PubMed] [Google Scholar]
- 53. Cooper BA, Bartlett LH, Aslani A, Allen BJ, Ibels LS, Pollock CA. Validity of subjective global assessment as a nutritional marker in end-stage renal disease. Am J Kidney Dis 2002; 40:126–32. [DOI] [PubMed] [Google Scholar]
- 54. Briet F, Twomey C, Jeejeebhoy KN. Effect of malnutrition and short-term refeeding on peripheral blood mononuclear cell mitochondrial complex I activity in humans. Am J Clin Nutr 2003; 77:1304–11. [DOI] [PubMed] [Google Scholar]
- 55. Jeejeebhoy KN. Total parenteral nutrition: potion or poison? Am J Clin Nutr 2001; 74:160–3. [DOI] [PubMed] [Google Scholar]
- 56. Braga M, Ljungqvist O, Soeters P, Fearon K, Weimann A, Bozzetti F. ESPEN guidelines on parenteral nutrition: surgery. Clin Nutr 2009; 28:378–86. [DOI] [PubMed] [Google Scholar]
- 57. Weimann A, Braga M, Harsanyi L, Lavianod A, Ljungqviste O, Soeters P, et al. Guidelines on enteral nutrition: surgery including organ transplantation. Clin Nutr 2006; 25:224–44. [DOI] [PubMed] [Google Scholar]
- 58. National Institute for Health and Clinical Excellence (NICE) Nutrition Support in Adults. Clinical guideline 32. London, UK: NICE; 2006. [Available online at: http://www.nice.org.uk/nicemedia/live/10978/29979/29979.pdf; cited November 17, 2013] [Google Scholar]


