Abstract
Skin expansion delivers newly grown skin that maintains histological and mechanical features of the original tissue. Although it is the gold standard for cutaneous defect correction today, the underlying mechanisms remain poorly understood. Here we present a novel technique to quantify anisotropic prestrain, deformation, and growth in a porcine skin expansion model. Building on our recently proposed method, we combine two novel technologies, multi-view stereo and isogeometric analysis, to characterize skin kinematics: Upon explantation, a unit square retracts ex vivo to a square of average dimensions of 0.83 × 0.83. Upon expansion, the unit square deforms in vivo into a rectangle of average dimensions of 1.40 × 1.34. Deformations are larger parallel than perpendicular to the dorsal midline suggesting that skin responds anisotropically with smaller deformations along the skin tension lines. Upon expansion, the patch grows in vivo by 1.62 × 1.40 with respect to the explanted, unexpanded state. Growth is larger parallel than perpendicular to the midline, suggesting that elevated stretch activates mechanotransduction pathways to stimulate tissue growth. The proposed method provides a powerful tool to characterize the kinematics of living skin. Our results shed light on the mechanobiology of skin and help us to better understand and optimize clinically relevant procedures in plastic and reconstructive surgery.
Keywords: Multi-view stereo, isogeometric analysis, anisotropy, prestrain, growth, skin
1 Introduction
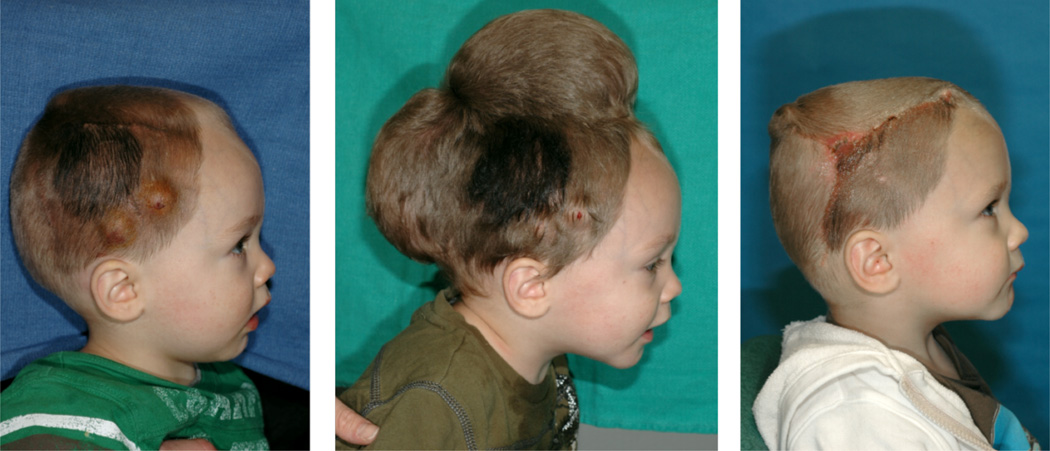
Skin expansion is a common technique in plastic and reconstructive surgery [39]. It is based on the evidence that skin grows and remodels to achieve mechanical homeostasis [13,51]. During the procedure, an expander is placed below the skin and inflated periodically to chronically overstretch the tissue beyond its physiological limit [42,56]. Skin grows in situ producing local flaps that can be used to correct large defects such as giant congenital nevi, burn injuries, and regions of tumor removal [19,29,32]. Fig. 1 illustrates the use of skin expansion to correct a cutaneous defect in a one year-old boy with a giant congenital nevus [58]. To grow extra skin for defect repair, two tissue expanders are implanted and gradually filled with saline solution, left. Expander inflation creates mechanical overstretch and triggers controlled skin growth, middle. After several weeks, the expanders are removed, the nevus is excised, and the defect area is covered with the newly grown skin, right [10]. One preeminent advantage of this technique is the production of skin with the same hair, mechanical properties, color and texture of the surrounding tissue, making it ideal from an aesthetic point of view [47]. At the same time, tissue expansion remains challenging, several open questions prevail, and surgeons have to rely on their own decade-long experience to successfully plan and execute this technique[5].
Fig. 1.
Skin expansion is routinely performed in reconstructive surgery to correct large cutaneous defects. To grow extra skin for defect repair, tissue expanders are implanted underneath the skin, left. The expanders are gradually filled with saline solution to apply mechanical overstretch and trigger controlled skin growth, middle. Several weeks post implantation, the expanders are removed, the defect is excised, and the defect area is covered by the newly grown skin, right.
In response to the indisputable importance of mechanical factors during the skin expansion process [44], we have proposed a mathematical model to capture the relationship between overstretch and skin adaptation using the theory of finite growth within a continuum mechanics framework [7]. We have successfully applied our model to different expander geometries as well as different patient specific scenarios, and we have shown good qualitative comparison with the clinical observations [6,57]. Computational models are being steadily integrated into medical applications and hold the promise of enhancing medical device design and improving treatments efficacy in reconstructive surgery [8]. Measuring and predicting prestrain, deformation, and growth during a routine skin expansion procedure is practically impossible and the usefulness of a computational approach is unquestionable [40]. However, despite the increasing acceptance of computational tools, their integration into clinically relevant scenarios is slow due to the lack of experimental data to calibrate and validate the models.
Here we establish a chronic porcine model to quantify skin kinematics during tissue expansion. This work builds on our recently proposed methodology to characterize prestrain, deformation, and growth [9]. Our experimental setup uses two novel technologies that allow us to obtain the desired data without imposing constraints on a regular expansion procedure: We employ multi-view stereo techniques to reconstruct the three dimensional geometry out of photographs, and adopt isogeometric analysis tools to describe the kinematics of thin membranes. We decompose the total deformation of tissue expansion using the concept of incompatible configurations. The continuum interpolation of the displacement field allows us to quantify regional variations of prestrain, deformation, and growth.
Multi-view stereo (MVS) is the extraction of three-dimensional geometries out of photographs. Originally motivated by the need of creating volumetric representations from medical images, this field of computer vision has seen growing research interest in the past decade [20,49]. In a very simplistic manner, MVS can be understood by considering first binocular stereo. Animals generate depth information from two images since the brain knows the calibration parameters of one eye with respect to the other. In MVS algorithms, such parameters are unknown, however, by having many pairs of images from a single scene, we can determine the calibration values based on feature matching [12]. The accuracy of MVS, with errors as low as 2%, together with its low cost and ease of use, rivals once believed unbeatable reconstruction techniques such as laser scanning [16]. In the field of experimental biomechanics, common reconstruction techniques employ restrictive experimental setups and specialized equipment to track material points [30,54]. The fact that we can readily appreciate the deformations of skin with our naked eye naturally suggests the possibility of capturing its shape by tracking a few interpolatory points with MVS techniques.
B-splines are used commonly as basis functions for smooth interpolation of curves and surfaces in the CAD (Computer Aided Design) industry [43]. Mechanical analysis relies heavily on the finite element technologies based on discretizing the spatial domain by meshing it into several small pieces [21]. Recently, an effort to bridge the gap between design and analysis has brought forth isogeometric analysis (IGA) [22]. The main idea behind IGA is to employ the same basis functions that lie beneath the CAD technology to solve partial differential equations in the exact geometric representation. IGA has received significant attention in recent years and has shown tremendous potential for thin shell analysis [25]. B-spline basis functions offer an advantageous building block for smooth parametric representation of surfaces with high continuity and good approximation over relatively coarse meshes [11].
During skin expansion, tracking a small set of points becomes practical with MVS algorithms. Then, from the coordinates of a few material points, B-spline tensor product patches with a prescribed parametrization can smoothly interpolate deformations using the IGA concept. Using simple finite element meshes to parametrize the deformation would yield strain fields with poor spatial resolution and would require additional subdivision steps [17].
Skin is a thin biological membrane that constitutes our interface with the outside world displaying note-worthy mechanical properties under large strains [14]. Like all biological systems, it actively adapts to its mechanical environment by growth, remodeling, and morphogenesis [52]. When skin is mechanically loaded, the observable changes in the geometrical configuration over time become a combination of reversible and irreversible contributions [1]. The deformation gradient extracted from the IGA membrane description is the key object that links mechanical cues to the final amount of skin growth. For soft tissues, growth can be expressed kinematically through the multiplicative decomposition of the deformation gradient into elastic and growth components [26]. For skin as a thin membrane, we assume that growth takes place exclusively in the plane, and the growth tensor is symmetric and orthotropic [58].
2 Methods
2.1 Animal model
Porcine models are a natural choice for tissue expansion [4]. Experiments in porcine models have improved our understanding of the histological and biomechanical changes of skin upon hyper-stretch [23]. The main reason to choose a porcine expansion model is the similarity between the anatomical and mechanical characteristics of human and young porcine integument [35–37]. From a clinical point of view, tissue expansion in the pig is similar to tissue expansion in humans, with similar criteria for expander selection, filling volume, and ination timing [4].
2.1.1 Surgical procedure
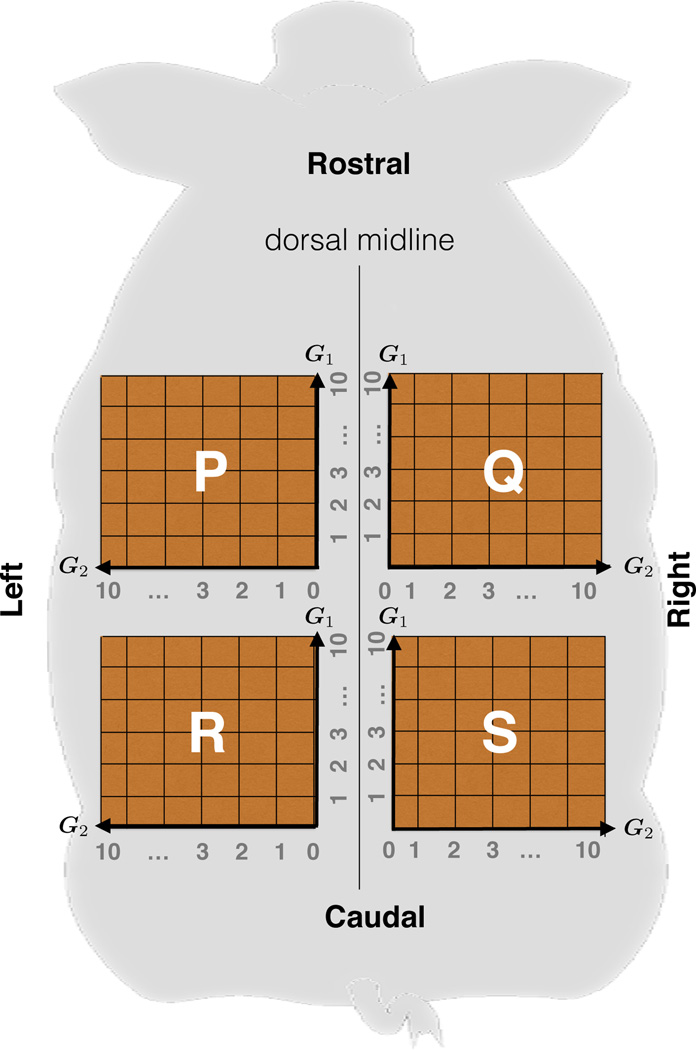
We perform skin expansion on a month-old Yucatan pig (Sinclair Biolabs, Colombus, MO) [9]. The pig acclimated to the laboratory facilities at the Robert H. Lurie Children's Hospital of Chicago according to approved protocols. Following the arrangement in Fig. 2, we tattoo four 10 cm ×10 cm grids on the back of the pig, symmetrically with respect to the midline. We parameterize each grid discretely with coordinates in the interval [0, 10] along the directions G1 and G2. We implant two expanders of 4 cm × 6 cm with filling volumes of 120cc as shown in Fig. 3 (PMT Corporation, Chanhassen, MN), one in the anterior-right grid 𝖰, and one in the posterior-left 𝖱. Grids 𝖯 and 𝖲 serve as controls. After inserting the expanders, we wait 14 days to allow the wounds to heal until we remove the sutures.
Fig. 2.
Nomenclature for the tattooed grids on the porcine model. We label the grids as 𝖯 anterior-left, 𝖰 anterior-right, 𝖱 posterior-left, and 𝖲 posterior-right. Symmetry with respect to the midline ensures expanded and control grids. Coordinates on the grid parametrize each zone along the directions G1, parallel to the dorsal midline, and G2, perpendicular to the dorsal midline along the skin tension lines.
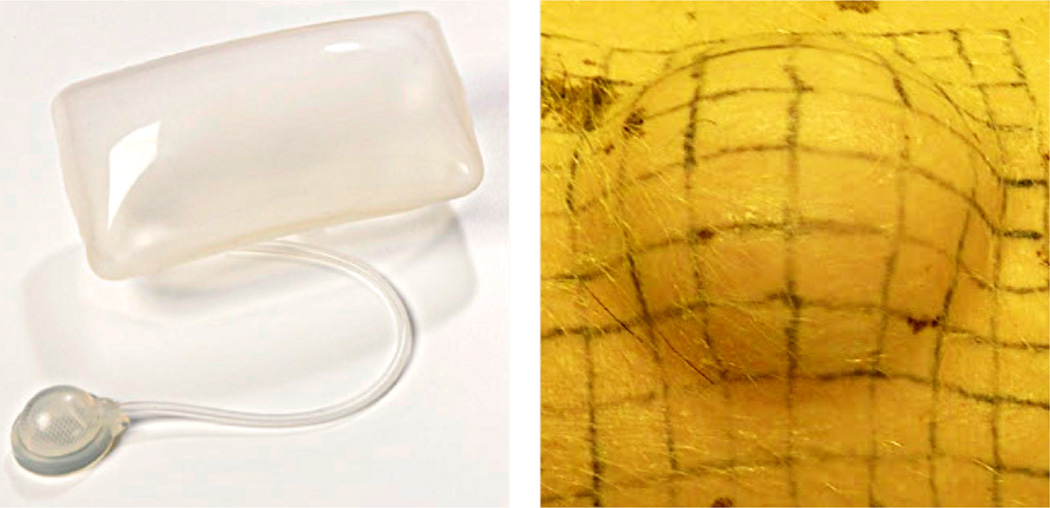
Fig. 3.
Skin expansion in a chronic porcine model. The rectangular tissue expander, left, is implanted subcutaneously underneath a tattooed 10 cm × 10 cm grid and gradually inflated over a period of five weeks. Skin expansion creates mechanical overstretch and triggers controlled skin growth, right.
2.1.2 Skin expansion
Expansion begins after the initial sutures heal. On day t = 0, we begin the expansion by injecting 25cc of saline solution into the anterior expander 𝖰 and 50cc into the posterior expander 𝖱.We repeat this protocol weekly at days t = 8, 15, 22, and 29. On day t = 35, we complete the expansion with a final injection of 15cc and 30cc into the anterior 𝖰 and posterior 𝖱 expanders. Each week, we acquire the deformation by taking 15 photographs from different angles, both before and after expansion.
2.1.3 Tissue harvest and euthanasia
On day t = 38, we anesthetize the animal and acquire the last set of in vivo photographs of the tattooed grids. We then euthanize the animal by using intravenous overdose of pentobarbital (90mg/kg) and excise the four grids. We photograph the excised samples ex vivo for further reconstruction and analysis.
2.2 Multi-view stereo
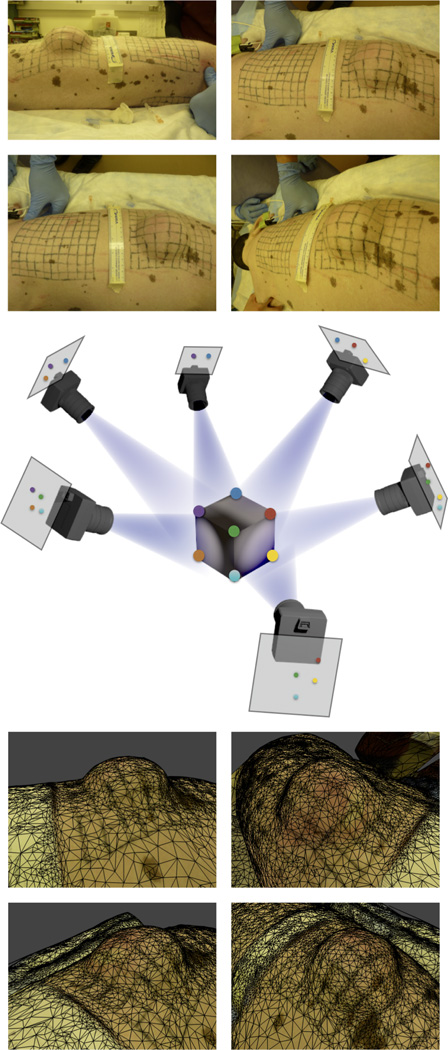
At the end of the experiment, we have collected seven sets of photographs, pre and post expansion, from 15 different angles for each grid [9]. Fig. 4, middle, illustrates this setting. MVS algorithms match common points in pairs of photographs to calculate the camera position and extract the coordinates of these points in the three-dimensional Euclidean space ℝ3. The details of MVS algorithms escape the focus of the present publication; we refer the interested reader to the literature for further details [12]. We adopt an online service for the geometric reconstruction of our experimental setup [3]. Fig. 4, top, shows four different views of a particular time point of interest, while Fig. 4, bottom, illustrates the resulting surface reconstruction approximated with a triangular mesh.
Fig. 4.
Multi-view stereo (MVS) reconstruction. The top shows four photographs of the experimental setup. As illustrated in the middle, the MVS algorithm finds common features between pairs of photographs to find the camera calibration parameters. The bottom depicts four different views of the reconstructed, triangulated surface.
To quantify the accuracy of the reconstruction, we include a ruler in the photograph and we fit a cubic spline to the points to the 1cm marks of the ruler. We calculate the length li between every pair of points along the spline and obtain the average length l̄. We defined the relative reconstruction error e as
| (1) |
where n is the number of spline sections and l̄ is the scaling factor with respect to the physical world where l̄ = 1cm. Fig. 2 illustrates each grid with 121 material points parametrized by a tensor product space of coordinates along directions G1, parallel to the dorsal midline, and G2, perpendicular to the dorsal midline along the skin tension lines. For example, the points from the MVS reconstruction specify the grid 𝖯 at time t, with a, b the integers in the interval [0, 10].
2.3 B-Spline based isogeometric analysis
2.3.1 B-spline curves
A B-spline curve is a piece-wise polynomial function that maps a segment of a line to the three-dimensional Euclidean space γ : ξ ∈ ℝ → ℝ3. The representation of B-spline curve of degree p requires a knot vector Ξ and a set of control points Pi ∈ ℝ3. The knot vector consists of non-decreasing numbers Ξ = [ξ0, ξ1, …, ξn]. The number of control points is m = n − p − 1. The first and last values of the knot vector ξ0 and ξn are repeated p + 1 times. We define basis functions recursively. The zeroth order basis functions are
| (2) |
Higher order functions of degree p ≥ 1 follow from the recursive definition,
| (3) |
The B-spline curve γ is the sum of the basis functions and control points,
| (4) |
2.3.2 B-spline surfaces
There are several alternatives to create surfaces based on B-spline basis functions. We employ tensor product surfaces, which are constructed from a tensor product of two B-spline curves. A B-spline surface is a map from the parametric two-dimensional space to the Euclidean three-dimensional space 𝒮 : ξ = [ξ, η] ∈ ℝ × ℝ → ℝ3. This implies that we require two knot vectors Ξ and Ω that define two sets of basis functions Ni,p and Qj,q. The B-spline surface is then defined with the control net Pi,j ∈ ℝ3
| (5) |
2.3.3 B-Spline isogeometric analysis of skin expansion
Here we explain the analysis for region 𝖯, but it similarly applies for the other three regions 𝖰, 𝖱, and 𝖲. We begin with the 121 points for time t. We fit a bi-cubic B-spline surface patch 𝒮t(ξ, η) with the following parametrization: We choose the knot vectors to be ξ = η = [0, 0, 0, 0, 2, 3, …, 9, 10, 10, 10, 10] and we interpolate such that , with ξ̂a = a, η̂b = b constant for all interpolations. As a result the parametrization remains the same for any time point.
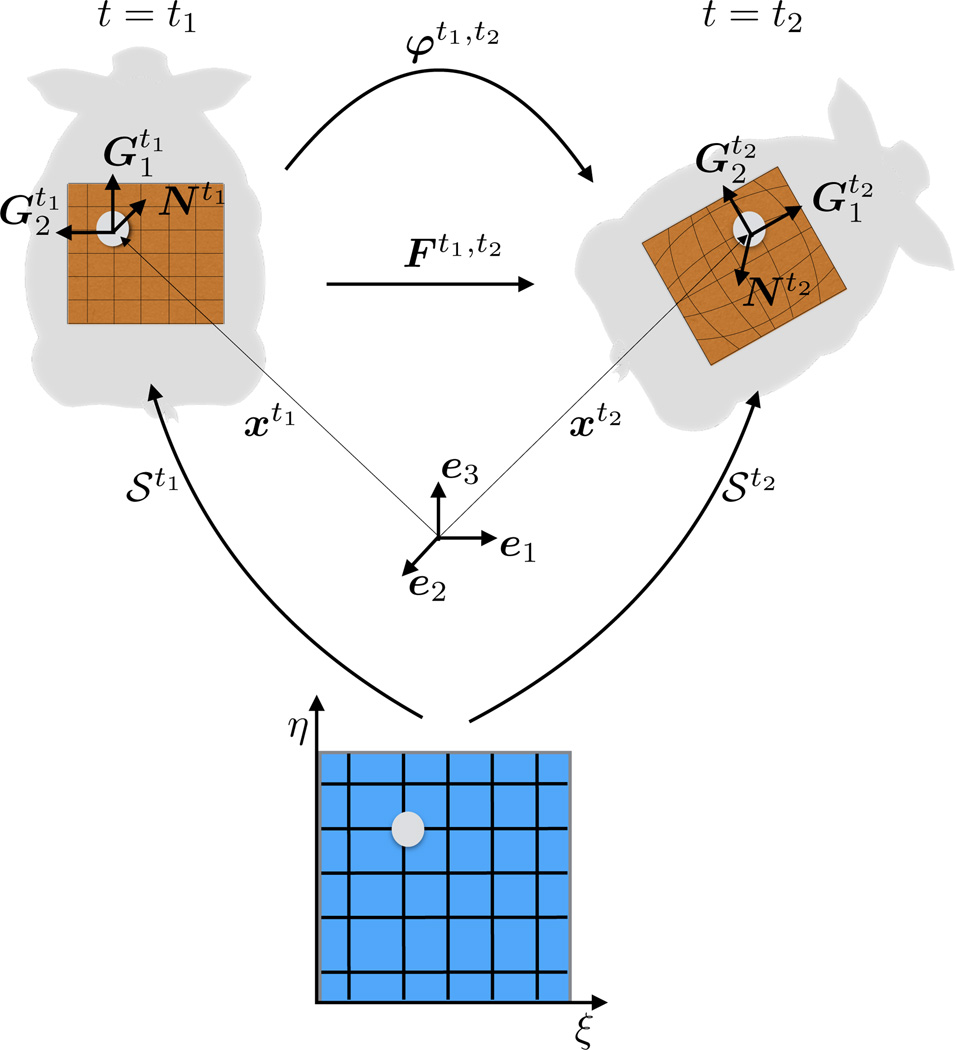
Any given pair of time points t = t1, t2 defines a pair of surfaces 𝒮 = 𝒮t1, 𝒮t2. We choose t1 as the reference and t2 as the deformed configuration of the mid-surface of the membrane under study. Fig. 5-left shows the reference surface, 𝒮t1, embedded from the parametric plane ξ = [ξ, η] = ℝ × ℝ into the three-dimensional Eucledian space. Fig. 5-right shows the deformed surface, 𝒮t2, also embedded from ξ. As a consequence of using the same parametric domain for both surfaces, points xt1,xt2 follow from summation over the same basis functions Rab,
| (6) |
Fig. 5 depicts the deformation map φt1,t2, which establishes the relationship between the reference and deformed membranes. The deformation map, φt1,t2 (ξ) : 𝒮t1 → 𝒮t2, takes a material point from the reference surface, 𝒮t1, to the position of that point on the deformed surface 𝒮t2 [9]. In Kirchhoff-Love kinematics, the normal to the reference mid-surface remains normal and there is no deformation across the thickness as the membrane deforms [11]. The material points of the deformed membrane can be located by a displacement vector ut1,t2 of the mid-surface alone,
| (7) |
or, by incorporating the B-spline surface definition,
| (8) |
Since our geometric description is based on curvilinear coordinates, the tangent space at the point xt1 is spanned locally by the covariant basis vectors,
| (9) |
where a comma denotes the partial differentiation. This implies that are the tangent vectors to the coordinate lines aligned with the longitudinal axis of the pig, while are the tangent vectors to the coordinate lines in the transverse direction illustrated in Figures 2 and 5. We extend the covariant basis vectors with the normal,
| (10) |
The triad , i = 1, 2, 3 spans the three-dimensional space ℝ3 locally, at every point xt1 as shown in Figure 5. The dual basis is composed of contra-variant vectors that satisfy , where denotes the Kronecker delta. The deformed covariant basis vectors follow from the partial differentiation of the deformed surface with respect to the parametric coordinates,
| (11) |
and we extend the set of these covariant basis with the deformed normal such that spans the three-dimensional space ℝ3 at points xt2. The dual basis of the deformed surface satisfies . The deformation gradient Ft1,t2 = ∂φt1,t2/∂xt1 is the key kinematic object, it encapsulates the local deformation between the reference and deformed surfaces, 𝒮t1 and 𝒮t2. Using the chain rule we map the covariant base vectors of the reference configuration, , onto the covariant bases vectors of the deformed configuration, , as
| (12) |
The deformation gradient follows from the summation of the dyadic product of the covariant deformed and contravariant reference basis vectors,
| (13) |
Fig. 5.
Kinematics. Any pair of time points t1, t2 defines a pair of surface embeddings 𝒮t1, 𝒮t2 from the same parametric domain ξ into the three dimensional space ℝ3. At every point xt1, the covariant vectors span the tangent space of the surface, and together with the normal they are a basis for ℝ3. The same is true for xt2. The deformation map between the two configuration is φt1,t2 and its spatial gradient is Ft1,t2.
2.4 Kinematic analysis of skin expansion
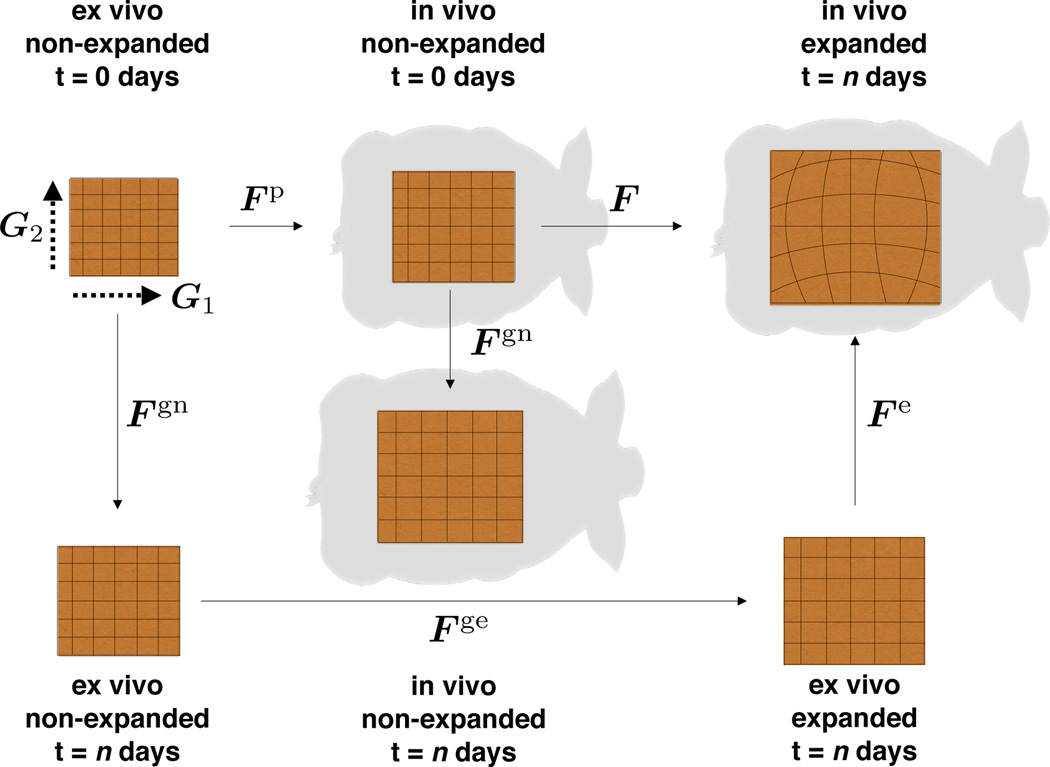
Fig. 6 displays all configurations of interest. At the beginning of expansion at day t = 0, skin in vivo is not stretch free [33]: the deformation gradient with respect to the ex vivo state, denoted as Fp, characterizes the prestain state [2,15]. From the deformation gradient we calculate the Right Cauchy Green Deformation tensor Cp. We are interested in three measures of stretch, the total area change,
| (14) |
and the two stretches in the covariant directions,
| (15) |
parallel to the dorsal midline and perpendicular to the dorsal midline along the skin tension lines.
Fig. 6.
Distinct configurations of the skin patch. In vivo, skin is subjected to prestrain, Fp. Expansion induces deformation, F. Excising the expanded patch releases the reversible, elastic deformation, Fe. Skin growth, Fg, consists of natural growth, Fgn, and expansion-induced growth, Fge.
Fig. 6 illustrates the deformation F at day t = n with respect to the in vivo state. The total deformation, F · Fp, is not fully elastic. Growth can be captured kinematically by splitting the deformation gradient into elastic and growth contributions, Fe · Fg. Fig. 6 portraits the map between the ex vivo and the in vivo patch at day t = n, denoted as Fe, which stores the elastic part. The growth part, Fg, can be further decomposed into growth occurring naturally, Fgn, and growth attributed exclusively to the expansion process Fge,
| (16) |
This approach implies that only the elastic deformation, Fe = F · Fp · Fgn−1 · Fen−1, generates stress [46]. We assume that skin grows exclusively in the plane while its thickness remains constant [56]. We allow the in plane area growth to be anisotropic with preferred directions G1 and G2 parallel and perpendicular to the midline, such that the growth tensor takes the following format [18],
| (17) |
This particular format allows us to multiplicatively correlate area changes associated with the total deformation ϑ, prestrain ϑp, elastic deformation ϑe, expander-induced growth ϑge, and natural growth ϑgn,
| (18) |
The total area growth is simply the product of the stretches parallel and perpendicular to the midline, , where the anisotropic growth stretches and admit the split into natural and expander-induced contributions.
3 Results
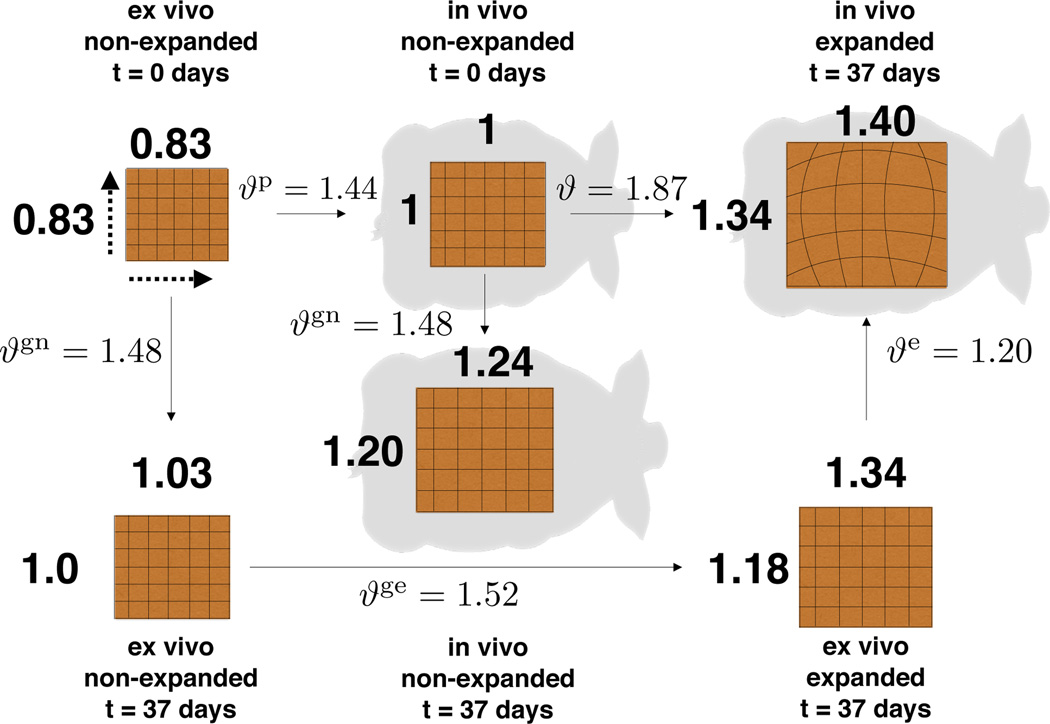
We apply our mathematical analysis to the posterior region 𝖱 and 𝖲. The anterior expansion 𝖯 and 𝖰 failed due to port leakage. The entire expansion process spanned a period of t = 37 days. At the end of the procedure, the expander underneath the left-posterior grid 𝖱 was filled to 280cc and the unexpanded right-posterior grid 𝖲 served as control. Fig. 7 shows the different configurations of the skin patches with the summary of our analysis. We are interested in quantifying three measures of local deformation: prestrain, deformation, and growth. We have previously quantified isotropic area changes [9], which we include here to complement our current orthotropic characterization.
Fig. 7.
Distinct configurations of the skin patch. Upon explantation, an in vivo unit square retracts to a square of dimensions 0.83 × 0.83 due to prestrain. Upon expansion, the unit square transforms into a 1.40 × 1.34 rectangle, with greater stretch in the direction parallel to the midline. During expansion, the patch grows naturally by 1.24 × 1.20. The final size of the expanded patch includes natural and expander-induced growth, which turns a 1.03 × 1.00 naturally grown patch into the final 1.34 × 1.18 ex vivo patch.
3.1 Prestrain
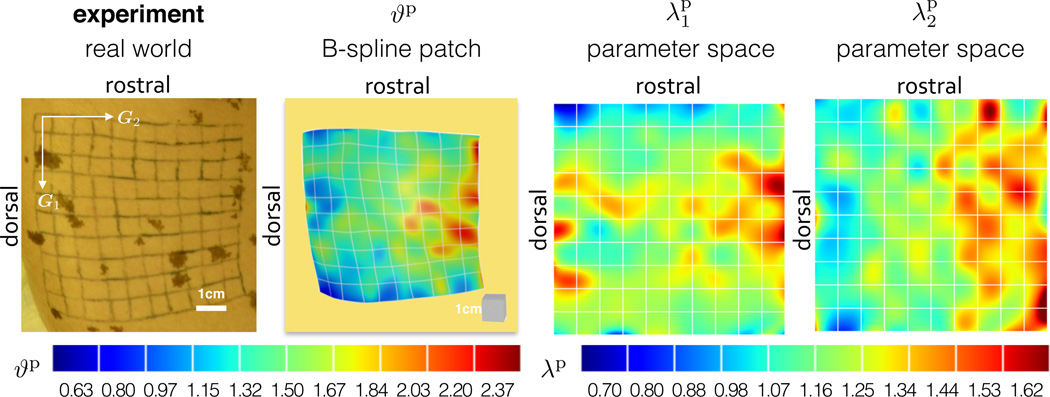
Tissues in vivo are not stress free [45]. Upon explantation, the flap of skin retracts revealing that skin in vivo is under some amount of deformation. Our experimental setup lets us use the unexpanded control patch to quantify the amount of prestrain. We create two three-dimensional models from the 𝖲 patch at t = 37 days, once before the animal is sacrificed, once of the excised tissue. The deformation map between these two configurations, indicated as Fp in Fig. 6, defines the area change due to prestrain at every point across the grid. We assume the excised tissue to be stress free and label the total deformation of skin in vivo as Fp. We calculate the local area change as ϑp = det(Fp).We quantify the average area change as , with maximum and minimum values of and . We calculate the prestretch in the directions of the covariant basis vectors G1 and G2, which correspond to the sagittal and transverse directions. The prestretches average and . Table 1 summarizes the results of the prestrain analysis. Fig. 8 illustrates the contour plots of the total area prestrain ϑp as well as the prestretches and parallel to the dorsal midline and perpendicular to the dorsal midline along the skin tension lines.
Table 1.
Summary of prestrain for patch 𝖲.
| prestrain measure |
ex vivo non-expanded t=37 days |
in vivo non-expanded t=37 days |
|---|---|---|
| [−] | 1.00 | 1.44 |
| [−] | 1.00 | 2.37 |
| [−] | 1.00 | 0.63 |
| [−] | 1.00 | 1.21 |
| [−] | 1.00 | 1.62 |
| [−] | 1.00 | 0.70 |
| [−] | 1.00 | 1.21 |
| [−] | 1.00 | 1.54 |
| [−] | 1.00 | 0.91 |
| error e [%] | 13.1 | 2.00 |
Fig. 8.
Prestrain. The first column shows the experimental setup. The second column shows the geometric representation using a B-spline patch with the overlaid contour plot of the total area change ϑp, which averages 1.44. The third and fourth columns show the contour plots of the anisotropic prestretches and in the directions parallel and perpendicular to the midline, both directions exhibit average values 1.21
3.2 Deformation
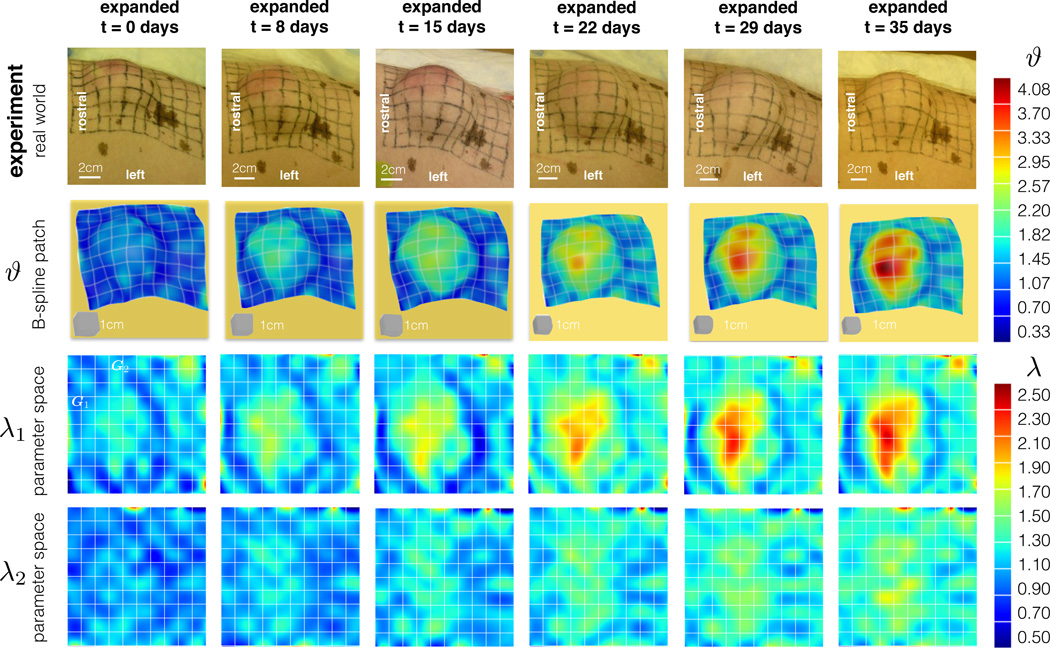
Fig. 7 summarizes the result of the deformation analysis with the non-expanded in vivo patch 𝖱 at day t = 0 as reference configuration. Every week, we obtain the deformation of the patch with respect to the reference configuration and calculate the corresponding gradient F. We are interested in the total area change ϑ and two in-plane stretches λ1 and λ2 parallel and perpendicular to the midline. Table 2 summarizes the results of the weekly inflations.
Table 2.
Summary of deformation for patch 𝖱.
| time [days] |
volume [cc] |
ϑavg [−] |
ϑmax [−] |
ϑmin [−] |
λ1,avg [−] |
λ1,max [−] |
λ1,min [−] |
λ2,avg [−] |
λ2,max [−] |
λ2,min [−] |
error e % |
|---|---|---|---|---|---|---|---|---|---|---|---|
| 0 | 0 | 1.00 | 1.00 | 1.00 | 1.00 | 1.00 | 1.00 | 1.00 | 1.00 | 1.00 | 4.7 |
| 0 | 50 | 1.17 | 2.49 | 0.41 | 1.13 | 2.24 | 0.52 | 1.04 | 2.23 | 0.45 | 0.9 |
| 8 | 100 | 1.31 | 2.79 | 0.50 | 1.19 | 2.08 | 0.43 | 1.10 | 2.16 | 0.60 | 1.0 |
| 15 | 150 | 1.43 | 3.21 | 0.33 | 1.22 | 2.29 | 0.38 | 1.17 | 2.58 | 0.49 | 1.0 |
| 22 | 200 | 1.73 | 4.08 | 0.46 | 1.40 | 2.64 | 0.39 | 1.24 | 2.89 | 0.70 | 1.5 |
| 29 | 250 | 1.77 | 3.52 | 0.48 | 1.36 | 2.30 | 0.48 | 1.29 | 2.71 | 0.55 | 1.2 |
| 35 | 280 | 1.87 | 4.05 | 0.53 | 1.39 | 2.43 | 0.41 | 1.34 | 2.72 | 0.55 | 0.6 |
The average area stretch increases monotonically with each inflation, reaching a final value of ϑavg = 1.87 with respect to the non-expanded reference patch at day t = 0. The stretches in the directions parallel and perpendicular to the midline display an interesting trend: The stretch perpendicular to the midline λ2 is always smaller than the corresponding parallel stretch λ1. This implies that the tissue is stretched more parallel than perpendicular to the long axis of the animal. After the expansion process is complete, the average stretches are λ1,avg = 1.40 and λ2,avg = 1.34. This deformation corresponds to a unit square stretched to a rectangle of dimensions 1.40 × 1.34 as illustrated in Fig. 7.
Fig. 9 shows the contour plots of the total area stretch ϑ and the stretches λ1 and λ2 parallel and perpendicular to the midline. The total deformation is greater in the center of the expander and it decreases towards the edges of the patch. The stretches λ1 parallel to the midline shows a similar distribution to the total area stretch. The stretches λ2 perpendicular to the midline show slightly higher values near the center of the expander, but their overall contour profile appears to be more homogeneous.
Fig. 9.
Deformation. The columns depict the chronic overstretch due to weekly inflations. The first row shows photographs of the experimental setup at different points in time. Sets of photographs at each time point allow us to reconstruct the B-spline patches in the second row. We are interested in the total area change ϑ as well as stretches λ1 and λ2 parallel and perpendicular to the midline. The contour plots reveal larger strains at the center of the expander and smaller strains in the periphery.
3.3 Growth
While the expansion process is taking place, the animal undergoes natural growth. We quantify the total physiological growth comparing the control patch 𝖲 at days t = 0 and t = 37 before the animal is sacrificed. The gradient of the deformation between these two configurations, Fgn, is illustrated in Fig. 6. The natural area growth is ϑgn = det(Fgn). On average, skin grows naturally by . Remarkably, growth is anisotropic averaging and parallel and perpendicular to the midline. Graphically, natural growth can be visualized as a unit square turned into a rectangle of dimensions 1.24 × 1.20 drawn in Fig. 7. Table 3 compiles these findings.
Table 3.
Summary of natural growth for patch 𝖲.
| growth | in vivo non-expanded t=0 days |
in vivo non-expanded t=37 days |
|---|---|---|
| [−] | 1.00 | 1.48 |
| [−] | 1.00 | 2.36 |
| [−] | 1.00 | 1.07 |
| [−] | 1.00 | 1.24 |
| [−] | 1.00 | 1.57 |
| [−] | 1.00 | 0.78 |
| [−] | 1.00 | 1.20 |
| [−] | 1.00 | 1.83 |
| [−] | 1.00 | 0.95 |
| error e [%] | 2.07 | 2.00 |
In response to deformations beyond the physiological limits, skin grows to re-establish a state of mechanical homeostasis. At the end of the expansion procedure, the excised, expanded tissue patch partially retracts and exposes the reversible, purely elastic part of the deformation Fe. We create kinematic representations of the patch 𝖱 at day t = 37, both in vivo and ex vivo. The determinant of deformation gradient Fe between these two configurations defines the elastic area change, which averages . The elastic stretches parallel and perpendicular to the midline are and . Table 4 collects these results.
Table 4.
Summary of purely elastic deformation for patch 𝖱.
| elastic deformation |
ex vivo expanded t=37 days |
in vivo expanded t=37 days |
|---|---|---|
| [−] | 1.00 | 1.20 |
| [−] | 1.00 | 2.52 |
| [−] | 1.00 | 0.63 |
| [−] | 1.00 | 1.05 |
| [−] | 1.00 | 1.63 |
| [−] | 1.00 | 0.61 |
| [−] | 1.00 | 1.14 |
| [−] | 1.00 | 2.02 |
| [−] | 1.00 | 0.65 |
| error e [%] | 1.7 | 0.6 |
The remaining deformation of the expanded patch contains the information related to skin growth. The total area growth can itself be understood as the multiplicative decomposition into natural growth and expansion-induced growth, Fg = Fge · Fgn. Following the diagram in Fig. 6, we can compute the total growth using the prestrain, natural growth, and elastic deformation tensors already available, then Fg = Fe−1 · F · Fp.
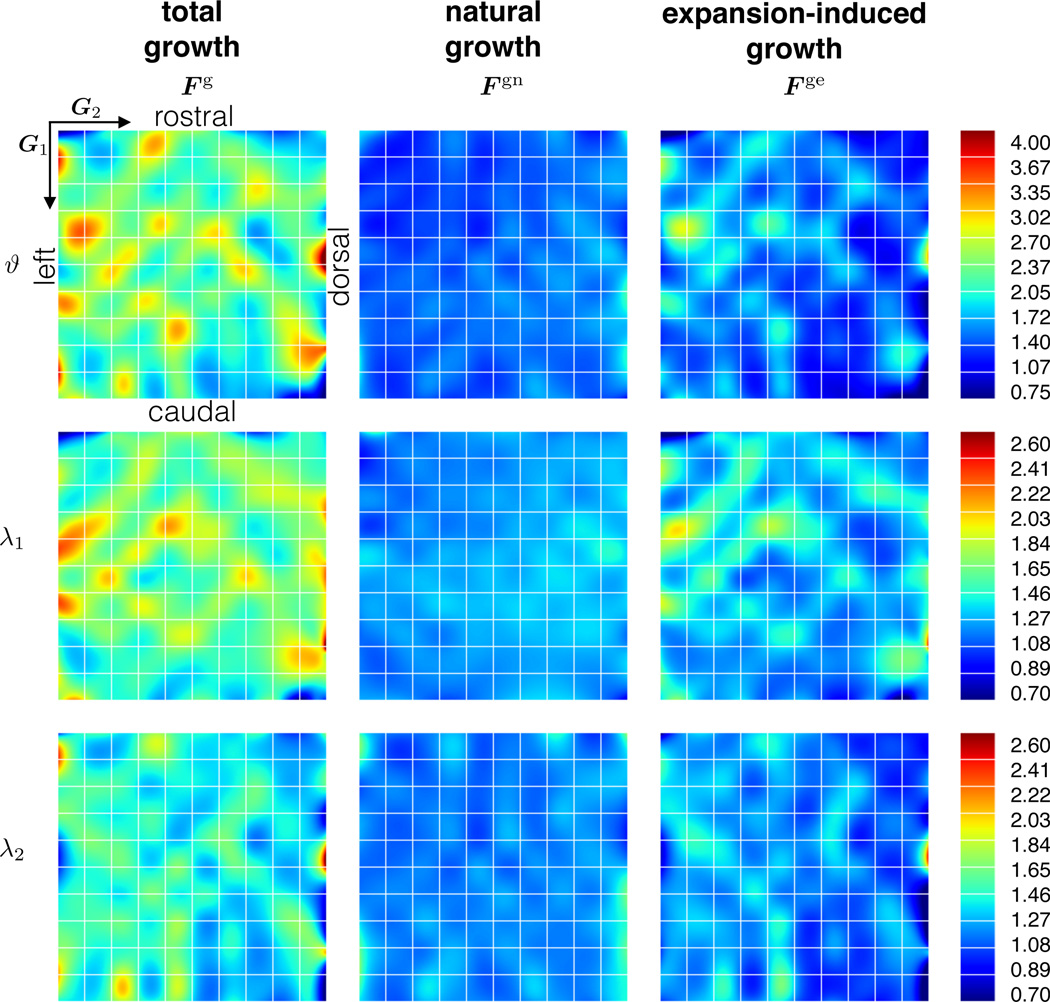
The average total area growth is , of which can be attributed exclusively to expansion-induced growth. The average total growth parallel and perpendicular to the midline is and . Again, we can deduct the amount of natural growth to obtain the average expansion-induced growth and . Growth of a unit square is anisotropic, both natural growth and expansion-induced growth induce a larger tissue gain parallel to the midline. Table 5 summarizes these findings. Fig. 10 shows the contour plots of the three different growth quantities.
Table 5.
Summary of total growth, natural growth, and expansion-induced growth, from analyzing patches 𝖱 and 𝖲.
| growth | avg | max | min |
|---|---|---|---|
| ϑg [−] | 2.25 | 4.81 | 0.52 |
| ϑgn [−] | 1.48 | 2.36 | 1.07 |
| ϑge [−] | 1.54 | 3.30 | 0.28 |
| [−] | 1.62 | 3.24 | 0.61 |
| [−] | 1.24 | 1.57 | 0.78 |
| [−] | 1.31 | 2.65 | 0.43 |
| [−] | 1.43 | 2.98 | 0.57 |
| [−] | 1.20 | 1.83 | 0.95 |
| [−] | 1.19 | 2.61 | 0.40 |
Fig. 10.
Growth. Total, natural, and expansion-induced growth are calculated from prestrain, total deformation, and elastic deformation. The columns show the decomposition of the total growth tensor Fg into natural growth Fgn and expansion-induced growth Fge. The rows showcase the total area growth ϑg and the corresponding growth stretches and parallel and perpendicular to the midline. Natural growth is more homogeneous than expansion-induced growth, which is larger in regions where the overall deformation is larger.
4 Discussion
Skin grows in response to chronic overstretch: at the end of a tissue expansion procedure, the total deformation is a combination of reversible and irreversible contributions. Plastic and reconstructive surgeons typically guess the time point, by which they have expanded the tissue enough to create a sufficiently large patch for defect correction. In clinical practice, this lack of knowledge leads to severe and unnecessary overgrowth.
Here we extend our novel experimental setup [9] towards a new anisotropic characterization of prestrain, deformation, and growth using a porcine skin expansion model. We combine two recent technologies, multi-view stereo (MVS) and isogeometric analysis (IGA), within the continuum theory of finite growth. MVS allows us to reconstruct three-dimensional models from a set of uncalibrated photographs with unknown camera positions. Isogeometric analysis uses B-spline basis functions to smoothly interpolate surface deformation maps and strain fields over relatively coarse meshes. The theory of finite growth captures reversible and irreversible deformation by splitting the total deformation gradient into an elastic and a growth part. Here we are specifically interested in quantifying three aspects of the expansion process: prestrain, deformation, and growth.
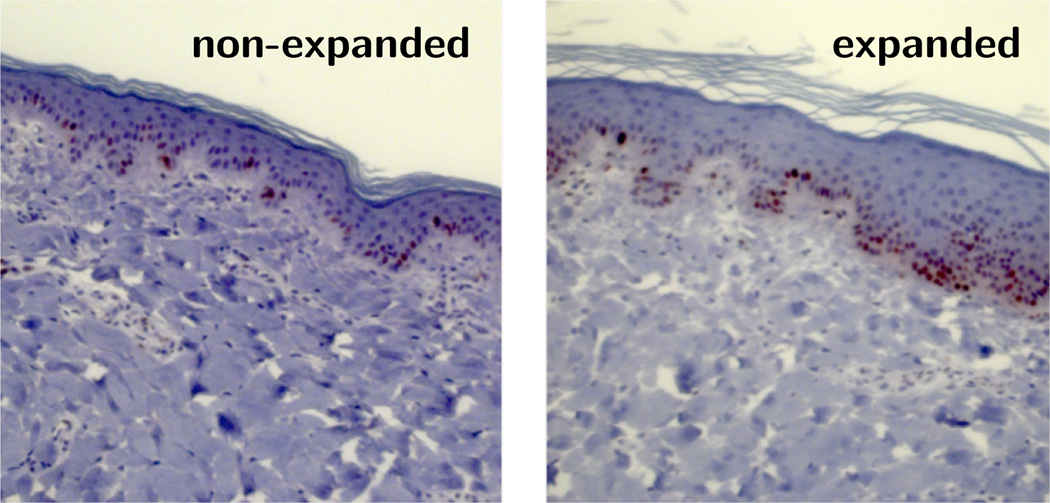
We find that skin in vivo is prestretched isotropically, on average by ϑp = 1.44, i.e., by λp = 1.21 parallel and perpendicular to the midline. Ventral porcine integument has revealed prestretch on the same order of magnitude, with average in vivo stretches of 1.26 transversely and 1.65 longitudinally [24]. Experiments on human forearm skin displayed similar values with an almost isotropic area prestrain on the order of 1.57 [15]. The quantification of isotropic prestrain is thought-provoking: While skin is clearly anisotropic, this do not necessary imply that prestrain has to be anisotropic as well. Human skin in the forearm displayed similar prestrain values in two orthogonal directions [15], while ventral pig skin exhibited marked anisotropic prestrain [24]. Unfortunately, the purely kinematic analysis of our experimental setup fails to shed light on the morphogenetic processes that explain the observed prestrain patterns. However, throughout our expansion protocol, we have also performed biochemical assays including the immunohistochemistry in Fig. 11, which we are currently analyzing with the objective to correlate biochemical and mechanical phenomena and reveal directional information.
Fig. 11.
Representative tissue sections of non-expanded and expanded skin immunostained for Ki-67, a nuclear protein associated with cell proliferation. The control skin patch, left, displays a normal epidermal thickness and a normal number of dividing cells. The expanded skin patch, right, shows an increase in epidermal thickness and an increased number of dividing cells indicating skin growth. In both sections, the dermis displays a diffuse collagen orientation.
By subcutaneously implanting an expander underneath a 10 × 10cm grid and filling it gradually up to 280cc, the overlaying skin is chronically stretched beyond its physiological limit [7]. At the end of five weekly timed inflations, the initial patch is stretched on average by 1.40 × 1.34 parallel and perpendicular to the midline, respectively. It is interesting to highlight the anisotropy of the resulting deformation. Just like most soft biological tissues, skin is known to exhibit anisotropic material properties [28]. In fact, Langer mapped the preferred stiffness directions of skin over the human body more than a century ago [27]. Tension lines in the pig have been characterized in great detail [48]. Uniaxial tension tests of rabbit skin and biaxial testing of porcine skin have initiated the development of microstructurally based anisotropic material constitutive laws [24,53]. It seems reasonable that the anisotropic microstructure of skin induces anisotropic deformation upon pressure-induced expansion with smaller stretches along the skin tension lines [34]. It is noteworthy that our maximum stretch values occur perpendicular to the midline, although on average, the general trend indicates the opposite. To further explore this phenomenon, our current and future efforts aim at tracking the collagen fiber arrangement before, during, and after tissue expansion using high resolution ultrasound and immunohistochemistry. Fig. 11 illustrates our first attempts along these lines, which will eventually allow us to correlate skin growth to cellular and subcellular phenomena including cell proliferation.
At the culmination of the expansion process, on day t = 37, the total deformation is a combination of growth and elastic components. We excise the expanded tissue to quantify the elastic contribution and observe that the average area change is ϑe = 1.20. A square region retracts 0.95 × 0.88 parallel and perpendicular to the midline. This finding is intriguing. From our prestrain quantification, we conclude that if we excise the original in vivo patch before expansion, it shrinks to a square of dimensions 0.83 × 0.83. A possible explanation for the mismatch between elastic deformations before and after expansion is that the morphogenetic processes that result in the stable ϑp = 1.44 area stretch in vivo is different from the equilibrium resulting from tissue expansion. Another plausible hypothesis is that the grown skin has not yet fully recovered its homeostatic equilibrium state. We plan to follow up expanded skin patches for longer time periods to determine the final equilibrium state of the expanded tissue.
Accounting for prestrain and elastic retraction, we calculate the resulting tissue growth. On average, tissue grows by ϑg = 2.25 in area. We find, once more, that skin kinematics are different in the two directions of interest. An ex vivo unit square at day t = 0 transforms into a 1.62 × 1.43 rectangle ex vivo after t = 37 days of expansion. Growth also shows a distinct regional variation. As we would intuitively expect, growth is largest in the center region, which experiences the largest stretch. This supports the hypothesis that overstretch drives skin growth [56]. Several factors can explain the regional variation parallel and perpendicular to the midline. First, we find that while the expansion takes place the skin patch grows naturally in an approximately homogeneous, yet anisotropic manner on average by 1.24 × 1.20 times. From our contour plots we can also observe that the deformation induced by expansion is greater in the parallel direction. Nonetheless, there is still debate whether microstructural cues, such as the arrangement of the collagen architecture, guide anisotropic growth. This question also motivates further experiments.
Our study has a few limitations. We recognize that there is no one-to-one correspondence between the material properties and anatomies of porcine and human integument. Another limitation is that we have only performed this study at a single location in a single porcine model. Nonetheless, we believe that our results provide promising evidence for our experimental design and prompt us to replicate the analysis in a larger group. Towards these efforts, we are currently designing instrumented expanders to measure the expander pressure before and after expansion [41]. This will eventually allow us to characterize the stiffness of living skin stiffness using an inverse finite element approach [40]. The shape of the expander could also bias the resulting deformation contours [6]. We are therefore replicating the experiment on a larger sample set to account for different expander geometries and to demonstrate statistical significance of our results.
Taken together, we presented a highly flexible experimental setting to accurately track surface kinematics using multi-view stereo. Multi-view stereo is a robust, inexpensive, non-invasive technology that can be readily used in plastic and reconstructive surgery, where skin is conveniently exposed to the outside world. Performing numerical analysis within the isogeometric setting resolves rich regional variations, which could ultimately lead to address and propose more fundamental questions. Indeed, in this manuscript we start from a particular medical application, skin expansion, a widely used reconstructive technique. An accurate kinematical characterization of tissue expansion could improve pre-operative planning and optimize treatment options. When combined with histological and biochemical essays at smaller scales, our continuum interpolation of mechanical fields has the potential to uncover mechanotransduction pathways in living skin and inspires us to manipulate biological membranes by mechanical stretch.
Acknowledgements
This work was supported by the CONACyT Fellowship, the Stanford Graduate Fellowship, and the DARE Doctoral Fellowship to Adrian Buganza Tepole and by the National Science Foundation CAREER award CMMI 0952021, by the National Science Foundation INSPIRE grant 1233054, and by the National Institutes of Health grant U01 HL119578 to Ellen Kuhl.
Contributor Information
Adrián Buganza Tepole, Email: abuganza@stanford.edu, Department of Mechanical Engineering, Stanford University Stanford, CA 94305, USA.
Michael Gart, Email: michaelgartMD@gmail.com, Division of Pediatric Plastic Surgery, Lurie Children’s Hospital, Northwestern University Feinberg School of Medicine, Chicago, IL 60611, USA.
Chad A. Purnell, Email: cpurne@gmail.com, Division of Pediatric Plastic Surgery, Lurie Children’s Hospital, Northwestern University Feinberg School of Medicine, Chicago, IL 60611, USA.
Arun K. Gosain, Email: argosain@luriechildrens.org, Division of Pediatric Plastic Surgery, Lurie Children’s Hospital, Northwestern University Feinberg School of Medicine, Chicago, IL 60611, USA.
Ellen Kuhl, Email: ekuhl@stanford.edu, Departments of Mechanical Engineering, Bioengineering, and Cardiothoracic Surgery, Stanford University, Stanford, CA 94305, USA.
References
- 1.Ambrosi D, Ateshian GA, Arruda EM, Cowin SC, Dumais J, Goriely A, Holzapfel GA, Humphrey JD, Kemkemer R, Kuhl E, Olberding JE, Taber LA, Garikipati K. Perspectives on biological growth and remodeling. J Mech Phys Solids. 2014;59:863–883. doi: 10.1016/j.jmps.2010.12.011. [DOI] [PMC free article] [PubMed] [Google Scholar]
- 2.Amini R, Eckert CE, Koomalsingh K, McGarvey J, Minakawa M, Gorman JH, Gorman RC, Sacks MS. On the in vivo deformation of the mitral valve anterior leaflet: Effects of annular geometry and referential configuration. Ann Biomed Eng. 2012;40:1455–1467. doi: 10.1007/s10439-012-0524-5. [DOI] [PMC free article] [PubMed] [Google Scholar]
- 3.Autodesk 123D Catch. Autodesk, Inc.; 2014. http://www.123dapp.com/catch. [Google Scholar]
- 4.Bartell TH, Mustoe TA. Animal models of human tissue expansion. Plast Reconstr Surg. 1989;83:681–686. doi: 10.1097/00006534-198904000-00014. [DOI] [PubMed] [Google Scholar]
- 5.Bhandari PS. Mathematical calculations in a spherical tissue expander. Ann Plast Surg. 2009;62(2):200–204. doi: 10.1097/SAP.0b013e31817fe464. [DOI] [PubMed] [Google Scholar]
- 6.Buganza Tepole A, Ploch CJ, Wong J, Gosain AK, Kuhl E. Growin skin: A computational model for skin expansion in reconstructive surgery. J Mech Phys Solids. 2011;59:2177–2190. doi: 10.1016/j.jmps.2011.05.004. [DOI] [PMC free article] [PubMed] [Google Scholar]
- 7.Buganza Tepole A, Gosain AK, Kuhl E. Stretching skin: The physiological limit and beyond. Int J Nonlin Mech. 2012;47:938–949. doi: 10.1016/j.ijnonlinmec.2011.07.006. [DOI] [PMC free article] [PubMed] [Google Scholar]
- 8.Buganza Tepole A, Gosain AK, Kuhl E. Computational modeling of skin: Using stress profiles as predictor for tissue necrosis in reconstructive surgery. Comp & Struct. 2014;143:32–39. doi: 10.1016/j.compstruc.2014.07.004. [DOI] [PMC free article] [PubMed] [Google Scholar]
- 9.Buganza Tepole A, Gart M, Gosain AK, Kuhl E. Characterization of living skin using multi view stereo and isogeometric analysis. Acta Biomat. 2014;10:4822–4831. doi: 10.1016/j.actbio.2014.06.037. [DOI] [PMC free article] [PubMed] [Google Scholar]
- 10.Buganza Tepole A, Steinberg JP, Kuhl E, Gosain AK. Application of finite element modeling to optimize flap design with tissue expansion. Plast Reconstr Surgery. 2014;134:785–792. doi: 10.1097/PRS.0000000000000553. [DOI] [PMC free article] [PubMed] [Google Scholar]
- 11.Buganza Tepole A, Kabaria H, Bletzinger KU, Kuhl E. Isogeometric Kirchhoff-Love shell formulations for biological membranes. submitted for publication. 2014 doi: 10.1016/j.cma.2015.05.006. [DOI] [PMC free article] [PubMed] [Google Scholar]
- 12.Cyganek B, Siebert JP. An introduction to 3D computer vision techniques and algorithms. West Sussex: John Wiley & Sons Ltd; 2009. [Google Scholar]
- 13.De Filippo RE, Atala A. Stretch and growth: the molecular and physiologic influences of tissue expansion. Plast Reconstr Surg. 2002;109:2450–2462. doi: 10.1097/00006534-200206000-00043. [DOI] [PubMed] [Google Scholar]
- 14.Flynn C, Taberner A, Nielsen P. Modeling the mechanical response of in vivo human skin under a rich set of deformations. Ann Biomed Eng. 2011;39:1935–1946. doi: 10.1007/s10439-011-0292-7. [DOI] [PubMed] [Google Scholar]
- 15.Flynn C, Taberner A, Nielsen P. Mechanical characterisation of in vivo human skin using a 3D force-sensitive micro-robot and finite element analysis. Biomech Model Mechanobiol. 2011;10:27–38. doi: 10.1007/s10237-010-0216-8. [DOI] [PubMed] [Google Scholar]
- 16.Furukawa Y, Ponce J. Accurate, dense, and robust multi view stereopsis. IEEE T Pattern Anal. 2010;32:1362–1376. doi: 10.1109/TPAMI.2009.161. [DOI] [PubMed] [Google Scholar]
- 17.Göktepe S, Bothe W, Kvitting JP, Swanson J, Ingels NB, Miller DC, Kuhl E. Anterior mitral leaflet curvature in the beating ovine heart. A case study using videofluoroscopic markers and subdivision surfaces. Biomech Mod Mechanobio. 2010;9:281–293. doi: 10.1007/s10237-009-0176-z. [DOI] [PubMed] [Google Scholar]
- 18.Göktepe S, Abilez OJ, Parker KK, Kuhl E. A multiscale model for eccentric and concentric cardiac growth through sarcomerogenesis. J Theor Bio. 2010;265:433–442. doi: 10.1016/j.jtbi.2010.04.023. [DOI] [PubMed] [Google Scholar]
- 19.Gosain AK, Santoro TD, Larson DL, Gingrass RP. Giant congenital nevi: A 20-year experience and an algorithm for their management. Plast Reconstr Surg. 2001;108:622–636. doi: 10.1097/00006534-200109010-00004. [DOI] [PubMed] [Google Scholar]
- 20.Hiep V, Keriven P, Labatut P, Pons JP. Towards high-resolution large-scale multi view stereo; IEEE Conference on CVPR; 2009. [Google Scholar]
- 21.Hughes TJR. The finite element method: Linear static and dynamic finite element analysis. Eaglewood Cliffs, NJ: Prentice Hall; 1987. [Google Scholar]
- 22.Hughes TJR, Cottrell JA, Bazilevs Y. Isogeometric analysis: CAD, finite elements, NURBS, exact geometry and mesh refinement. Comp Meth Appl Mech Eng. 2005;194:4135–4195. [Google Scholar]
- 23.Johnson PE, Kernahan DA, Bauer BS. Dermal and epidermal response to soft-tissue expansion in the pig. Plast Reconst Surg. 1988;81:390–395. doi: 10.1097/00006534-198803000-00013. [DOI] [PubMed] [Google Scholar]
- 24.Jor JWY, Nash MP, Nielsen PMF, Hunter PJ. Estimating material parameters of a structurally based constitutive relation for skin mechanics. Biomech Model Mechanobio. 2010;10:767–778. doi: 10.1007/s10237-010-0272-0. [DOI] [PubMed] [Google Scholar]
- 25.Kiendl J, Bletzinger KU, Linhard J, Wüchner R. Isogeometric shell analysis with Kirchhoff-Love elements. Comp Meth Appl Mech Eng. 2009;198:3902–3914. [Google Scholar]
- 26.Kuhl E. Growing matter - A review of growth in living systems. J Mech Behavior Biomed Mat. 2014;29:529–543. doi: 10.1016/j.jmbbm.2013.10.009. [DOI] [PubMed] [Google Scholar]
- 27.Langer K. Zur Anatomie und Physiologie der Haut. I. Über die Spaltbarkeit der Cutis. Sitzungsbericht der mathematisch-naturwissenschaftlichen Classe der Kaiserlichen Academie der Wissenschaften. Abt. 44, 1861. [PubMed] [Google Scholar]
- 28.Lanir Y. Constitutive equations for fibrous connective tissues. J Biomech. 1983;16:1–12. doi: 10.1016/0021-9290(83)90041-6. [DOI] [PubMed] [Google Scholar]
- 29.LoGiudice J, Gosain AK. Pediatric tissue expansion: Indications and complications. J Craniofac Surg. 2003;14:866–872. doi: 10.1097/00001665-200311000-00008. [DOI] [PubMed] [Google Scholar]
- 30.Mahmud J, Holt CA, Evans SL. An innovative application of a small-scale motion analysis technique to quantify human skin deformation in vivo. J Biomech. 2010;43:1002–1006. doi: 10.1016/j.jbiomech.2009.11.009. [DOI] [PubMed] [Google Scholar]
- 31.Manders EK, Schenden MJ, Furrey JA, Hetzler PT, Davis TS, Graham WP. Soft-tissue expansion: concepts and complications. Plast Reconstr Surg. 1984;74:493–507. doi: 10.1097/00006534-198410000-00007. [DOI] [PubMed] [Google Scholar]
- 32.Marcus J, Horan D, Robinson J. Tissue expansion: Past, present and future. J Am Acad Dermatol. 1990;23:813–825. doi: 10.1016/0190-9622(90)70296-t. [DOI] [PubMed] [Google Scholar]
- 33.Menzel A. Modelling of anisotropic growth in biological tissues. Biomech Mod Mechanobio. 2005;3:147–171. doi: 10.1007/s10237-004-0047-6. [DOI] [PubMed] [Google Scholar]
- 34.Menzel A. A fibre reorientation model for orthotropic multiplicative growth. Biomech Mod Mechanobio. 2007;6:303–320. doi: 10.1007/s10237-006-0061-y. [DOI] [PubMed] [Google Scholar]
- 35.Meyer W, Neurand K, Radke B. Elastic fibre arrangement in the skin of the pig. Arch Dermatol Res. 1981;270:391–401. doi: 10.1007/BF00403783. [DOI] [PubMed] [Google Scholar]
- 36.Meyer W, Neurand K, Radke B. Collagen fibre arrangement in the skin of the pig. J Anat. 1982;134:139–148. [PMC free article] [PubMed] [Google Scholar]
- 37.Montagna W, Yun JS. The skin of the domestic pig. J Invest Dermatol. 1964;43:11–21. [PubMed] [Google Scholar]
- 38.Morykwas MJ, Marks MW, Argenta LC. Surface area and tissue volume increases with differential expansion. Ann Plast Surg. 1992;28:311–314. doi: 10.1097/00000637-199204000-00002. [DOI] [PubMed] [Google Scholar]
- 39.Neumann CG. The expansion of an area of skin by progressive distension of a subcutaneous balloon. Plast Reconstr Surg. 1957;19:124–130. doi: 10.1097/00006534-195702000-00004. [DOI] [PubMed] [Google Scholar]
- 40.Pamplona DC, Carvalho CR. Characterization of human skin through skin expansion. J Mech Mat Struct. 2012;7:641–655. [Google Scholar]
- 41.Pamplona DC, Mota DEJS. Numerical and experimental analysis of inflating a circular hyperelastic membrane over a rigid and elastic foundation. Int J Mech Sci. 2012;65:18–23. [Google Scholar]
- 42.Pamplona DC, Velloso RQ, Radwanski HN. On skin expansion. J Mech Beh Biomed Mat. 29:655–662. doi: 10.1016/j.jmbbm.2013.03.023. [DOI] [PubMed] [Google Scholar]
- 43.Piegl L, Tiller W. Curve and surface constructions using rational B-splines. Comput Aided Des. 1987;19:485–498. [Google Scholar]
- 44.Pietramaggiori G, Liu P, Scherer SS, Kaipainen A, Prsa MJ, Mayer H, Newalder J, Alperovich M, Mentzer SJ, Konerding MA, Huang S, Ingber DE, Orgill DP. Tensile forces stimulate vascular remodeling and epidermal cell proliferation in living skin. Ann Surg. 2007;246:896–902. doi: 10.1097/SLA.0b013e3180caa47f. [DOI] [PubMed] [Google Scholar]
- 45.Rausch MK, Kuhl E. On the effect of prestrain and residual stress in thin biological membranes. J Mech Phys Solids. 2013;61:1955–1969. doi: 10.1016/j.jmps.2013.04.005. [DOI] [PMC free article] [PubMed] [Google Scholar]
- 46.Rausch MK, Famaey N, O’Brien Shultz T, Bothe W, Miller DC, Kuhl E. Mechanics of the mitral valve: A critical review, an in vivo parameter identification, and the effect of prestrain. Biomech Mod Mechanobio. 2013;12:1053–1071. doi: 10.1007/s10237-012-0462-z. [DOI] [PMC free article] [PubMed] [Google Scholar]
- 47.Rivera R, LoGiudice J, Gosain AK. Tissue expansion in pediatric patients. Clin Plast Surg. 2005;32:35–44. doi: 10.1016/j.cps.2004.08.001. [DOI] [PubMed] [Google Scholar]
- 48.Rose EH, Ksander GA, Vistnes LM. Skin tension lines in the domestic pig. Plast Reconstr Surg. 1976;57:729–732. doi: 10.1097/00006534-197606000-00008. [DOI] [PubMed] [Google Scholar]
- 49.Seitz SM, Curless B, Diebel J, Scharstein D, Szeliski R. A comparison and evaluation of multi-view stereo reconstruction algorithms. IEEE Conference on Computer Vision and Pattern Recognition. 2006;1:519–528. [Google Scholar]
- 50.Shively RE. Skin expander volume estimator. Plast Reconstr Surg. 1986;77:482–483. doi: 10.1097/00006534-198603000-00031. [DOI] [PubMed] [Google Scholar]
- 51.Silver FH, Siperko LM, Seehra GP. Mechanobiology of force transduction in dermal tissue. Skin Res Tech. 2003;9:3–23. doi: 10.1034/j.1600-0846.2003.00358.x. [DOI] [PubMed] [Google Scholar]
- 52.Taber L. Biomechanics of Growth, Remodeling, and Morphogenesis. Appl Mech Rev. 1995;48:487–545. [Google Scholar]
- 53.Tong P, Fung YC. The stress-strain relationship for the skin. J Biomech. 1976;9:649–657. doi: 10.1016/0021-9290(76)90107-x. [DOI] [PubMed] [Google Scholar]
- 54.Tonge TK, Atlan LS, Voo LM, Nguyen TD. Full-field bulge test for planar anisotropic tissues: Part I-Experimental methods applied to human skin tissue. Acta Biomat. 9:5913–5925. doi: 10.1016/j.actbio.2012.11.035. [DOI] [PubMed] [Google Scholar]
- 55.van Rappard JHA, Molenaar J, van Doorn K, Sonneveld GJ, Borghouts JMHM. Surface-area increase in tissue expansion. Plast Reconstr Surg. 1988;82:833–839. doi: 10.1097/00006534-198811000-00016. [DOI] [PubMed] [Google Scholar]
- 56.Zöllner AM, Buganza Tepole A, Kuhl E. On the biomechanics and mechanobiology of growing skin. J Theor Bio. 2012;297:166–175. doi: 10.1016/j.jtbi.2011.12.022. [DOI] [PMC free article] [PubMed] [Google Scholar]
- 57.Zöllner AM, Buganza Tepole A, Gosain AK, Kuhl E. Growing skin - Tissue expansion in pediatric fore-head reconstruction. Biomech Mod Mechanobio. 2012;11:855–867. doi: 10.1007/s10237-011-0357-4. [DOI] [PMC free article] [PubMed] [Google Scholar]
- 58.Zöllner AM, Holland MA, Honda KS, Gosain AK, Kuhl E. Growth on demand - Reviewing the mechanobiology of stretched skin. J Mech Behav Biomed Mat. 2013;28:495–509. doi: 10.1016/j.jmbbm.2013.03.018. [DOI] [PMC free article] [PubMed] [Google Scholar]


