Background: We investigated how α-catenin transduces force at cell-to-cell adhesions.
Results: Molecular dynamics simulations identified structural features contributing to α-catenin stability and its deformation under applied force.
Conclusion: A cooperative network of salt bridges in α-catenin regulates both α-catenin stability and how it unfolds under force.
Significance: These findings reveal the molecular basis of experimental observations and the impact of reported cancer-linked α-catenin mutants.
Keywords: α-catenin, cell adhesion, mechanotransduction, molecular dynamics, vinculin
Abstract
α-Catenin plays a crucial role in cadherin-mediated adhesion by binding to β-catenin, F-actin, and vinculin, and its dysfunction is linked to a variety of cancers and developmental disorders. As a mechanotransducer in the cadherin complex at intercellular adhesions, mechanical and force-sensing properties of α-catenin are critical to its proper function. Biochemical data suggest that α-catenin adopts an autoinhibitory conformation, in the absence of junctional tension, and biophysical studies have shown that α-catenin is activated in a tension-dependent manner that in turn results in the recruitment of vinculin to strengthen the cadherin complex/F-actin linkage. However, the molecular switch mechanism from autoinhibited to the activated state remains unknown for α-catenin. Here, based on the results of an aggregate of 3 μs of molecular dynamics simulations, we have identified a dynamic salt-bridge network within the core M region of α-catenin that may be the structural determinant of the stability of the autoinhibitory conformation. According to our constant-force steered molecular dynamics simulations, the reorientation of the MII/MIII subdomains under force may constitute an initial step along the transition pathway. The simulations also suggest that the vinculin-binding domain (subdomain MI) is intrinsically much less stable than the other two subdomains in the M region (MII and MIII). Our findings reveal several key insights toward a complete understanding of the multistaged, force-induced conformational transition of α-catenin to the activated conformation.
Introduction
Cell surface adhesion proteins, which form mechanical links to the extracellular matrix and adjacent cells, are potential loci of force transduction across cell membranes. Such mechanotransduction plays a central role in instructing cell functions and regulating tissue genesis and homeostasis (1–4), but the molecular mechanisms at the protein level underlying force transduction are only beginning to be identified. Proteins at focal adhesions, such as talin, vinculin, and Cas120, are postulated to undergo force-dependent conformational changes to activate downstream signaling (3, 5–9). The ability of integrins to sense matrix rigidity is also enhanced by tension-dependent conformation changes in extracellular matrix proteins that activate integrin ligation and signaling (10, 11).
Although not appreciated until recently, adhesive complexes at cell-cell junctions also act as force-sensitive mechanical and signaling hubs. For example, platelet endothelial cell adhesion molecule one (PECAM-1), which is an adhesion protein associated with vascular endothelial cadherin at interendothelial junctions, mediates the transduction of mechanical signals due to fluid shear stress. Fluid shear sensing activates cell alignment under flow (12–14). Although the force transducer at PECAM-1 complexes has not yet been identified, one such element has been identified in cadherin complexes (15–19), which are adhesive junctions that are required for the integrity of intercellular junctions in all tissues. Cadherins are transmembrane proteins that mediate intercellular adhesion, by binding cadherins on adjacent cells. Mechanical and biochemical measurements showed that cadherin complexes transduce intercellular force to alter cytoskeletal organization at stressed cell-cell junctions and trigger changes in cell mechanics, in response to both endogenous and exogenous force (15, 18–22).
The cytosolic protein α-catenin is an identified force-sensitive protein in cadherin complexes and is a postulated force transducer (18, 22). α-Catenin mechanically couples cadherins to F-actin (23). The cytosolic domain of cadherins binds β-catenin, and α-catenin binds both β-catenin and F-actin to mechanically couple cadherins to the cytoskeleton (24–26). Studies have shown that α-catenin is crucial for cadherin-mediated intercellular adhesion, and its dysfunction is linked to a variety of cancers and developmental disorders (27–29).
As a force transducer in the mechanical chain between cadherins and the cytoskeleton, α-catenin is postulated to adopt an autoinhibited conformation in the absence of junctional tension, but mechanical stress alters the conformation to expose a cryptic binding site for the actin-binding protein, vinculin (18, 30). At cadherin complexes, vinculin is an α-catenin effector that binds the exposed vinculin-binding site (VBS)3 in the force-activated α-catenin conformation (15, 19, 20, 30–32). Vinculin in turn recruits signaling proteins that locally activate actin polymerization and reinforce cadherin adhesion under tension (33). The molecular basis of this conformational switch and the structural features and interactions that tune its force response are crucial for understanding the role of α-catenin in tissue morphogenesis and human disease.
In a proposed force transduction mechanism, under low tension, an inhibitory domain was suggested to bind and encrypt the VBS of α-catenin, but force would disrupt this interaction to expose the VBS (18). α-Catenin is structurally homologous to vinculin, which is autoinhibited by a high affinity interaction between head and tail domains (34). The latter interaction simultaneously encrypts a C-terminal actin-binding site and an N-terminal domain that binds α-catenin and other proteins in the cell (34). In contrast to vinculin, crystal structures of α-catenin did not reveal a similar head-tail, autoinhibited conformation (35–39).
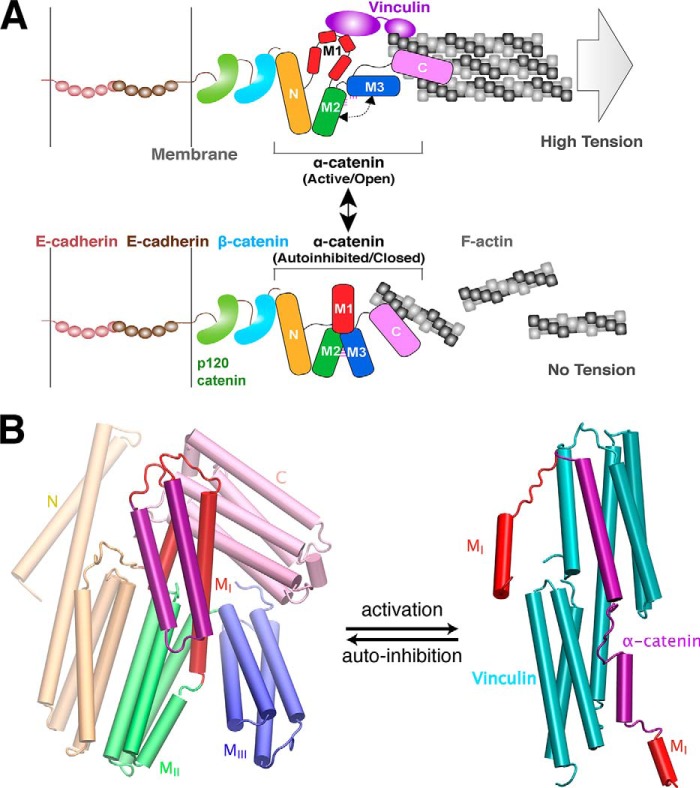
The structure of α-catenin comprises five 4-helix bundles and a C-terminal 5-helix bundle (Fig. 1), similar to vinculin. The five 4-helix bundles can be divided into an N-terminal (N) domain with two 4-helix bundles and a modulatory M region (with three 4-helix bundles designated as MI–MIII subdomains) that regulate cell adhesion and embed the VBS and a putative inhibitory region (Fig. 1). MI–MIII subdomains appear to be stabilized by several salt bridges (35, 38, 40). Unlike vinculin, the N- and C-terminal domains do not bind each other or modulate their respective functions (39). Instead, in the cell, the N- and C-terminal domains of α-catenin bind to β-catenin and to F-actin, respectively (Fig. 2A), and these connections mechanically couple cadherin to the actin cytoskeleton (17, 23, 25). This difference suggests that the activation mechanisms of vinculin and α-catenin also differ. In the structure of the complex between vinculin and α-catenin (Fig. 2B), the MI subdomain is unfurled to expose the VBS, which in turn binds an α-helical domain in vinculin (40, 41).
FIGURE 1.
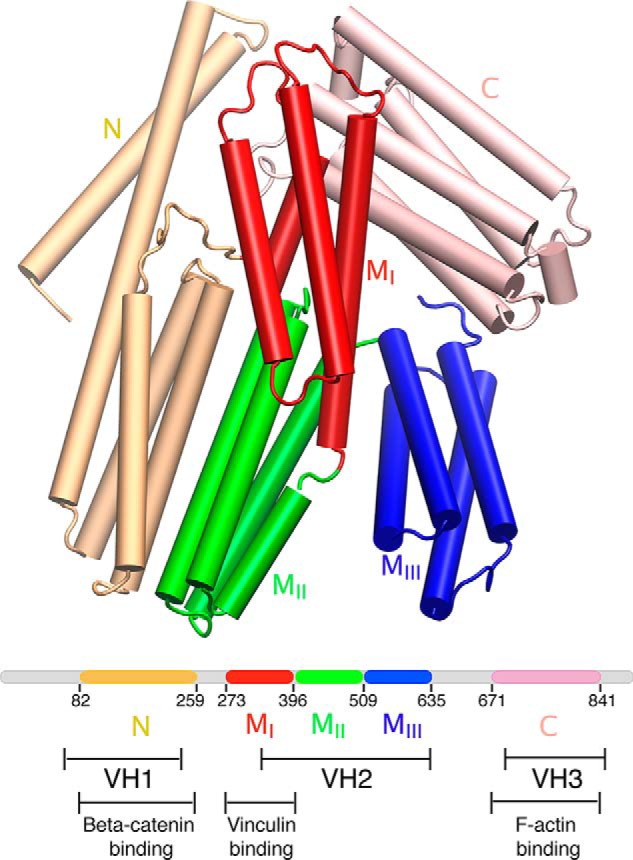
Structural arrangement of α-catenin. α-Catenin comprises five helical domains: N (wheat), MI (red), MII (green), MIII (blue), and C (pink) domains. According to the similarity with vinculin, α-catenin is also divided into three vinculin homology (VH) regions as follows: VH1, VH2, and VH3 (36). MI, MII, and MIII domains collectively are referred to as the M region in this study.
FIGURE 2.
Conformational switching model of α-catenin between two known functional states. A, model of α-catenin-dependent interactions between the cadherin-catenin complex and F-actin. As a multidomain protein, α-catenin physically links the cadherin-catenin complex to actin filaments (F-actin) through the N-terminal β-catenin-binding (N) domain and the C-terminal F-actin-binding (C) domain. Top, α-catenin adopts an active, open conformation and binds to vinculin (purple) when the pulling force generated by trans-dimerization of E-cadherin and actomyosin-mediated high tension. Bottom, α-catenin adopts an autoinhibited conformation when it experiences little to no tension. The central modulatory domain, M fragment, is autoinhibited from interacting with various binding partners, such as the F-actin-binding protein vinculin. B, conformational change of vinculin-binding domain (MI, show in red and purple) in α-catenin between two structurally known states as follows: closed (autoinhibited) state (left, PDB code 4IGG) (35) and open (activated) state (right, PDB code 4EHP) (40) upon vinculin binding. Vinculin is shown in cyan in the complex (right).
The mechanism of force-activated α-catenin unfolding, the identity of load-bearing side chain interactions, the structural basis of the force sensitivity of α-catenin, and the impact of disease-linked mutations on its structural stability have yet to be established. Recent single protein unfolding studies reported the forced unfolding of MI–MIII when stretched along the N-to-C-terminal axis (42). The protein appeared to unfold in three sequential steps in which an initial unfolding event at ∼5 pN appeared to expose the VBS in MI, while retaining the structures of MII and MIII. However, the structural bases of these force signatures and the interactions that determine the force threshold for unfurling remain to be determined.
In this study, we report the results of an aggregate of 3 μs of molecular dynamics (MD) simulations performed to investigate structural determinants of the mechanical properties of α-catenin. We focus on the core MI–MIII fragment in these simulations because its stability in the simulations was unaffected by the N domain. Additionally, the C-terminal region, although structured, is highly mobile due to a flexible linker between the M region and the C-terminal domain (38). Equilibrium simulations of the M region (MI–MIII), as well as its individual domains, reveal a dynamic network of intramolecular salt bridges that contributes to both the thermodynamic (equilibrium) and mechanical stability of the structure. Investigations of point mutations provided further insights into experimental observations of α-catenin function, as well as the potential role of point mutations in cancer. Steered MD (SMD) simulations performed at either a constant loading force or a constant loading velocity identified structural changes that occur in response to applied force and intramolecular interactions underlying the mechanical stability of the M region. The results are qualitatively consistent with recent single molecule unfolding studies and reveal structural changes potentially underlying single molecule force-extension signatures. These findings are also discussed in the context of functional and developmental perturbations induced by α-catenin point mutations.
Experimental Procedures
Model Building
The simulations were based on the published structure of α-catenin (chain A), which was obtained from the RCSB Protein Data Bank (PDB code 4IGG) (35). The simulations were performed with the monomer, which was extracted from the structure of the asymmetric dimer (35). The titration states of ionizable residues (aspartate, glutamate, lysine, arginine, histidine, and tyrosine) were assigned based on pKa calculations performed using H++, a web server for estimating pKa values and adding missing hydrogens to macromolecules (43). This resulted in a model in which all residues had their default titration states. The peptide bond between Gly-274 and Gly-275 was adjusted, by changing it from the cis to trans configuration, by using the cis peptide plugins of VMD (44). The system was then solvated in a box of water using the program SOLVATE (45), with at least 15 Å between the protein and the boundary of the box. Then 150 mm NaCl was added to neutralize the net charge of the system, using the autoionize plugin of VMD (46).
Simulation Protocol
All the simulations were performed using NAMD2 (47), the CHARMM27 force field (48) for proteins and ions (49), and the TIP3P model for explicit water (50). All the simulations were performed using periodic boundary conditions and a time step of 2 fs. Throughout the simulations, bond distances involving hydrogen atoms were fixed using the SHAKE algorithm (51).
After an initial 10,000 steps of energy minimization with all Cα atoms fixed, the system was equilibrated in an NVT (constant number, volume, and temperature) ensemble at 310 K for 500 ps, during which all protein Cα atoms were constrained (k = 1 kcal/mol/Å2) to allow for relaxation of the side chains and water. All the following equilibrium simulations were performed in an NVT ensemble. Table 1 summarizes the equilibrium simulations of different α-catenin constructs performed in this study, along with the number of replicates and the time for each simulation system. For cases where multiple trajectories were generated, only a representative one has been described under “Results” and figures.
TABLE 1.
Equilibrium simulations for protein constructs of α-catenin
| Constructs (residues) | Domains | Mutation | Simulation time | Repeats | Trajectory ID |
|---|---|---|---|---|---|
| ns | |||||
| 82–635 | N-Ma | 50 | 1 | 1 | |
| 273–635 | M | 100 | 3 | 2–4 | |
| 273–635 | M | E521A | 100 | 1 | 5 |
| 273–635 | M | R540H | 100 | 1 | 6 |
| 273–635 | M | R551A | 100 | 1 | 7 |
| 273–509 | MI--MII | 100 | 1 | 8 | |
| 377–635 | MII--MIII | 100 | 1 | 9 | |
| 385–635 | MII--MIII | 100 | 1 | 10 | |
| 397–635 | MII--MIII | 100 | 1 | 11 | |
| 273–396 | MI | 100 | 3 | 12–14 | |
| 397–509 | MII | 100 | 2 | 15–16 | |
| 510–635 | MIII | 100 | 2 | 17–18 | |
| 273–396 | MI | M371W | 100 | 1 | 19 |
a M represents the whole M fragment, including the three subdomains MI, MII, and MIII.
In SMD simulations of forced unfolding of the α-catenin constructs, two distinct pulling protocols were used as follows: constant velocity SMD (cv-SMD) and constant force SMD (cf-SMD) (52, 53). Table 2 summarizes the SMD simulations performed on different α-catenin constructs. For most of the SMD simulations reported here, the pulling force was applied to the Cα atoms of the N-terminal residue. For the construct N-M (residues 82–635), at a constant pulling velocity of 5 Å/ns, the steadily rising force was applied to the center of mass of the Cα atoms of the first two helices of the N-terminal domain (residues 82–146), to maintain the secondary structure of the β-catenin-binding site, which forms a high affinity complex with β-catenin at the membrane (39). The Cα atom of Pro-635 at the C terminus was fixed, in order to prevent the overall translation of the system in response to the applied external force. The force was directed along the x axis between the two anchoring points and was defined as positive when pulling toward the N-terminal domain of the protein. A force constant of k = 1 kcal/mol/Å2 was used for the cv-SMD simulations.
TABLE 2.
Steered MD simulations for protein constructs in α-catenin
| Constructs (residues) | Domains | Mutation | Type | Velocity/force | Repeats | Trajectory ID |
|---|---|---|---|---|---|---|
| 82–635 | N-M | cv-SMD | 10 Å/ns | 2 | 20–21 | |
| 82–635 | N-M | cv-SMD | 5 Å/ns | 1 | 22 | |
| 273–635 | M | cv-SMD | 10 Å/ns | 4 | 23–26 | |
| 273–635 | M | cv-SMD | 2 Å/ns | 2 | 27–28 | |
| 273–635 | M | cf-SMD | 100 pN | 2 | 29–30 | |
| 273–396 | MI | cf-SMD | 100 pN | 2 | 31–32 | |
| 273–396 | MI | M371W | cf-SMD | 100 pN | 1 | 33 |
For all of the simulations, a constant temperature was maintained using Langevin dynamics with a damping coefficient γ of 0.5 ps−1 (54, 55). Short range, nonbonded interactions were calculated using a cutoff distance of 12 Å, and long range electrostatic forces were described with the particle mesh Ewald (PME) method (56).
Results and Discussion
N-terminal Domain Does Not Contribute Directly to Autoinhibition
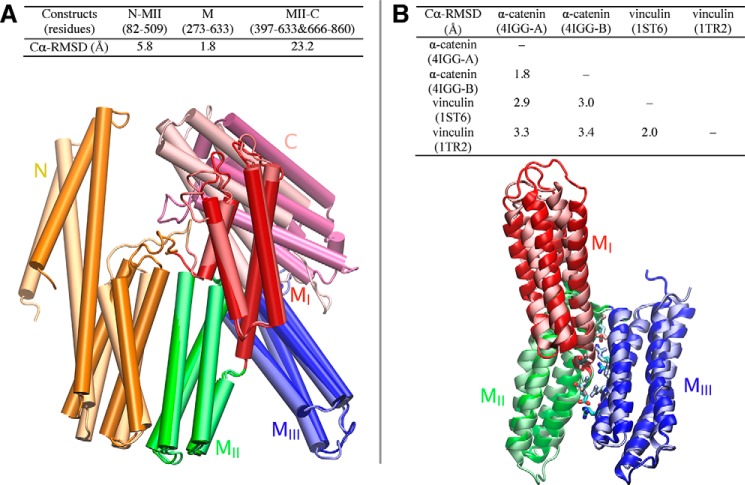
The C-terminal F-actin-binding domain adopts two distinct conformations relative to the M region (MI, MII, and MIII subdomains) and the N domain, in chains A and B of the crystal structure (PDB code 4IGG) (35) of the asymmetric α-catenin dimer (Fig. 3A). The contacts between the C-terminal domain and the M region also differ in these subunits. In contrast, the orientations of the M region relative to the N domain are almost identical in chains A and B, and the conformations of the M region are also very similar to each other within the two chains (Fig. 3A). Considering the long, unstructured linker between the M region and the C-terminal domain in the crystal structure, the C-terminal region is expected to be very flexible. No specific strong interactions with the M region can be discerned that would restrain the C-terminal domain. Because of the evident decoupling of this domain from the M region, we chose not to include the C-terminal domain in the simulations, to be able to perform better sampling enabled by a smaller system size.
FIGURE 3.
Structural comparisons between α-catenin monomers and vinculin. A, conformation differences between chain A and B in the crystal structure (PDB code 4IGG) of full-length α-catenin. Superimposition of chain A and B (bottom) shows the conformational differences of five domains. B, structural comparisons among M fragments (VH2) of α-catenin and homologous domains in vinculin. Top, r.m.s.d. between α-catenin and vinculin are measured by STAMP structural alignment. Bottom, superimposition of M fragment of α-catenin (PDB code 4IGG, chain) and homologous domains in vinculin (PDB code 1ST6) show their structural similarity. Several conserved inter-domain salt bridges in both α-catenin and vinculin are shown as sticks.
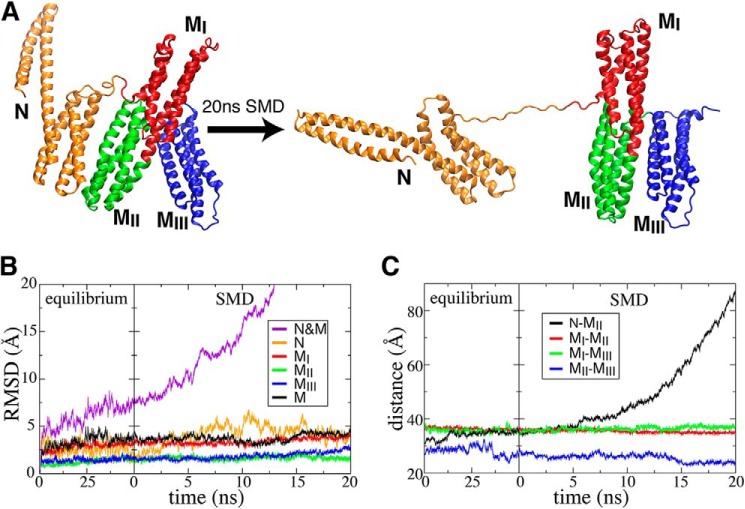
Additionally, our simulations of the α-catenin construct N-M suggested that the N domain does not affect the stability of the autoinhibited M region directly. We first performed a 50-ns equilibrium simulation (trajectory 1), to probe the effect of the N domain on conformational dynamics of the MI–MIII subdomains (Fig. 4). No stable contacts between the N domain and any of the MI–MIII subdomains were observed during this equilibrium simulation. Moreover, the significantly increased backbone root mean square deviations(s) (r.m.s.d.) of the whole construct (N-M) compared with the relatively steady backbone r.m.s.d. of individual domains during the 50-ns simulation (Fig. 4B) also suggests the absence of conformational coupling between the N domain and the MI–MIII subdomains.
FIGURE 4.
Structural response of protein construct N-M (residues 82–635) to mechanical force. A, initial and final snapshots of a 20-ns SMD simulation (trajectory 1). Evolution of the backbone r.m.s.d. (B) and centers of mass distances between pairwise domains (C) are shown as a function of time during the initial 50-ns equilibrium (trajectory 1) and the following SMD simulation (trajectory 22).
We next carried out cv-SMD simulations to study the unfolding pathway and mechanism of the α-catenin construct N-M under the influence of external force. During this 20-ns cv-SMD simulation (trajectory 22), the N domain separated rapidly from the MII subdomain (Fig. 4A), when subjected to a steadily increasing force. The unstructured linker between the N domain and the M region was also extended. This extension dominates both the increase in the backbone r.m.s.d. of the entire protein (Fig. 4B) and the increase in N-MII distance (Fig. 4C). At the same time, the backbone r.m.s.d. of individual domains (Fig. 4B), as well as inter-domain (center of mass) distances (Fig. 4C), indicates that the M region (MI–MIII subdomains) maintains its internal structure as the N domain pulled away from the MII subdomain (Fig. 4A). Structural examination of trajectories from both equilibrium and cv-SMD simulations suggests that encryption of the VBS is maintained primarily by interactions within the M region, i.e. it is not strongly influenced by interactions with either the N- or C-terminal domains.
Our simulations and analyses based on the crystal structure (PDB code 4GG) suggested that both of the linkers between the M fragment and either the N or C domains are long and flexible. There is no structural or biochemical evidence that (prior to the forced exposure of the vinculin site) α-catenin is pulled by any other proteins acting at a different site. Hence, the most likely in vivo scenario, given the current biochemical and structural data, is that force is applied end-to-end across the M fragment through these flexible linkers, as in the simulations (Fig. 4A). Therefore, subsequent investigations of the structural elements determining the stability of the autoinhibited conformation focused on the central M region.
The C-terminal domain is known to be required for actin anchorage and force transmission across the protein (24, 26, 57). In experiments, C-terminal domain deletion prevented α-catenin localization at the membrane (24, 26, 57). This result suggested cooperativity between the N- and C-terminal domains, but recent findings do not support this interpretation (39). The origin of the influence of the C-terminal domain is unknown. Because of the unstructured linker region, neither these present simulations nor the crystal structures resolved this question (35, 38).
Autoinhibited Conformation Is Stabilized by a Salt-bridge Network within the MI–MIII Region
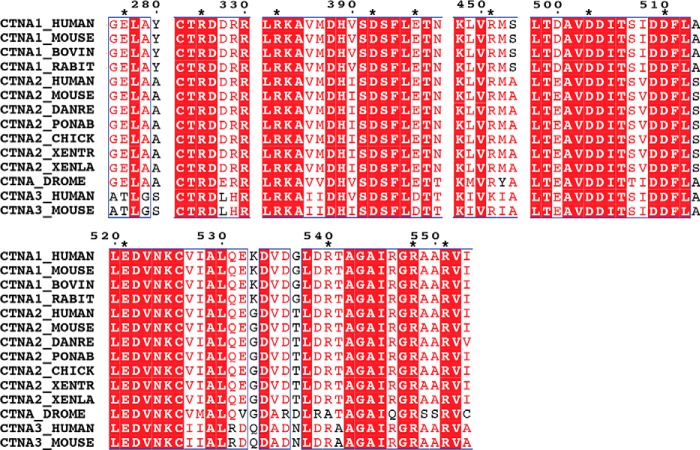
The equilibrium simulations of the M region (trajectories 2–4) reveal that six salt bridges within this region together form a dynamic, highly cooperative inter-domain network, which plays a key role in stabilizing the M region and its autoinhibited conformation. Five of these salt bridges are seen in the published crystal structures (Fig. 5A) (35, 38), and most of them are highly conserved in the α-catenin family (Fig. 6). In the simulations, salt bridges were considered to exist/form, if the distance between any of the side chain oxygen atoms of the acidic residue and the side chain nitrogen atoms of the basic residue was within the cutoff distance of 4 Å (58). Most of these interactions persist in our equilibrium MD simulations of the M region (residues 273–635) (Table 3). In addition to these five salt bridges (Fig. 5A), we observed the formation of another salt bridge (Glu-396–Arg-540) during the simulations (Fig. 5B). These six salt bridges break and reform with localized breathing motions of the M region that are apparent from the time evolution of the distances between the pairs of residues (Fig. 7).
FIGURE 5.
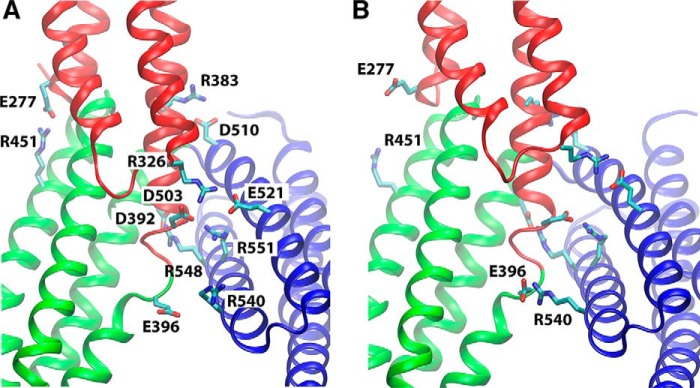
Inter-domain salt-bridge network in the core M region. Salt bridges between M subdomains are shown for the crystal structure (PDB code 4IGG) (35) (A) and for a representative snapshot taken from the equilibrium simulation (trajectory 2) where the newly formed Glu-396–Arg-540 salt bridge is highlighted (B).
FIGURE 6.
Sequence alignment of α-catenin family for the motifs relevant to the salt-bridge network. Sequences are obtained from the Universal Protein Resource. The stars indicate the charged residues constituting the salt-bridge network.
TABLE 3.
Inter-domain salt-bridge dynamics in α-catenin
Distance and probability for inter-domain salt bridges derived from the equilibrium simulation (trajectory 2) are shown and compared with the values observed in the crystal structure (PDB code 4IGG).
| Salt-bridges | Asp-503–Arg-551 | Arg-383–Asp-510 | Asp-392–Arg-548 | Glu-396-Arg-540 | Arg-326–Glu-521 | Glu-277–Arg-451 |
|---|---|---|---|---|---|---|
| Location | MII-MIII | MI-MIII | MI-MIII | MII-MIII | MI-MIII | MI-MII |
| Distance (Å) (PDB code 4IGG) | 2.7 | 3.4 | 3.4 | 10.9 | 2.9 | 2.8 |
| Distance (Å) (100 ns) | 4.0 ± 0.7 | 4.1 ± 1.3 | 3.9 ± 0.4 | 4.4 ± 2.4 | 3.5 ± 0.6 | 8.5 ± 3.0 |
| Probability (%)a | 47.53 | 75.66 | 44.18 | 80.56 | 93.69 | 17.52 |
a For calculating probability, a salt bridge is considered to exist if the distance between any of the side chain oxygen atoms of the acidic residue and any of the side chain nitrogen atoms of the basic residue is within the cutoff distance of 4 Å.
FIGURE 7.
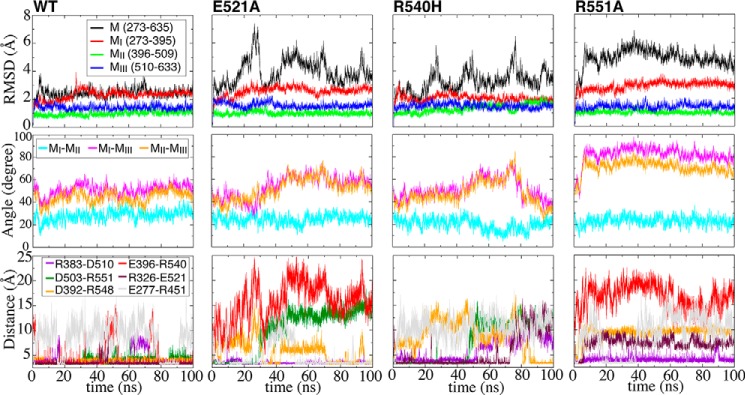
Cooperative salt-bridge network to stabilize the core M region. Evolution of backbone r.m.s.d. (top), inter-domain angles (middle), and salt-bridge distances (bottom) as a function of time during equilibrium simulations of wild type α-catenin (trajectory 2) and three mutants (trajectories 5–7). Inter-domain angle is measured as the angle between the principal axes of pairwise domains.
The salt bridge probability was also calculated, based on the same 4-Å distance criterion described above, to assess the stability of individual salt bridges. It is noteworthy that some salt bridges (Glu-277–Arg-451, Asp-392–Arg-548, and Asp-503–Arg-551), which are all present in the crystal structure, were observed in less than half of the frames (p < 50%) during the equilibrium simulation of the wild type M region. In contrast, Glu-396–Arg-540, a newly formed salt bridge (not present in the crystal structure), is observed in about 80% of the configurations in the same simulation (Table 3), indicating its higher stability when compared with the other salt bridges.
The salt bridges are clearly dynamic and form and break frequently during the simulations, as evident from the absence of any salt bridges with a probability greater than 95% (Table 3). Also, at no time during the simulation did all of the salt bridges break simultaneously (Fig. 7). These simulations therefore suggest that the stability of the entire M region is maintained by a dynamic electrostatic network, in which multiple salt bridges are always present, despite frequent bond fluctuations. The results also suggest that no specific salt bridge alone determines the stability of the M region, but instead several salt bridges form a dynamic, cooperative network to accomplish the task.
Comparative simulations performed on specific charge mutations further highlight the importance of the identified salt-bridge network cooperativity in stabilizing the M region. Equilibrium simulations of three mutants (trajectories 5–7) targeting some of these salt bridges (E521A, R540H, and R551A) were performed for 100 ns and compared with the wild type (trajectory 2) of the M region (construct comprising MI–MIII subdomains) (Fig. 7). Each of these mutations disrupts only one of the salt bridges in the network, and none of them induces a conformational transition to the active state. Compared with the stable wild type M region, all of the mutants exhibit greater conformational fluctuations, and in some cases they even undergo structural rearrangements (e.g. in R551A). The backbone r.m.s.d., inter-domain angles, and salt bridge distances (Fig. 7) highlight the consistent differences between the conformational dynamics of the wild type M region versus the salt-bridge mutants.
Consistent with our findings, two of these mutants, R551A and E521A, significantly increase binding between α-catenin and vinculin, in in vitro pulldown assays (38). Also of interest, four missense mutations have been identified in the salt-bridge network (namely R383H, R540H, R551Q, and D503N), whereas Glu-277 and Arg-451 are targeted by nonsense mutations in various epithelial cancers (59, 60). The latter findings confirm the importance of these salt bridges for α-catenin function. Moreover, experimental data and our results together suggest that mutations within these salt bridges may also tune the force sensitivity or mechanical stiffness of α-catenin.
Our findings are also in line with the experimental results obtained with the truncated 1–509 construct, which exhibited increased, force-independent vinculin recruitment to intercellular junctions (18). The 1–509 fragment eliminates all of the charged groups that complement the six key charged residues from Glu-277 to Asp-503. The simulations predict that this truncation would destabilize the tertiary structure of the M region and the individual helix bundles and would, in turn, increase the exposure of the VBS, as reported experimentally (38).
Similarities between the M region of α-catenin and the homologous region in vinculin (Fig. 3B) reinforce the importance of salt bridges in maintaining the tertiary structure of the MI–MIII core in both proteins. Several of the inter-domain salt bridges within the M region are conserved in the vinculin counterparts. Despite differences in the N- and C-terminal domains, the arrangement of the MI–MIII subdomains in both α-catenin structures (PDB codes 4IGG and 4KIN) (35, 38) is also very similar to the homologous domains in vinculin (PDB codes 1ST6 and 1TR2) (Fig. 3B) (61, 62). Despite similarities in the M region structures, the autoinhibition mechanisms of α-catenin and vinculin differ substantially, and this difference may reflect the different functional roles of autoinhibition (and its reversal) for each protein. Vinculin activity is controlled by a high affinity interaction between the head and tail domains (34). Its activation and recruitment to force-activated talin (and likely to α-catenin) involve phosphorylation and allosteric interactions with cytosolic binding partners (34, 61, 63, 64). Conversely, recent experimental data demonstrated that force directly activates α-catenin (30, 42), and the present simulations suggest that this occurs by a process involving salt-bridge disruption within the M region. Despite sharing a core structural motif, these proteins differ in their activation mechanisms, functional binding partners, and roles in force transduction.
The simulation results presented here reveal that a cluster of salt bridges in the modulatory M region of α-catenin forms a cooperative network directly involved in the structural stability and mechanical properties of the M region. This cooperative network is highly dynamic, with individual bonds exhibiting a formation probability of less than 95%. Importantly, the encryption of the VBS and stability of the inactive conformer are independent of the N- and C-terminal helix bundles. These findings suggest that inter-domain salt-bridge rupture would determine the force required to activate α-catenin and that this ionic network, rather than intra-domain contacts in MI, would tune the force-sensitivity of this protein.
Salt-bridge Network Controls the Relative Orientation of MII and MIII
Crystal structures of α-catenin (PDB codes 1H6G, 1L7C, and 4IGG) (35, 36, 66) contain different lengths of a flexible MI–MII linker with substantial conformational variability (35, 38, 67). MD simulations of three different constructs of the MII and MIII subdomains (trajectories 9–11) with different lengths of the MI–MII linker (namely the 377–635, 385–635, and 397–635 constructs) suggest that the linker might govern the relative orientation of these subdomains.
We monitored the MII/MIII inter-domain angles as a function of time during equilibrium simulations (trajectories 9–11) of construct MII-MIII (Fig. 8, B–D). Increasing the number of residues from the MI–MII linker (amino acids 377–396) retained in the fragment also increased the number of salt bridges, which in turn increased the fragment stability. Eliminating the salt bridges Arg-383–Asp-, Asp-392–Arg-548, and Glu-396–Arg-540 increased the variability of the angle between MII and MIII (Fig. 8, D and F). These results suggest that variations in the salt-bridge network, as a result of the change in the linker length, may contribute to the divergent structures observed crystallographically for the MII-MIII fragment (PDB codes 1H6G, 1L7C, and 4IGG) (Fig. 8E) (35, 36, 66).
FIGURE 8.
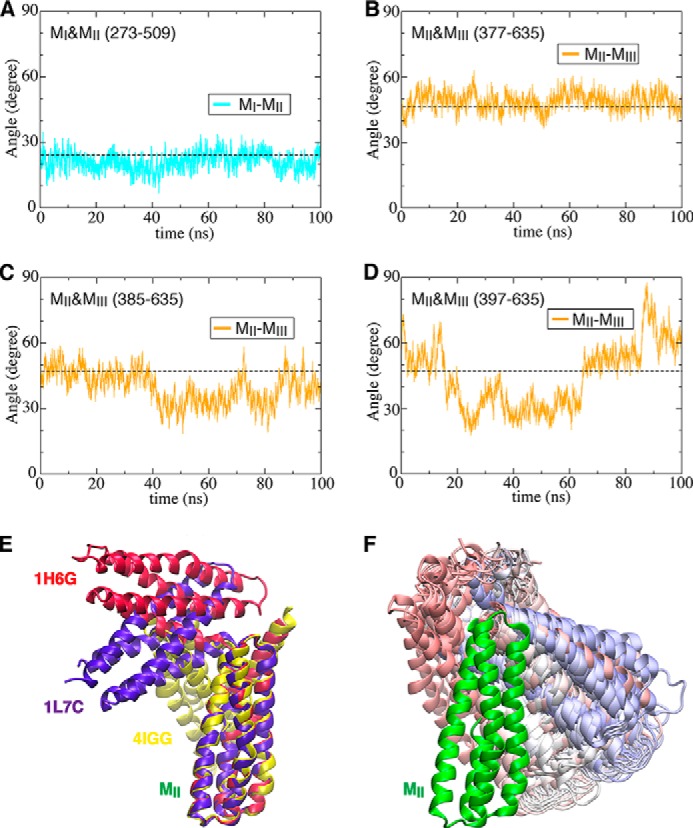
Variability of the angle between MII and MIII influenced by MI–MII linker length. Evolution of inter-domain angles as a function of time during equilibrium simulations is shown for MI and MII (A) (trajectory 8) or for MII and MIII (B–D) (trajectories 9–11). E, three crystallographic structures available for the MII and MIII subdomains of α-catenin, superimposed on the MII subdomain. F, 100 snapshots (colored from red to blue as a function of time) of the MIII subdomain taken from the equilibrium simulation (protein construct (397–635), trajectories 11) superimposed on the MII subdomain.
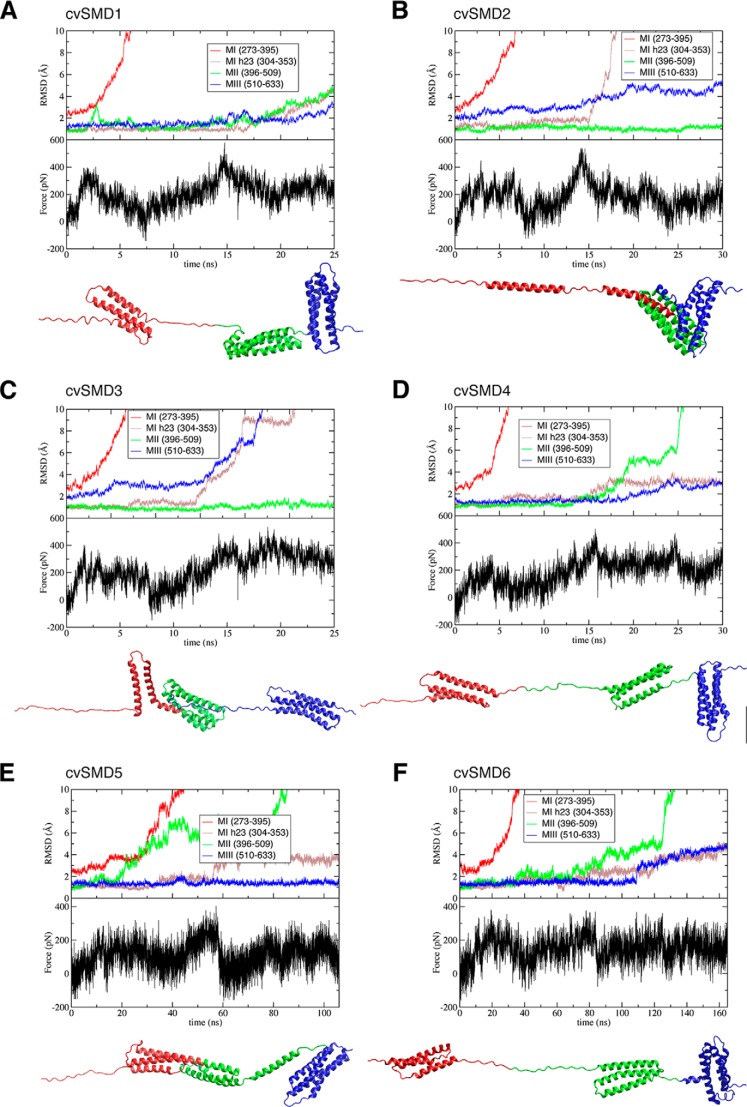
The rearrangement of the MII and MIII subdomains may also contribute to the release of the autoinhibited conformation and exposure of the VBS. In our SMD simulations of the M region, we investigated the conformational change preceding the forced exposure of the VBS. In multiple cv-SMD simulations performed at pulling velocities of 2–10 Å/ns (trajectories 23–28), the protein did not unfold along any consistent pathway or exhibit common intermediates. This variability is apparent in the calculated r.m.s.d. of each domain (Fig. 9). The variability may be due to the high pulling forces used (peaking at 200–500 pN in the cv-SMD simulations; Fig. 9), which might obscure pathways occurring at physiological forces. This could be compounded by the salt bridge cooperativity in which the stochastic fluctuations of any of the six salt bridges could trigger unfolding along different pathways.
FIGURE 9.
Inconsistency of conformational changes during cv-SMD simulations for the MI–MIII fragment. Six cv-SMD simulations were performed at different velocities: cv-SMD1, cv-SMD2, cv-SMD3, and cv-SMD4 were pulled with a constant velocity of 10 Å/ns, although the velocity in cv-SMD5 and cv-SMD6 is 2 Å/ns. Backbone r.m.s.d. of each domain, and the vinculin-binding site (the 2nd and 3rd α-helices (MI h23)), are measured to show different patterns of conformational changes. The force-time profile and final conformation are shown for each cv-SMD.
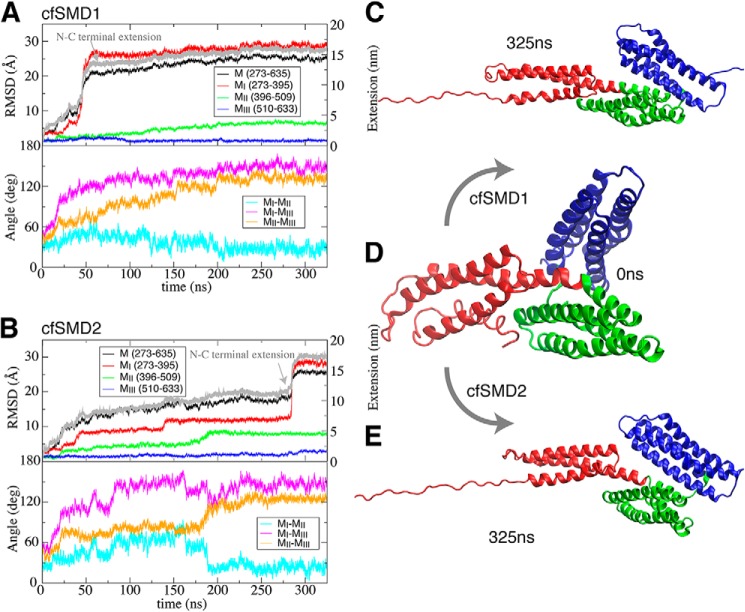
Alternatively, we conducted cf-SMD simulations of the M region at a constant force of 100 pN, which is smaller than the range of the forces applied in cv-SMD simulations (200–500 pN). Two separate cf-SMD trajectories (trajectories 29,30) identified consistently an intermediate in which the MII and MIII subdomains exhibit a change in their relative orientation by ∼80° (Fig. 10). This conformational change followed the rupture of several of the salt bridges described above, in response to the pulling force. At the same time, several new salt bridges formed at the MII9-MIII interface (Fig. 11), after the MIII domain rotation: namely Arg-540 establishes salt bridges with both Asp-392 and Glu-396, Arg-546 interacts with Glu-406, and Arg-551 interacts with Asp-485 (Fig. 11B). The contacts are not identical in the two cf-SMD simulations (see Fig. 11), but the slight differences highlight the likely plasticity of this interface and the cooperativity of the salt-bridge network. Both features could contribute to variability in the precise atomic details of the unbinding trajectories. The overall change, however, may reflect the initial phase of a dominant unfolding pathway, which could have a lower activation barrier at smaller forces than those observed in the cv-SMD simulations.
FIGURE 10.
MII/MIII reorientation in response to mechanical force. Two separate cf-SMD simulations (trajectories 29 and 30) for the MI–MIII fragment (A and B) started from the same initial conformation (D) and converged to similar conformations (C and E) after 325 ns, which may represent an important intermediate. Evolution of the backbone r.m.s.d. of the MI–MIII fragment and each domain, extension change of N- and C-terminal of M region, and relative angles of pairwise domains are measured during 325-ns cf-SMD simulations (A and B). The constant force in both simulations is 100 pN.
FIGURE 11.
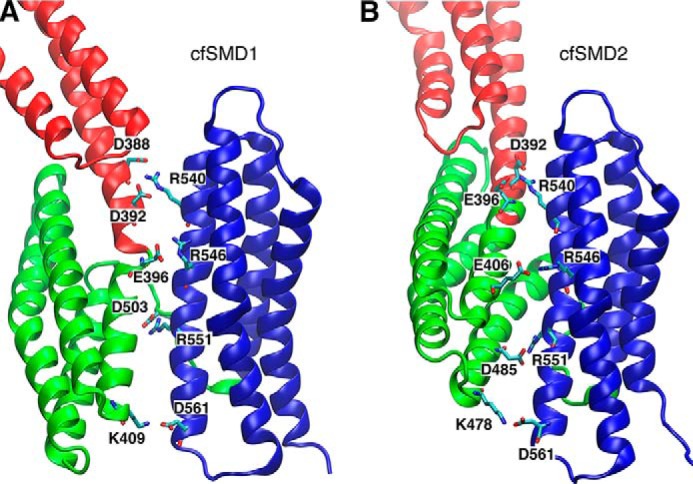
Inter-domain salt bridges between MII and MIII subdomains after the MII/MIII reorientation during the cf-SMD simulations (trajectories 29 and 30). Salt bridges are shown in the last conformation after 325-ns cf-SMD simulations, cf-SMD1 (A) and cf-SMD2 (B). The second helix in the MIII subdomain is a conserved site with several charged residues (Arg-540, Arg-546, Arg-551, and Asp-561), which form salt bridges with the MII subdomain.
MII and MIII also exhibited a clear reorientation during the equilibrium simulation of the R551A mutant (trajectories 7), although the change in the relative orientation was only ∼30° (Fig. 7). Interestingly, pulldown assays have shown that the R551A mutant binds vinculin with higher affinity than E521A (38). Consistent with this picture, during the equilibrium simulations, the E521A mutant (trajectory 5) underwent a much smaller MII/MIII reorientation (by only ∼10°; Fig. 7). Thus, both cf-SMD simulations of the M region (trajectories 29 and 30) as well as the equilibrium simulations of the mutants (trajectories 5 and 7) consistently suggest that the relative MII/MIII reorientation might be an important step in the mechanical activation of α-catenin. Notably, this was the only configuration observed consistently in unfolding simulations at constant force (100 pN).
In the cf-SMD simulations (trajectories 29 and 30) of the M region, the MII/MIII reorientation occurs after the breakage of the initial salt bridges. Two crystal structures (PDB codes 1H6G and 1L7C) exhibit orientation variability, but they differ from the intermediate structure captured in these simulations. Moreover, new salt bridges formed between MII and MIII in the cf-SMD simulations, but these subdomains are well separated in the crystal structures (35, 37, 38). The differences may be due to the partial truncation of some salt bridges in the proteolytic fragment that stabilize the initial compact structure. Missing contacts in the latter structure or influences of the crystallization conditions may explain the differences in MII and MIII orientations in crystals.
The force-induced reorientation of MII and MIII, which was reproducibly observed in multiple simulations, may constitute an initial step during the activation process. However, the inability to obtain reproducible and complete unfolding trajectories depicting a dominant unfolding pathway, even at relatively slow pulling speeds, may also be a consequence of the dynamic salt-bridge network. Cooperativity and frequent bond fluctuations suggest a rugged, shallow energy landscape in which unfolding trajectories may be determined by the stochastic break of salt bridges with similar energies and hence similar rupture probability. A dominant pathway may emerge at slower pulling speeds and longer simulation times or in simulations at lower constant forces.
Vinculin-binding Subdomain (MI) Is the Least Stable Subdomain in the M Region
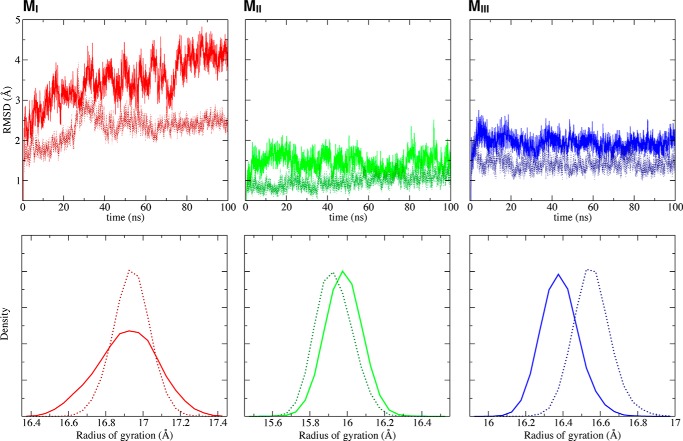
Besides the importance of the salt bridges for the overall stability of the M region, the stability of individual four-helix bundle subdomains differs. Importantly, the MI subdomain, which contains the vinculin-binding site, is the least stable of the three M subdomains, both in isolation (trajectories 12, 15, and 17) and in the full M region (trajectory 2). MI consistently exhibited larger conformational deviations and greater structural fluctuations than either MII or MIII (Figs. 4B and 7). After 100 ns, the r.m.s.d. of the isolated MI subdomain reached ∼4.5 Å, which is not only markedly larger than the r.m.s.d. of MII (1.5 Å) and MIII (2 Å) subdomains, but also greater than that of MI within the intact M region (2.5 Å after 100 ns) (Fig. 12). In contrast, the r.m.s.d. of either MII or MIII in single-domain equilibrium simulations shifted little (∼0.5 Å), compared with their behavior within the intact M region (Fig. 12). Furthermore, the distribution of the radius of gyration of the isolated MI subdomain is much broader than in the context of the M region (Fig. 12).
FIGURE 12.
Stability of each subdomain within the core M region, during single-domain equilibrium simulations (trajectories 12, 15, and 17). The backbone r.m.s.d., respectively, for MI (left), MII (middle), and MIII (right) subdomains are shown as solid line in the top panel, and the distributions of radius of gyration for each domain are in the bottom panel. The corresponding values for each subdomain when simulated within the context of the whole M region (trajectory 2) are provided as dotted lines in each plot for comparison.
Single salt-bridge mutants in the M region (trajectories 5,7) further enhanced the differences in the stability of the MI subdomain relative to MII or MIII (Fig. 7). This result is consistent with our postulate that the autoinhibited conformation is predominantly stabilized by the inter-domain salt-bridge network rather than by other inter-domain or intra-domain contacts. This finding also suggests that disrupting the salt-bridge network may facilitate switching between the closed (autoinhibited) and open (active) conformational states. We further postulate that MI unfolding would still require initial salt-bridge rupture, which would define the critical force to unfurl α-catenin and expose its encrypted VBS.
So far, studies have identified two classes of missense mutations. The first class includes charged residues, such as E521A and R551A, as mentioned above. The second class of mutations disrupts the MI helical bundle and includes M371W and L344P. The mutant M371W in the core of the MI subdomain increases vinculin binding to α-catenin, in affinity pulldown experiments in vitro (38). The L344P lacks high affinity binding to vinculin in in vitro binding assays (68) and in single molecule magnetic tweezers studies (42). But in this study, we only performed simulations with the M371W mutant.
In the single-domain equilibrium simulations, the wild type MI subdomain (trajectory 12) and its M371W mutant (trajectories 19) did not exhibit any clear difference in the structural stability of the MI subdomain, based on the calculated r.m.s.d. during 100-ns equilibrium simulations (Fig. 13A). However, cf-SMD simulations using a pulling force of 100 pN (trajectories 31 and 33) suggest that the M371W mutation causes MI to unfold considerably faster than wild type, when subject to external force. During these cf-SMD simulations, the wild type MI subdomain required over 120 ns to undergo a large scale conformational change (Fig. 13, A and C), but the M371W mutant unfolded in only 10 ns (Fig. 13, A and B).
FIGURE 13.
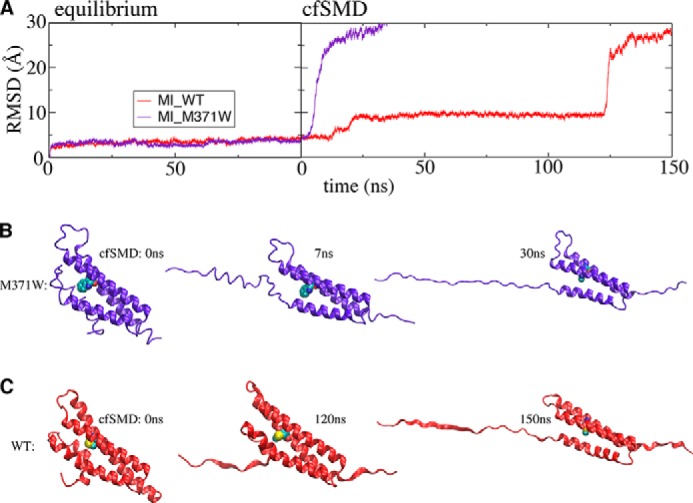
Conformational dynamics of the wild type MI domain and its mutant M371W during single-domain equilibrium (trajectories 12 and 19) and cf-SMD simulations (trajectories 31 and 33). A, backbone r.m.s.d. of the MI domain are shown as a function of time. Several snapshots during cf-SMD simulations are shown for mutant M371W (B) and wild type (C) MI subdomains. The constant force in both simulations is 100 pN.
Interpretations of Force-extension Experiment from MD Simulation
These simulations nevertheless reveal possible structural bases of the three unfolding steps in magnetic tweezers measurements (42). The initial observed unfolding step at 5 pN in these experiments corresponds to a length change of 16 nm (42). The observed N-to-C distance change of ∼16 nm during the simulations (Fig. 10, A and B) is mainly due to unfolding of the first two contiguous helices in the MI subdomain and the relative reorientation of MII and MIII. The complete separation of the third and fourth helices in MI (and exposure of the VBS) would result in a length change of ∼20 nm, which is consistent with the length of the experimentally measured refolding transition at ∼4.7 pN (42). Although it might appear surprising that the second helix in MI completely unfolds in the simulations, this observation is in line with the structural instability of this helix as inferred from its partially unstructured forms in co-crystals of vinculin and α-catenin (40).
The cfSMD and cvSMD simulations also suggest that salt bridge rupture is an important event determining the unfolding force, but other interactions between helices 3 and 4 of MI subdomain also contribute. Experimentally, the L344P mutation abrogated the initial unfolding event at 5 pN (42). Although this might solely reflect the disruption of the interface between the third and fourth helices in MI, the mutation could also disrupt packing necessary for the inter-domain salt-bridge network, by displacing Arg-326 and other residues. The second unfolding steps of 25 pN in the experiments were attributed to the sequential unfolding of MII and MIII (42). The formation of more stable contacts between the reoriented MII and MIII subdomains would partly account for the greater forces required to further unfold the protein. The equilibrium simulations also reveal the greater structural and mechanical stability of MII and MIII, relative to MI.
The simulated unfolding behavior and the identified major stabilizing contacts may differ from interpretations of experimental force-extension curves. The different time scales could bias unfolding behavior, for example. The stretching rate at a constant force of 4 pN is ∼20 nm/s, compared with the simulated stretching rate of ∼50 nm/μs at a constant force of 100 pN (cf-SMD). However, given the predicted dependence of kinetics on applied force (65), the different time scales for unfolding at 4 pN versus 100 pN might be reasonable. Also, the millisecond time resolution of single molecule measurements would not likely identify the different stages of MI unfolding seen in SMD simulations. Future comparisons of the simulation predictions with experimental force-extension measurements and biochemical studies will test the importance of the inter-domain salt bridges versus intra-domain contacts in α-catenin mechanics and force transduction.
Conclusions
In summary, this study reveals several atomic level details that may contribute to the mechanical function of α-catenin. First, the N- and C-terminal domains do not influence the force sensitivity of the core M region. More importantly, equilibrium and SMD simulations suggest that a dynamic salt-bridge network within the M region stabilizes the autoinhibitory conformation of α-catenin. The rupture of the salt-bridge network and the following MII/MIII reorientation under force may constitute an initial phase along the unfolding pathway (Fig. 14). Furthermore, simulations also demonstrate that the vinculin-binding subdomain MI is intrinsically less stable than the MII and MIII subdomains of the M region. All of these findings are critical insights toward developing a comprehensive understanding of the mechanism of the molecular switch of α-catenin from the autoinhibited to activated state.
FIGURE 14.
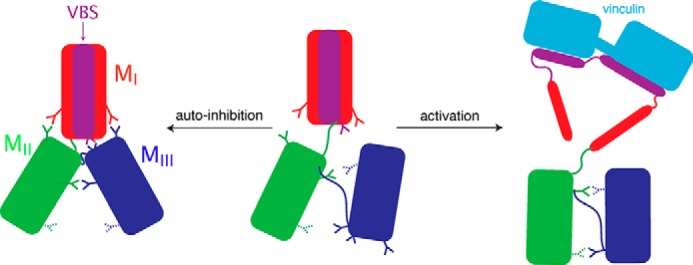
Model for the conformational switch of α-catenin between the autoinhibited state and the active state that can bind vinculin. The vinculin-binding site (VBS) in the MI subdomain is in purple. Vinculin is in cyan. The inter-domain salt bridges critical for autoinhibition are shown as solid sticks, and other charged residues important for MII/MIII interaction after reorientation are shown as striped sticks.
Author Contributions
J. L., J. N., D. E. L., and E. T. conceived and coordinated the study. J. L. designed, performed, and analyzed all the simulations. N. I. designed and prepared Fig. 2A. J. L., J. N., N. I., C. G., M. I., D. E. L., and E. T. contributed to discussion of the results and to the preparation of the manuscript. All authors contributed to discussion of the results, the preparation of the manuscript, and approved the final version of the manuscript.
This work was supported, in whole or in part, by National Institutes of Health Grant P41-GM104601, National Science Foundation Grant 1029871, and the Canadian Institutes of Health Research grant (MOP-130297). This work was also supported by a supercomputing allocation through Xsede Grant MCA06N060 and the Illinois Campus Cluster Program. The authors declare that they have no conflicts of interest with the contents of this article.
- VBS
- vinculin-binding site
- r.m.s.d.
- root mean square deviation
- MD
- molecular dynamics
- SMD
- steered MD
- cv-SMD
- constant velocity SMD
- cf-SMD
- constant force SMD
- PDB
- Protein Data Bank
- pN
- piconewton.
References
- 1. Hahn C., Schwartz M. A. (2009) Mechanotransduction in vascular physiology and atherogenesis. Nat. Rev. 10, 53–62 [DOI] [PMC free article] [PubMed] [Google Scholar]
- 2. Vogel V., Sheetz M. (2006) Local force and geometry sensing regulate cell functions. Nat. Rev. Mol. Cell Biol. 7, 265–275 [DOI] [PubMed] [Google Scholar]
- 3. Schwartz M. A. (2010) Integrins and extracellular matrix in mechanotransduction. Cold Spring Harb. Perspect. Biol. 2, a005066. [DOI] [PMC free article] [PubMed] [Google Scholar]
- 4. Lecuit T., Lenne P. F., Munro E. (2011) Force generation, transmission, and integration during cell and tissue morphogenesis. Annu. Rev. Cell Dev. Biol. 27, 157–184 [DOI] [PubMed] [Google Scholar]
- 5. Hytönen V. P., Vogel V. (2008) How force might activate talin's vinculin binding sites: SMD reveals a structural mechanism. PLoS Comput. Biol. 4, e24. [DOI] [PMC free article] [PubMed] [Google Scholar]
- 6. Golji J., Lam J., Mofrad M. R. (2011) Vinculin activation is necessary for complete talin binding. Biophys. J. 100, 332–340 [DOI] [PMC free article] [PubMed] [Google Scholar]
- 7. Lee S. E., Kamm R. D., Mofrad M. R. (2007) Force-induced activation of talin and its possible role in focal adhesion mechanotransduction. J. Biomech. 40, 2096–2106 [DOI] [PubMed] [Google Scholar]
- 8. Sawada Y., Tamada M., Dubin-Thaler B. J., Cherniavskaya O., Sakai R., Tanaka S., Sheetz M. P. (2006) Force sensing by mechanical extension of the Src family kinase substrate p130Cas. Cell 127, 1015–1026 [DOI] [PMC free article] [PubMed] [Google Scholar]
- 9. Tamada M., Sheetz M. P., Sawada Y. (2004) Activation of a signaling cascade by cytoskeleton stretch. Dev. Cell 7, 709–718 [DOI] [PubMed] [Google Scholar]
- 10. Seong J., Tajik A., Sun J., Guan J. L., Humphries M. J., Craig S. E., Shekaran A., García A. J., Lu S., Lin M. Z., Wang N., Wang Y. (2013) Distinct biophysical mechanisms of focal adhesion kinase mechanoactivation by different extracellular matrix proteins. Proc. Natl. Acad. Sci. U.S.A. 110, 19372–19377 [DOI] [PMC free article] [PubMed] [Google Scholar]
- 11. Smith M. L., Gourdon D., Little W. C., Kubow K. E., Eguiluz R. A., Luna-Morris S., Vogel V. (2007) Force-induced unfolding of fibronectin in the extracellular matrix of living cells. PLoS Biol. 5, e268. [DOI] [PMC free article] [PubMed] [Google Scholar]
- 12. Chen Z., Tzima E. (2009) PECAM-1 is necessary for flow-induced vascular remodeling. Arterioscler. Thromb. Vasc. Biol. 29, 1067–1073 [DOI] [PMC free article] [PubMed] [Google Scholar]
- 13. Collins C., Guilluy C., Welch C., O'Brien E. T., Hahn K., Superfine R., Burridge K., Tzima E. (2012) Localized tensional forces on PECAM-1 elicit a global mechanotransduction response via the integrin-RhoA pathway. Curr. Biol. 22, 2087–2094 [DOI] [PMC free article] [PubMed] [Google Scholar]
- 14. Tzima E., Irani-Tehrani M., Kiosses W. B., Dejana E., Schultz D. A., Engelhardt B., Cao G., DeLisser H., Schwartz M. A. (2005) A mechanosensory complex that mediates the endothelial cell response to fluid shear stress. Nature 437, 426–431 [DOI] [PubMed] [Google Scholar]
- 15. Barry A. K., Tabdili H., Muhamed I., Wu J., Shashikanth N., Gomez G. A., Yap A. S., Gottardi C. J., de Rooij J., Wang N., Leckband D. E. (2014) α-Catenin cytomechanics: role in cadherin-dependent adhesion and mechanotransduction. J. Cell Sci. 127, 1779–1791 [DOI] [PMC free article] [PubMed] [Google Scholar]
- 16. Huveneers S., de Rooij J. (2013) Mechanosensitive systems at the cadherin-F-actin interface. J. Cell Sci. 126, 403–413 [DOI] [PubMed] [Google Scholar]
- 17. Leckband D. E., de Rooij J. (2014) Cadherin adhesion and mechanosensing. Annu. Rev. Cell Dev. Biol. 30, 291–315 [DOI] [PubMed] [Google Scholar]
- 18. Yonemura S., Wada Y., Watanabe T., Nagafuchi A., Shibata M. (2010) α-Catenin as a tension transducer that induces adherens junction development. Nat. Cell Biol. 12, 533–542 [DOI] [PubMed] [Google Scholar]
- 19. Thomas W. A., Boscher C., Chu Y. S., Cuvelier D., Martinez-Rico C., Seddiki R., Heysch J., Ladoux B., Thiery J. P., Mege R. M., Dufour S. (2013) α-Catenin and vinculin cooperate to promote high E-cadherin-based adhesion strength. J. Biol. Chem. 288, 4957–4969 [DOI] [PMC free article] [PubMed] [Google Scholar]
- 20. le Duc Q., Shi Q., Blonk I., Sonnenberg A., Wang N., Leckband D., de Rooij J. (2010) Vinculin potentiates E-cadherin mechanosensing and is recruited to actin-anchored sites within adherens junctions in a MyosinII-dependent manner. J. Cell Biol. 189, 1107–1115 [DOI] [PMC free article] [PubMed] [Google Scholar]
- 21. Liu Z., Tan J. L., Cohen D. M., Yang M. T., Sniadecki N. J., Ruiz S. A., Nelson C. M., Chen C. S. (2010) Mechanical tugging force regulates the size of cell-cell junctions. Proc. Natl. Acad. Sci. U.S.A. 107, 9944–9949 [DOI] [PMC free article] [PubMed] [Google Scholar]
- 22. Ladoux B., Anon E., Lambert M., Rabodzey A., Hersen P., Buguin A., Silberzan P., Mège R. M. (2010) Strength dependence of cadherin-mediated adhesions. Biophys. J. 98, 534–542 [DOI] [PMC free article] [PubMed] [Google Scholar]
- 23. Buckley C. D., Tan J., Anderson K. L., Hanein D., Volkmann N., Weis W. I., Nelson W. J., Dunn A. R. (2014) Cell adhesion. The minimal cadherin-catenin complex binds to actin filaments under force. Science 346, 1254211. [DOI] [PMC free article] [PubMed] [Google Scholar]
- 24. Imamura Y., Itoh M., Maeno Y., Tsukita S., Nagafuchi A. (1999) Functional domains of α-catenin required for the strong state of cadherin-based cell adhesion. J. Cell Biol. 144, 1311–1322 [DOI] [PMC free article] [PubMed] [Google Scholar]
- 25. Nagafuchi A., Ishihara S., Tsukita S. (1994) The roles of catenins in the cadherin-mediated cell adhesion: functional analysis of E-cadherin-α catenin fusion molecules. J. Cell Biol. 127, 235–245 [DOI] [PMC free article] [PubMed] [Google Scholar]
- 26. Desai R., Sarpal R., Ishiyama N., Pellikka M., Ikura M., Tepass U. (2013) Monomeric α-catenin links cadherin to the actin cytoskeleton. Nat. Cell Biol. 15, 261–273 [DOI] [PubMed] [Google Scholar]
- 27. Gumbiner B. M., McCrea P. D. (1993) Catenins as mediators of the cytoplasmic functions of cadherins. J. Cell Sci. Suppl. 17, 155–158 [DOI] [PubMed] [Google Scholar]
- 28. Vermeulen S. J., Bruyneel E. A., Bracke M. E., De Bruyne G. K., Vennekens K. M., Vleminckx K. L., Berx G. J., van Roy F. M., Mareel M. M. (1995) Transition from the noninvasive to the invasive phenotype and loss of α-catenin in human colon cancer cells. Cancer Res. 55, 4722–4728 [PubMed] [Google Scholar]
- 29. Vermeulen S. J., Nollet F., Teugels E., Philippe J., Speleman F., van Roy F. M., Bracke M. E., Mareel M. M. (1997) Mutation of α-catenin results in invasiveness of human HCT-8 colon cancer cells. Ann. N.Y. Acad. Sci. 833, 186–189 [DOI] [PubMed] [Google Scholar]
- 30. Kim T. J., Zheng S., Sun J., Muhamed I., Wu J., Lei L., Kong X., Leckband D. E., Wang Y. (2015) Dynamic visualization of α-catenin reveals rapid, reversible conformation switching between tension states. Curr. Biol. 25, 218–224 [DOI] [PMC free article] [PubMed] [Google Scholar]
- 31. Huveneers S., Oldenburg J., Spanjaard E., van der Krogt G., Grigoriev I., Akhmanova A., Rehmann H., de Rooij J. (2012) Vinculin associates with endothelial VE-cadherin junctions to control force-dependent remodeling. J. Cell Biol. 196, 641–652 [DOI] [PMC free article] [PubMed] [Google Scholar]
- 32. Twiss F., Le Duc Q., Van Der Horst S., Tabdili H., Van Der Krogt G., Wang N., Rehmann H., Huveneers S., Leckband D. E., De Rooij J. (2012) Vinculin-dependent cadherin mechanosensing regulates efficient epithelial barrier formation. Biol. Open 1, 1128–1140 [DOI] [PMC free article] [PubMed] [Google Scholar]
- 33. Leerberg J. M., Gomez G. A., Verma S., Moussa E. J., Wu S. K., Priya R., Hoffman B. D., Grashoff C., Schwartz M. A., Yap A. S. (2014) Tension-sensitive actin assembly supports contractility at the epithelial zonula adherens. Curr. Biol. 24, 1689–1699 [DOI] [PMC free article] [PubMed] [Google Scholar]
- 34. Ziegler W. H., Liddington R. C., Critchley D. R. (2006) The structure and regulation of vinculin. Trends Cell Biol. 16, 453–460 [DOI] [PubMed] [Google Scholar]
- 35. Rangarajan E. S., Izard T. (2013) Dimer asymmetry defines α-catenin interactions. Nat. Struct. Mol. Biol. 20, 188–193 [DOI] [PMC free article] [PubMed] [Google Scholar]
- 36. Yang J., Dokurno P., Tonks N. K., Barford D. (2001) Crystal structure of the M-fragment of α-catenin: implications for modulation of cell adhesion. EMBO J. 20, 3645–3656 [DOI] [PMC free article] [PubMed] [Google Scholar]
- 37. Pokutta S., Weis W. I. (2000) Structure of the dimerization and β-catenin-binding region of α-catenin. Mol. Cell 5, 533–543 [DOI] [PubMed] [Google Scholar]
- 38. Ishiyama N., Tanaka N., Abe K., Yang Y. J., Abbas Y. M., Umitsu M., Nagar B., Bueler S. A., Rubinstein J. L., Takeichi M., Ikura M. (2013) An autoinhibited structure of α-catenin and its implications for vinculin recruitment to adherens junctions. J. Biol. Chem. 288, 15913–15925 [DOI] [PMC free article] [PubMed] [Google Scholar]
- 39. Pokutta S., Choi H. J., Ahlsen G., Hansen S. D., Weis W. I. (2014) Structural and thermodynamic characterization of cadherin·β-catenin·α-catenin complex formation. J. Biol. Chem. 289, 13589–13601 [DOI] [PMC free article] [PubMed] [Google Scholar]
- 40. Rangarajan E. S., Izard T. (2012) The cytoskeletal protein α-catenin unfurls upon binding to vinculin. J. Biol. Chem. 287, 18492–18499 [DOI] [PMC free article] [PubMed] [Google Scholar]
- 41. Choi H. J., Pokutta S., Cadwell G. W., Bobkov A. A., Bankston L. A., Liddington R. C., Weis W. I. (2012) αE-catenin is an autoinhibited molecule that coactivates vinculin. Proc. Natl. Acad. Sci. U.S.A. 109, 8576–8581 [DOI] [PMC free article] [PubMed] [Google Scholar]
- 42. Yao M., Qiu W., Liu R., Efremov A. K., Cong P., Seddiki R., Payre M., Lim C. T., Ladoux B., Mège R. M., Yan J. (2014) Force-dependent conformational switch of α-catenin controls vinculin binding. Nat. Commun. 5, 4525. [DOI] [PubMed] [Google Scholar]
- 43. Gordon J. C., Myers J. B., Folta T., Shoja V., Heath L. S., Onufriev A. (2005) H++: a server for estimating pKas and adding missing hydrogens to macromolecules. Nucleic Acids Res. 33, W368–W371 [DOI] [PMC free article] [PubMed] [Google Scholar]
- 44. Schreiner E., Trabuco L. G., Freddolino P. L., Schulten K. (2011) Stereochemical errors and their implications for molecular dynamics simulations. BMC Bioinformatics 12, 190. [DOI] [PMC free article] [PubMed] [Google Scholar]
- 45. Grubmüller H., Groll V. (1996) Solvate, Version 1.0 University of Munich, Munich, Germany [Google Scholar]
- 46. Humphrey W., Dalke A., Schulten K. (1996) VMD: visual molecular dynamics. J. Mol. Graph. 14, 33–38 [DOI] [PubMed] [Google Scholar]
- 47. Phillips J. C., Braun R., Wang W., Gumbart J., Tajkhorshid E., Villa E., Chipot C., Skeel R. D., Kalé L., Schulten K. (2005) Scalable molecular dynamics with NAMD. J. Comput. Chem. 26, 1781–1802 [DOI] [PMC free article] [PubMed] [Google Scholar]
- 48. MacKerell A. D., Bashford D., Bellott M., Dunbrack R. L., Evanseck J. D., Field M. J., Fischer S., Gao J., Guo H., Ha S., Joseph-McCarthy D., Kuchnir L., Kuczera K., Lau F. T., Mattos C., et al. (1998) All-atom empirical potential for molecular modeling and dynamics studies of proteins. J. Phys. Chem. B 102, 3586–3616 [DOI] [PubMed] [Google Scholar]
- 49. Kuttel M., Brady J. W., Naidoo K. J. (2002) Carbohydrate solution simulations: producing a force field with experimentally consistent primary alcohol rotational frequencies and populations. J. Comput. Chem. 23, 1236–1243 [DOI] [PubMed] [Google Scholar]
- 50. Jorgensen W. L., Chandrasekhar J., Madura J. D., Impey R. W., Klein M. L. (1983) Comparison of simple potential functions for simulating liquid water. J. Chem. Phys. 79, 926–935 [Google Scholar]
- 51. Ryckaert J.-P., Ciccotti G., Berendsen H. J. (1977) Numerical integration of the Cartesian equations of motion of a system with constraints: Molecular dynamics of n-alkanes. J. Comp. Phys. 23, 327–341 [Google Scholar]
- 52. Isralewitz B., Gao M., Schulten K. (2001) Steered molecular dynamics and mechanical functions of proteins. Curr. Opin. Struct. Biol. 11, 224–230 [DOI] [PubMed] [Google Scholar]
- 53. Izrailev S., Stepaniants S., Balsera M., Oono Y., Schulten K. (1997) Molecular dynamics study of unbinding of the avidin-biotin complex. Biophys. J. 72, 1568–1581 [DOI] [PMC free article] [PubMed] [Google Scholar]
- 54. Feller S. E., Zhang Y., Pastor R. W., Brooks B. R. (1995) Constant pressure molecular dynamics simulation: the Langevin piston method. J. Chem. Phys. 103, 4613–4621 [Google Scholar]
- 55. Martyna G. J., Tobias D. J., Klein M. L. (1994) Constant pressure molecular dynamics algorithms. J. Chem. Phys. 101, 4177–4189 [Google Scholar]
- 56. Darden T., York D., Pedersen L. G. (1993) Particle mesh Ewald: an N·log(N) method for Ewald sums in large systems. J. Chem. Phys. 98, 10089–10092 [Google Scholar]
- 57. Sarpal R., Pellikka M., Patel R. R., Hui F. Y., Godt D., Tepass U. (2012) Mutational analysis supports a core role for Drosophila α-catenin in adherens junction function. J. Cell Sci. 125, 233–245 [DOI] [PubMed] [Google Scholar]
- 58. Barlow D. J., Thornton J. M. (1983) Ion-pairs in proteins. J. Mol. Biol. 168, 867–885 [DOI] [PubMed] [Google Scholar]
- 59. Cerami E., Gao J., Dogrusoz U., Gross B. E., Sumer S. O., Aksoy B. A., Jacobsen A., Byrne C. J., Heuer M. L., Larsson E., Antipin Y., Reva B., Goldberg A. P., Sander C., Schultz N. (2012) The cBio cancer genomics portal: an open platform for exploring multidimensional cancer genomics data. Cancer Discov. 2, 401–404 [DOI] [PMC free article] [PubMed] [Google Scholar]
- 60. Gao J., Aksoy B. A., Dogrusoz U., Deresdner G., Gross B., Sumer S. O., Sun Y., Jacobsen A., Sinha R., Larsson E., Cerami E., Sander C., Schultz N. (2013) Integrative analysis of complex cancer genomics and clinical profiles using the cBioPortal. Sci. Signal. 6, 269. [DOI] [PMC free article] [PubMed] [Google Scholar]
- 61. Bakolitsa C., Cohen D. M., Bankston L. A., Bobkov A. A., Cadwell G. W., Jennings L., Critchley D. R., Craig S. W., Liddington R. C. (2004) Structural basis for vinculin activation at sites of cell adhesion. Nature 430, 583–586 [DOI] [PubMed] [Google Scholar]
- 62. Borgon R. A., Vonrhein C., Bricogne G., Bois P. R., Izard T. (2004) Crystal structure of human vinculin. Structure 12, 1189–1197 [DOI] [PubMed] [Google Scholar]
- 63. Bays J. L., Peng X., Tolbert C. E., Guilluy C., Angell A. E., Pan Y., Superfine R., Burridge K., DeMali K. A. (2014) Vinculin phosphorylation differentially regulates mechanotransduction at cell-cell and cell-matrix adhesions. J. Cell Biol. 205, 251–263 [DOI] [PMC free article] [PubMed] [Google Scholar]
- 64. Zhang Z., Izaguirre G., Lin S. Y., Lee H. Y., Schaefer E., Haimovich B. (2004) The phosphorylation of vinculin on tyrosine residues 100 and 1065, mediated by SRC kinases, affects cell spreading. Mol. Biol. Cell 15, 4234–4247 [DOI] [PMC free article] [PubMed] [Google Scholar]
- 65. Bell G. I. (1978) Models for the specific adhesion of cells to cells. Science 200, 618–627 [DOI] [PubMed] [Google Scholar]
- 66. Pokutta S., Drees F., Takai Y., Nelson W. J., Weis W. I. (2002) Biochemical and structural definition for the 1-Afadin- and actin-binding sites of α-catenin. J. Biol. Chem. 277, 18868–18874 [DOI] [PMC free article] [PubMed] [Google Scholar]
- 67. Pokutta S., Drees F., Yamada S., Nelson W. J., Weis W. I. (2008) Biochemical and structural analysis of α-catenin in cell-cell contacts. Biochem. Soc. Trans. 36, 141–147 [DOI] [PMC free article] [PubMed] [Google Scholar]
- 68. Peng X., Maiers J. L., Choudhury D., Craig S. W., DeMali K. A. (2012) α-Catenin uses a novel mechanism to activate vinculin. J. Biol. Chem. 287, 7728–7737 [DOI] [PMC free article] [PubMed] [Google Scholar]


