

In Brief
Patients with type 2 diabetes have an increased risk for cardiovascular and chronic kidney disease. Superimposed hypertension further increases the risk and is associated with increased dietary sodium intake. There are few data available on dietary sodium intake in type 2 diabetes. The aim of this study was to quantify dietary sodium intake in a cohort of self-referred patients with type 2 diabetes and to identify sociodemographic characteristics associated with it. Sodium intake in this cohort was far greater than current recommendations. Increased awareness of sodium intake in this population might lead to target interventions to reduce sodium intake and potentially improve long-term outcomes.
Patients with type 2 diabetes are at high risk of developing cardiovascular disease (CVD), and CVD risks are even higher in those with concurrent hypertension.1–4 This is of great importance because 20–60% of people with type 2 diabetes have hypertension.5
Excess sodium intake contributes to hypertension both directly, by increasing intravascular volume, and indirectly, by blunting the effectiveness of antihypertensive drugs.6–8 High sodium intake is also associated with worsening proteinuria in patients with microalbuminuria9 and decreases the antiproteinuric effects of antihypertensive medications.10 Decreasing sodium intake can lower blood pressure levels.11,12 Consequently, a sodium-restricted diet has long been a first line of intervention for people with hypertension and is particularly important in those with type 2 diabetes.
In 2010, the American Heart Association (AHA) recommended that those at risk of heart disease, including all people with type 2 diabetes, further limit their dietary sodium to 1,500 mg/day.13 Data from four National Health and Nutrition Examination Surveys (NHANES) showed that the proportion of the population for whom the 1,500 mg/day ceiling was applicable increased with each study period since 1999.14 Currently, based on this recommendation, 47.6% of the U.S. population ≥ 2 years of age should limit their sodium intake to < 1,500 mg/day.15
Limiting dietary sodium is a challenge given the preponderance of processed food in the American diet. Federal initiatives to lower sodium intake began in 1969, with the White House Conference on Food, Nutrition, and Health.16 The conference report highlighted increasing evidence of the adverse effects of dietary sodium and called on the food industry to voluntarily reduce the amount of sodium added to their products. Multiple initiatives and reports since then have reiterated these calls, which until recently have gone unheeded.17
During the past 40 years, the processed food industry has exploded, with sales topping $3.2 trillion in 2005, or 75% of worldwide food sales.18 Today, the average American consumes 3,436 mg/day of sodium, with 80% of this coming from processed foods.17 Perhaps as a consequence, more than one-third of adults > 20 years of age have hypertension.19 Only 51% of those treated for the condition have controlled hypertension, perhaps, at least in part, because of a failure of sodium restriction.20
Research is needed to characterize the extent of excessive sodium intake in patients with type 2 diabetes because excess sodium intake in these patients increases the risk of progression of CVD and chronic kidney disease (CKD).21–23 If associations of excessive dietary sodium intake in this vulnerable population are identified, then educational efforts to limit sodium intake can be targeted appropriately. The purpose of this article is to describe the baseline dietary sodium intake of participants in the Enhancing Adherence in Type 2 Diabetes (ENHANCE) trial and variations with regard to sociodemographic and health characteristics.
Design and Methods
Design. ENHANCE was a single-center, randomized, controlled trial to test a 6-month behavioral intervention paired with technology-based self-monitoring to enhance lifestyle management of people with type 2 diabetes. For the purpose of this article, baseline data from participants’ 3-day food dairies (described below) were reported. Details of the overall study design and results have been reported elsewhere.24,25 The study was reviewed and approved by the institutional review board of the University of Pittsburgh in Pennsylvania.
Sample. To be eligible, potential participants had to be ≥ 18 years of age and have a self-reported diagnosis of type 2 diabetes. Exclusion criteria included 1) hypoglycemic coma/seizure within the past 12 months, 2) hypoglycemia requiring external assistance within the past 3 months, 3) unwillingness or inability to self-monitor capillary blood glucose or to participate in scheduled group classes, 4) history consistent with type 1 diabetes, 5) end-stage renal disease treated with renal dialysis or expectation of dialysis treatment before the conclusion of the 6-month intervention period, 6) history of dementia or alcohol or substance abuse, 7) intention to move outside of the study region within the study period, 8) lack of support from potential participants’ primary health care provider, and 9) participation in another clinical trial.
Measures. A diet diary was mailed to participants 2 weeks before their scheduled baseline measurement visit. Participants were directed to select 3 days and record their meals, including the individual foods consumed, serving sizes, and (if applicable) brand names. Participants also completed a sociodemographic questionnaire and the Rigler Comorbidity Checklist.26 Baseline measurement visits were performed at the Clinical and Translational Research Center at the University of Pittsburgh Medical Center. Signed informed consent was obtained before collecting the completed surveys and diet diaries.
Dietary diaries were reviewed and necessary clarification sought for serving sizes and common condiments. Dietary data were entered into the Nutrient Data System for Research (NDS-R)27 by staff at the University of Pittsburgh Obesity Nutrition and Research Center. NDS-R is comprehensive nutrient calculation software maintained by the Nutrition Coordinating Center at the University of Minnesota. The database contains > 18,000 foods, 8,000 brand-name products, and a number of ethnic foods and is updated regularly.
Analysis. Comparisons of sodium intake across baseline characteristics were carried out with a nonparametric test (Mann-Whitney or Kruskal-Wallis) because of a lack of normality. Multivariate analysis was performed using analysis of variance (ANOVA), with baseline sodium intake as the dependent variable.
To avoid violation of underlying ANOVA assumptions, a square root transformation of sodium was performed. Independent variables considered in the model included race, marital status, employment status, and the presence of CVD. The initial model included all independent variables and two-way interactions. Baseline kilocalories consumed (also transformed by square root) was included in the model to control for a possible effect of increased sodium consumption being associated with consuming more food. Because of the correlation between kilocalorie consumption and sex, sex was not in the model. Factors and interactions that were not statistically significant were removed from the model. Data for two participants were removed from the final model—one because of high leverage and the other because of poor prediction. Marginal means, which indicate the value of the dependent variable after “averaging over” the other variables in the model, are also reported.
Results
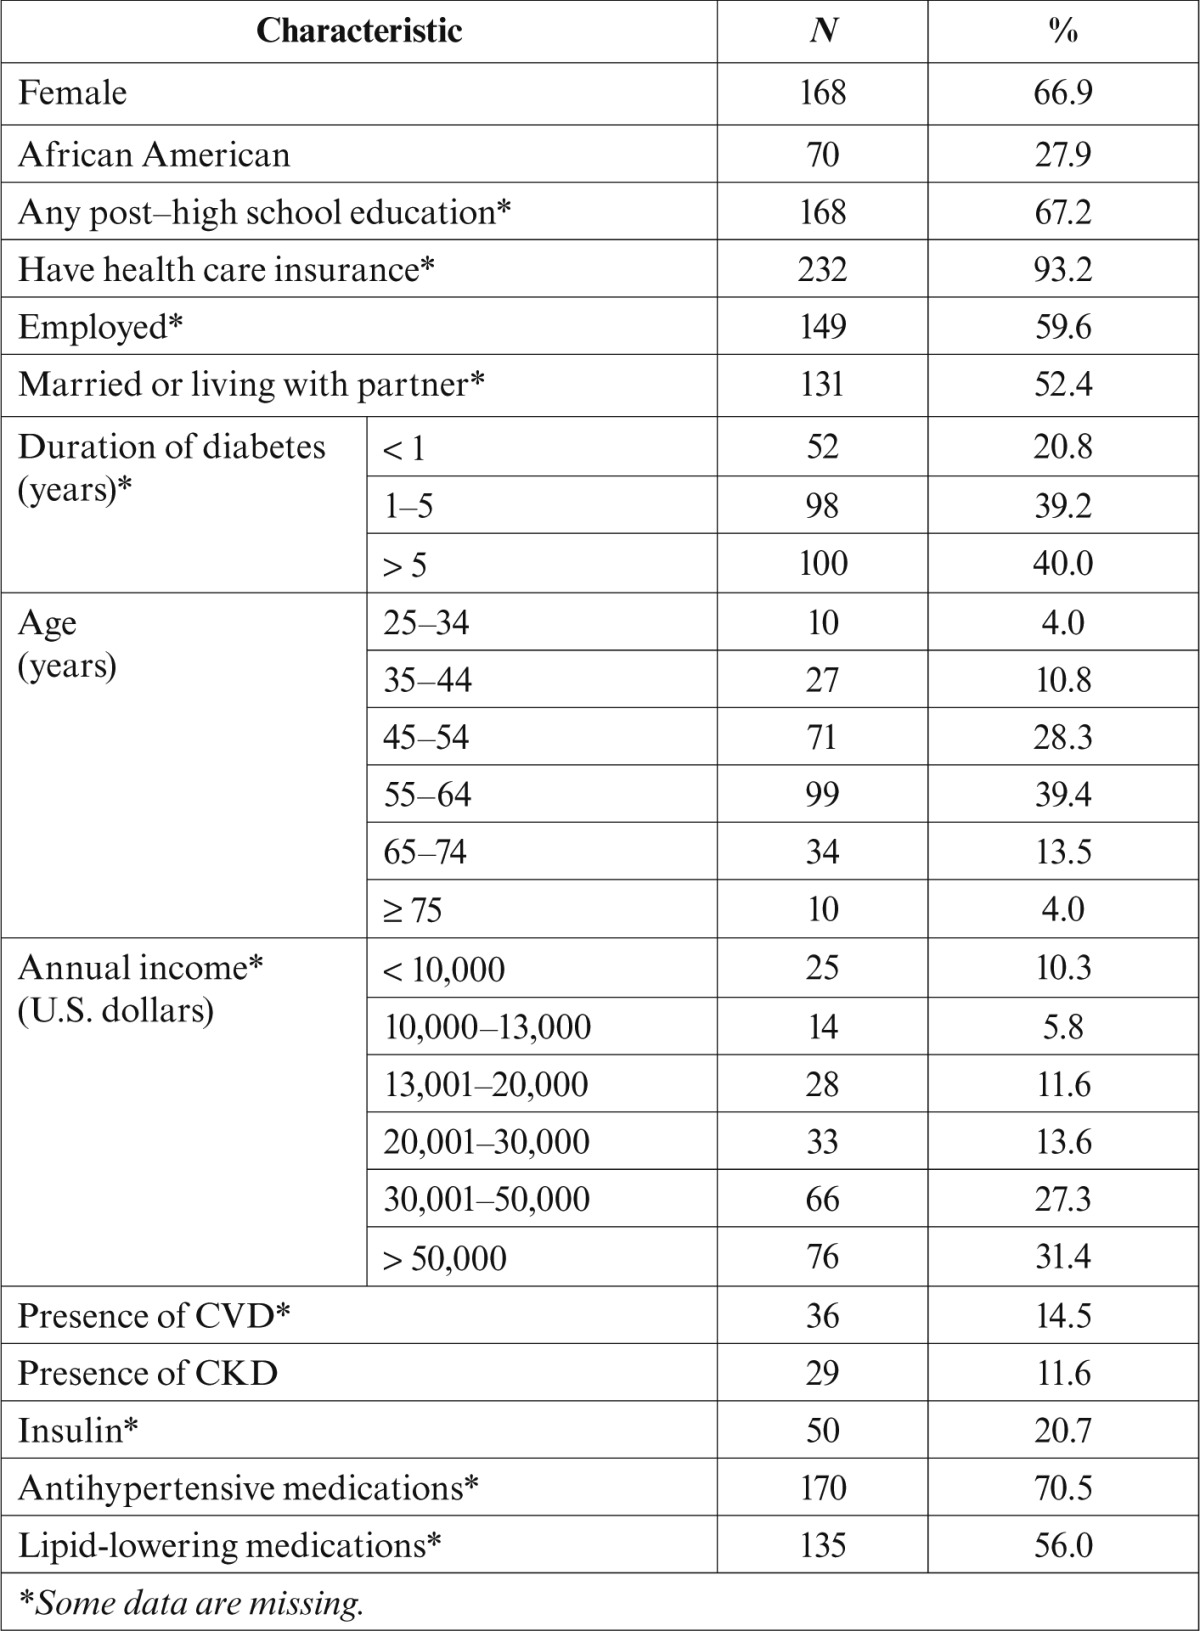
Of the 296 patients who met the eligibility criteria, 251 (84.8%) completed a baseline, 3-day diet diary and constitute the cohort reported here. Sociodemographic and health characteristics of the cohort are presented in Table 1. Women predominated, and African-American patients were well represented. The group was relatively well educated, and most had health insurance. The mean age was 55.6 years (SD 10.7). A minority had known CVD or CKD, but 70.5% were on antihypertensive medications.
Table 1.
Demographics and Health Characteristics of Participants With Type 2 Diabetes and Available 3-Day Food Diary (n = 251)
Mean sodium intake was 3,214 mg/day (SD 1,140; median 3,101, interquartile range [IQR] 1,383). Figure 1 displays variation in dietary sodium intake by sociodemographic and health characteristics. Sodium consumption was significantly lower among participants who were women (P < 0.001), uninsured (P < 0.05), and unmarried (P < 0.01), as well as those with concurrent CVD (P < 0.01). There was also a statistically significant relationship with income (P < 0.05), with higher income associated with higher sodium intake (data not shown). Notably, there was no association between sodium intake and the presence of CKD (P = 0.73).
Figure 1.
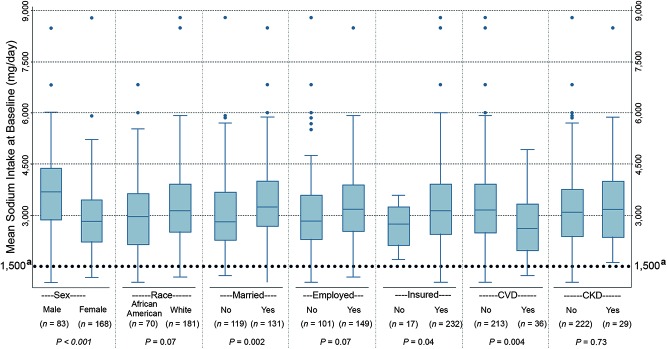
Sodium consumption (mg/day) at baseline by demographic characteristics in a cohort of self-referred patients with type 2 diabetes. The boxes indicate the 25th percentile (lower edge), the median (middle line), and the 75th percentile (upper edge). The whiskers extend beyond the 25th or 75th percentile by 1.5 times the IQR. Individual data points beyond the whiskers are indicated with closed dots. The Dietary Guidelines for Americans, 7th ed., recommends a sodium intake of ≤ 1,500 mg/day for African Americans, those ≥ 50 years of age, and those with diabetes, CKD, or CVD.
The final ANOVA model was statistically significant (P < 0.0001), with an adjusted R2 of 0.64. Variables remaining in the model were the presence of CVD (P < 0.05), marital status (P < 0.05), and the square root of kilocalories consumed (transformation required because of lack of normality; P < 0.0001). Predicted marginal means of the sodium intake in mg/day were: 3,155 for those without CVD, 2,913 for those with a history of CVD, 3,032 for those not married, and 3,198 for those married or living as married.
Discussion
We studied baseline sodium intake and its relationship with several sociodemographic and health characteristics in a group of self-referred individuals with type 2 diabetes. Despite the known association of high sodium intake with hypertension and the heightened risk of CVD and CKD associated with it in patients with diabetes,1–4,11,12 the mean sodium intake in our sample was as high as that observed in the general U.S. population. Only 20.3% of the participants consumed < 2,300 mg/day of sodium, the recommended ceiling at the time of recruitment, with only 2.4% meeting the current AHA recommended limit of 1,500 mg/day.
Data on dietary sodium intake in patients with type 2 diabetes are limited, but a previous Australian study28 showed similar results. In that study, which estimated sodium intake based on 24-hour urine sodium excretion, participants consumed an average of 3,910 mg/day of sodium. Only 3% of men and 14% of women met the Australian National Heart Foundation guideline recommendation for sodium intake (2,300 mg/day). Although our results also suggested that women consume less sodium than men, after adjustment for daily caloric intake, no significant sex difference was found.
Sodium intake also did not differ by race or education. Other investigators have suggested that socioeconomically disadvantaged individuals have more difficulty eating a healthy diet because of the higher cost of fresh food compared to processed and prepared food.29–31 However, we found that those with higher incomes had a higher sodium intake, as did those with health insurance. Mean sodium content at sit-down restaurants is higher than at quick-serve restaurants (1,905 ± 1,138 vs. 1,608 ± 796 mg, respectively).32 Thus, one possible explanation is that, when dining out, participants with higher incomes ate at sit-down restaurants more often than those with lower incomes. Additional research is necessary to explore the effects of socioeconomic factors on sodium intake levels.
Our results are of concern because a high-sodium diet may lead to serious adverse health effects in people with diabetes. High sodium intake not only is associated with increased risk of hypertension and a well-recognized surrogate marker of premature CVD death and CVD,33 but also worsens proteinuria in patients with microalbuminuria and decreases the effect of antihypertensive and antiproteinuric drugs.9,10
The Institute of Medicine recently published a review of the literature on the effects of sodium reduction on direct health outcomes in populations, including people with diabetes. The review concluded that the available data support a direct association between higher levels of sodium intake and CVD risk in both the general and diabetic populations and recognized that lowering current sodium intake levels to a goal of 2,300 mg/day would likely improve CVD outcomes. However, it found no evidence of benefit from lowering sodium intake levels to ≤ 1,500 mg/day in those with diabetes, CKD, or preexisting CVD. Of note, some methodological problems with the studies were noted, including possible confounding and reverse causality (i.e., sicker individuals consume less sodium because they eat less food).34 A recent American Diabetes Association (ADA) position statement35 regarding nutrition therapy for the management of adults with diabetes acknowledged the current controversy and recommended a goal of 2,300 mg/day for most patients with diabetes, with lower goals only for individual patients based on other health characteristics.
The reasons for the high sodium intake in our sample are unclear, but there are several possible explanations. Although we did not collect information about whether participants had received medical nutrition therapy (MNT), it is possible that a significant proportion of them had not availed themselves of nutrition counseling. According to the 2013 ADA position statement, despite the proven benefits of MNT and diabetes self-management education and support, only a minority of patients with diabetes in the United States have access to MNT.35
Although we did not collect information about the content of MNT delivered to our participants who received it, it is possible that dietary sodium was not addressed in those encounters. Nutrition counseling guidelines for adults with diabetes recommend three to four 45- to 90-minute MNT visits, plus additional visits based on medical necessity.36 However, MNT visits are only partially covered by Medicare, and some payers may not cover MNT at all.37 Given the limited reimbursement, MNT may have been abbreviated to focus on dietary changes needed to maintain glycemic control.
We did note that participants with diabetes and concurrent heart disease had significantly lower sodium intake than other participants. This suggests that a greater proportion of these individuals had received such counseling, perhaps as a component of routine CVD care. Despite the recent release of guidelines for nutrition assessment and counseling for patients with CKD, ENHANCE participants with CKD consumed as much sodium as those without CKD, suggesting that CKD dietary education did not adequately address sodium restriction.
Another possible explanation for the high levels of sodium intake could be lack of awareness of the high levels of sodium hidden in processed, packaged, and prepared foods. With the vast majority of the American diet coming from these food sources, limiting sodium in cooking or added at the table is no longer sufficient. The average patient with type 2 diabetes has little control over the amount of sodium added during food preparation.38 Nutrition education stressing the importance of avoiding processed foods, increasing reliance on fresh foods, and carefully reviewing food labels is needed. The high sodium intake in our participants demonstrates a need for new approaches to educate this vulnerable population regarding dietary sodium restriction to prevent or slow the development of vascular disease and CKD.
A recent, small crossover randomized trial39 comparing the Dietary Approaches to Reduce Hypertension (DASH) diet to a control diabetic diet for achieving metabolic control found significant improvement in weight, glycemic, lipid, and blood pressure control when participants were on the DASH diet. Of note, despite having the same caloric intake, the DASH diet group achieved the 2,300 mg/day sodium intake goal, whereas the other group had a mean sodium intake of 2,996 mg/day. We believe that dietary sodium counseling should be a routine component of type 2 diabetes MNT and that following the DASH diet might be a good means of achieving sodium goals.
A larger public health effort is also needed to decrease the amount of sodium intake in the food supply. In the United Kingdom, for example, the government collaborated with the food industry to decrease the amount of sodium in processed foods. This effort led to a reduction of salt intake from 9.5 to 8.6 g/day (3.8 vs. 3.4 g of sodium). This reduction was estimated to save more than 6,000 lives/year as well as up to £1.5 billion ($2.34 billion USD).40,41 A similar U.S. program called the National Salt Reduction Initiative (NSRI) began in 2008. NSRI is a partnership of 80 state and local authorities and national health organizations with a goal of reducing dietary sodium by 20% by 2014.42 Although the results are not yet known, such an approach might save billions of dollars in medical bills.43,44 A simulation based on NHANES data shows that reducing the average population sodium intake to 2,300 mg/day could have a striking impact on hypertension, reducing cases by 11 million, saving $18 billion in health care costs, and resulting in 312,000 quality-adjusted life years gained.45
The study has several strengths, including a large sample having diverse sociodemographic characteristics, limited exclusion criteria, prospective collection of dietary data, and analyses performed using state-of-the-art NDS-R. The study was limited by the fact that all participants were self-referred and so may have been more motivated to engage in a healthier lifestyle than the average person with type 2 diabetes. Dietary recalls are subject to considerable respondent bias, and our findings may be the result of measurement error rather than real differences in dietary sodium intake.46,47 Future researchers may wish to employ 24-hour urine collection as a more accurate measurement of dietary sodium intake, although 24-hour urine collections are frequently incomplete. However, the limitations noted would conservatively bias the results in the direction of consuming more sodium than was reported, supporting the conclusion that dietary sodium intake in patients with type 2 diabetes is excessively high. Finally, the fact that we did not inquire about previous nutrition education limited our ability to assess the impact of such intervention in achieving sodium intake goals and improving outcomes.
In summary, sodium intake in this cohort of patients with type 2 diabetes was very high. Differences in sodium intake in patients with comorbid CVD may indicate that the development of CVD is followed by dietary counseling that is somewhat effective in reducing sodium intake, although not enough to achieve 2,300 mg/day or the new (albeit controversial) AHA-recommended ceiling of 1,500 mg/day. Regardless of which ceiling is used, it is clear that greater efforts are required to reduce dietary sodium. Future research is needed to identify individuals with a high dietary sodium intake and develop targeted interventions.
ACKNOWLEDGMENTS
The work on this article was supported by the following National Institutes of Health grants: NIH/NINR/NR-R01008792, NIH/NCRR/CTSA-UL1-RR024153, NIH/NCRR/GCRC-M01- RR000056, NIH/NIDDK/DK-046204, NIH/NINR/NR-R01010135, and NIH/NINR/NIDDK/NHLBI/NIA-K24-NR012226. An abstract of this work was published previously (Ferreira-Provenzano L, Piraino B, Steenkiste A, Sevick MA: Sodium intake in type 2 DM is high. Am J Kidney Dis 57:A39, 2011). A poster of this work was also presented at the National Kidney Foundation spring meeting, 26–30 April 2011, in Las Vegas, Nev.
REFERENCES
- 1.Kabakov E, Norymberg C, Osher E, Koffler M, Tordjman K, Greenman Y, Stern N: Prevalence of hypertension in type 2 diabetes mellitus: impact of the tightening definition of high blood pressure and association with confounding risk factors. J Cardiometab Syndr 1:95–101, 2006 [DOI] [PubMed] [Google Scholar]
- 2.Marin R, Gorostidi M, Tranche S, Rodriguez-Manas L, Abellan J: Hypertension prevalence and control in type 2 diabetes: a primary care-based study. Am J Hypertens 15:192A, 2002 [Google Scholar]
- 3.Moore WV, Frederiskson D, Brenner A, Childs B, Tatpati O, Hoffman JM, Guthrie R: Prevalence of hypertension in patients with type II diabetes in referral versus primary care clinics. J Diabetes Complications 12:302–306, 1998 [DOI] [PubMed] [Google Scholar]
- 4.Suh DC, Kim CM, Choi IS, Plauschinat CA, Barone JA: Trends in blood pressure control and treatment among type 2 diabetes with comorbid hypertension in the United States: 1988–2004. J Hypertens 27:1908–1916, 2009 [DOI] [PubMed] [Google Scholar]
- 5.Salanitro AH, Roumie CL: Blood pressure management in patients with diabetes. Clinical Diabetes 28:107–114, 2010 [Google Scholar]
- 6.Pimenta E, Gaddam KK, Oparil S, Aban I, Husain S, Dell’Italia LJ, Calhoun DA: Effects of dietary sodium reduction on blood pressure in subjects with resistant hypertension: results from a randomized trial. Hypertension 54:475–481, 2009 [DOI] [PMC free article] [PubMed] [Google Scholar]
- 7.Ekinci EI, Thomas G, MacIsaac RJ, Johnson C, Houlihan C, Panagiotopoulos S, Premaratne E, Hao H, Finch S, O’Callaghan C, Jerums G: Salt supplementation blunts the blood pressure response to telmisartan with or without hydrochlorothiazide in hypertensive patients with type 2 diabetes. Diabetologia 53:1295–1303, 2010 [DOI] [PubMed] [Google Scholar]
- 8.Uzu T, Sakaguchi M, Yokomaku Y, Kume S, Kanasaki M, Isshiki K, Araki S, Sugimoto T, Koya D, Haneda M, Kashiwagi A: Effects of high Na intake and diuretics on the circadian rhythm of blood pressure in type 2 diabetes patients treated with and ARB. Clin Exp Neph 13:300–306, 2009 [DOI] [PubMed] [Google Scholar]
- 9.Vedovato M, Lepore G, Coracina A, Dodesini AR, Jori E, Tiengo A, Del Prato S, Trevisan R: Effect of sodium intake on blood pressure and albuminuria in type 2 diabetic patients: the role of insulin resistance. Diabetologia 47:300–330, 2004 [DOI] [PubMed] [Google Scholar]
- 10.Bakris GL, Smith A: Effects of sodium intake in patients with diabetic nephropathy treated with long-acting calcium antagonist. Ann Intern Med 25:201–204, 1996 [DOI] [PubMed] [Google Scholar]
- 11.Forte JG, Pereira Miguel JM, Pereira Miguel MJ, de Padua F, Rose G: Salt and blood pressure: a community trial. J Hum Hypertens 3:179–184, 1989 [PubMed] [Google Scholar]
- 12.Sacks FM, Svetkey LP, Vollmer WM, Appel LJ, Bray GA, Harsha D, Obarzanek E, Conlin PR, Miller ER, Simons-Morton DG, Karanja N, Lin P, Aickin M, Most-Windhauser MM, Moore TJ, Proschan MA, Cutler JA; DASH-Sodium Collaborative Research Group: Effects on blood pressure of reduced dietary sodium and the Dietary Approaches to Stop Hypertension (DASH) diet. N Engl J Med 344:3–10, 2001 [DOI] [PubMed] [Google Scholar]
- 13.American Heart Association : The American Heart Association’s Diet and Lifestyle Recommendations. Available from http://www.heart.org/HEARTORG/GettingHealthy/NutritionCenter/HealthyDietGoals/Dictionary-of-Nutrition_UCM_305855_Article.jsp. Accessed 30 November 2010
- 14.Centers for Disease Control and Prevention : Application of lower sodium intake recommendations to adults. United States, 1999–2006. MMWR Morb Mortal Wkly Rep 58:281–283, 2009. Available from http://www.cdc.gov/mmwr/preview/mmwrhtml/ mm5811a2.htm. Accessed 4 December 2012 [PubMed] [Google Scholar]
- 15.Centers for Disease Control and Prevention : Usual sodium intakes compared with current dietary guidelines. United States, 2005–2008. MMWR Morb Mortal Wkly Rep 60:1413–1417, 2011. Available from http://www.cdc.gov/mmwr/preview/mmwrhtml/mm6041a1.htm. Accessed 4 December 2012 [PubMed] [Google Scholar]
- 16.National Institutes of Health : White House Conference on Food, Nutrition, and Health. Washington D.C, U.S. Government Printing Office, 1969 [Google Scholar]
- 17.Institute of Medicine : Strategies to reduce sodium intake in the United States. Washington, D.C, The National Academies Press, 2010 [Google Scholar]
- 18.Regmi A, Gehlhar M: Processed food trade pressured by evolving global supply chains. Amber Waves 3:12–19, 2005 [Google Scholar]
- 19.Centers for Disease Control and Prevention : Selected health conditions and risk factors: United States, selected years 1988–1994 through 2009–2010. Available from http://www.cdc.gov/nchs/data/hus/hus11.pdf#069. Accessed 3 September 2012
- 20.Egan BM, Zhao Y, Axon RN: US trends in prevalence, awareness, treatment, and control of hypertension, 1988–2008. JAMA 303:2043–2050, 2010 [DOI] [PubMed] [Google Scholar]
- 21.Chen G, McAlister FA, Walker RL, Hemmelgarn BR, Campbell NR: Cardiovascular outcomes in Framingham participants with diabetes: the importance of blood pressure. Hypertension 57:891–897, 2011 [DOI] [PMC free article] [PubMed] [Google Scholar]
- 22.Uzu T, Kida Y, Yamauchi A, Kume S, Isshiki K, Araki S, Koya D, Haneda M, Kashiwagi A, Maegawa H, Kikkawa R: The effects of blood pressure control levels on the renoprotection of type 2 diabetic patients without overt proteinuria. Am Soc Hypertens 6:124–131, 2012 [DOI] [PubMed] [Google Scholar]
- 23.Tozawa M, Iseki K, Iseki C, Kinjo K, Ikemiya K, Takishita S: Blood pressure predicts risk of developing end-stage renal disease in men and women. Hypertension 41:1341–1345, 2003 [DOI] [PubMed] [Google Scholar]
- 24.Sevick MA, Zickmund S, Korytkowski M, Piraino B, Sereika S, Mihalko S, Snetselaar L, Stumbo P, Hausmann L, Ren D, Marsh R, Sakraida T, Gibson J, Safaien M, Starrett TJ, Burke LE: Design, feasibility, and acceptability of an intervention using personal digital assistant–based self-monitoring in managing type 2 diabetes. Contemp Clin Trials 29:396–409, 2008 [DOI] [PMC free article] [PubMed] [Google Scholar]
- 25.Sevick MA, Korytkowski M, Stone RA, Piraino B, Ren D, Sereika S, Wang Y, Steenkiste A, Burke LE: Biophysiologic outcomes of the Enhancing Adherence in Type 2 Diabetes (ENHANCE) trial. J Acad Nutr Diet 112:1147–1157, 2012 [DOI] [PMC free article] [PubMed] [Google Scholar]
- 26.Rigler SK, Studenski S, Wallace D, Reker DM, Duncan PW: Co-morbidity adjustment for functional outcomes in community dwelling older adults. Clin Rehab 16:420–428, 2002 [DOI] [PubMed] [Google Scholar]
- 27.Gillis BP, Caggiula AW, Jones FL, Maurer E, Meehan RM, Yamamoto ME: MDRD Study: features of the nutrient database and analysis system for the Modification of Diet in Renal Disease Study. Control Clin Trials 15:44–58, 1994 [DOI] [PubMed] [Google Scholar]
- 28.Ekinci EI, Cheong KY, Dobson M, Premaratne E, Finch S, MacIsaac RJ, Jerums G: High sodium and low potassium intake in patients with type 2 diabetes. Diabet Med 19:1401–1408, 2010 [DOI] [PubMed] [Google Scholar]
- 29.Drenowski A: The cost of US foods as related to their nutritive value. Am J Clin Nutr 92:1181–1188, 2010 [DOI] [PMC free article] [PubMed] [Google Scholar]
- 30.Paeratakul A, Lovejoy JC, Ryan DH, Bray GA: The relation of gender, race and socioeconomic status to obesity and obesity comorbidities in a sample of US adults. Int J Obes Relat Metab Disord 26:1205–1210, 2002 [DOI] [PubMed] [Google Scholar]
- 31.Rehm CD, Monsivais P, Drewnoski A: The quality and monetary value of diets consumed by adults in the United States. Am J Clin Nutr 94:1333–1339, 2011 [DOI] [PMC free article] [PubMed] [Google Scholar]
- 32.Bruemmer B, Krieger J, Saelens BE, Chan N: Energy, saturated fat, and sodium were lower in entrees at chain restaurants at 18 months compared with 6 months following the implementation of mandatory menu labeling regulation in King County, Washington. J Acad Nutr Diet 112:1169–1176, 2012 [DOI] [PubMed] [Google Scholar]
- 33.Lawes CMM, Vander Hoorn S, Rodgers A: Global burden of blood pressure related disease. Lancet 371:1513–1518, 2008 [DOI] [PubMed] [Google Scholar]
- 34.Institute of Medicine : Sodium intake in populations: assessment of evidence. Washington, D.C, National Academy Press, 2013. Available from http://www.nap.edu/catalog.php?record_id=18311. Accessed October 2013 [DOI] [PMC free article] [PubMed] [Google Scholar]
- 35.Evert AB, Alison B, Boucher JL, Cypress M, Dunbar SA, Franz MJ, Mayer-Davis EJ, Neumiller JJ, Nwankwo R, Verdi CL, Urbanski P, Yancey WS, Jr: American Diabetes Association position statement: nutrition therapy for the management of adults with diabetes. Diabetes Care 36: 3821–3842, 2013 [DOI] [PMC free article] [PubMed] [Google Scholar]
- 36.Franz MJ, Powers MA, Leontos C, Holzmeister LA, Kulkarni K, Monk A, Wedel N, Gradwell E: The evidence for medical nutrition therapy for type 1 and type 2 diabetes in adults. J Am Diet Assoc 110:1852–1889, 2010 [DOI] [PubMed] [Google Scholar]
- 37.U.S. Department of Health and Human Services , Centers for Medicare & Medicaid Services: Medicare Coverage Issues Manual. Transmittal 154, section 80–83, 2002
- 38.Mattes RD, Donnelly D: Relative contributions of dietary sodium sources. J Am Coll Nutr 10:383–193, 1991 [DOI] [PubMed] [Google Scholar]
- 39.Azadbakht L, Fard NR, Karimi M: Effects of the Dietary Approaches to Stop Hypertension (DASH) eating plan on cardiovascular risks among type 2 diabetic patients: a randomized crossover clinical trial. Diabetes Care 34:55–57, 2011 [DOI] [PMC free article] [PubMed] [Google Scholar]
- 40.Food Standards Agency : Salt levels continue to fall. Available from http://www.food.gov.uk/news-updates/news/2008/jul/sodiumrep08. Accessed 23 September 2012
- 41.Food Standards Agency : Agency welcomes US salt targets, 2010. Available from http://www.food.gov.uk/news-updates/news/2010/jan/ussalttargets. Accessed 23 September 2012
- 42.National Salt Reduction Initiative : Statement of commitment by health organizations and public agencies. Available from http://www.nyc.gov/html/doh/downloads/pdf/cardio/nsri-partners.pdf. Accessed 10 September 2012
- 43.Smith-Spangler CM, Juusola JL, Enns EA, Owens DK, Garber AM: Population strategies to decrease sodium intake and the burden of CVD: a cost-effectiveness analysis. Ann Intern Med 152:481–487, 2010 [DOI] [PubMed] [Google Scholar]
- 44.Centers for Disease Control and Prevention : Where’s the sodium? CDC Vital Signs. Available from http://www.cdc.gov/vitalsigns/sodium/index.html. Accessed 10 September 2012 [Google Scholar]
- 45.Palar K, Sturm R: Potential societal savings from reduced Na consumption in the US adult population. Am J Health Promot 24:49–57, 2009 [DOI] [PubMed] [Google Scholar]
- 46.Thompson F, Subar A: Dietary assessment methodology. In Nutrition in the Prevention and Treatment of Disease. 2nd ed Coulston AM, Boushey CJ, Eds. San Diego, Calif, Elsevier Academic Press, 2008, p. 3–39 [Google Scholar]
- 47.Wrieden W, Peace H, Armstrong J, Barton K: A short review on dietary assessment methods used in national and Scottish research studies. Working Group on Monitoring Scottish Dietary Targets Workshop, 2003. Available from http://multimedia.food.gov.uk/multimedia/pdfs/scotdietassessmethods.pdf. Accessed 1 February 2014 [Google Scholar]