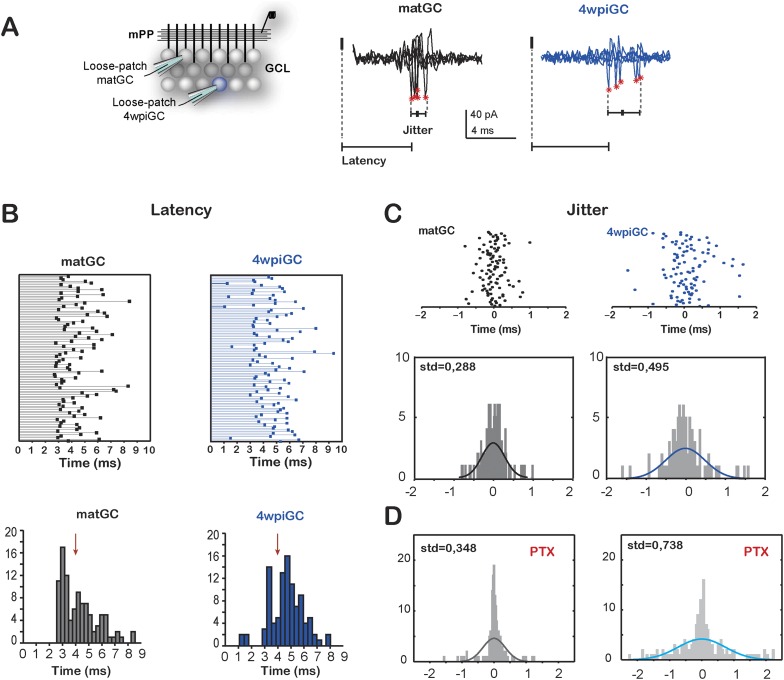
Figure 5. Temporal fidelity in mature and immature GC.
(A) Recording configuration. Left, the mPP was stimulated at an intensity of 50% fEPSP. Recordings were performed from 4wpiGC and matGC in loose patch configuration. Right, representative traces of evoked action potentials in response to stimulation of the mPP. The latency from the stimulation artifact to action potentials (asterisks) and spiking jitter and were calculated for matGC (black) and 4wpiGC (blue). (B) Top, latencies measured in 100 spikes from matGC (black) and 4wpiGC (blue). Bottom, distribution of latencies binned along 20 bins. The red arrow denotes the average pop spike time of all included experiments (4.36 ± 0.19 ms). (C) Top, jitter measured as the time of action potential occurrence relative to the mean spike timing of 3–5 trials. Bottom, jitter distribution in matGC and 4wpiGC; solid lines represent a normal fitting lines. Distribution is wider in 4wpiGC than in matGC (p < 0.001, two-sample F-test for equal variances). N (matGC) = 114 spikes from 8 cells; N (4wpiGC) = 96 spikes from 6 cells. Std: standard deviation. (D) Jitter distribution in matGC and 4wpiGC in the presence of picrotoxin (PTX); solid lines represent normal fitting lines. Distribution is wider in 4wpiGC than in matGC (p < 0.001, two-sample F-test for equal variances) and is wider in the presence of PTX for both matGC (p < 0.05, two-sample F-test for equal variances) and 4wpiGC (p < 0.001, two-sample F-test for equal variances). N (matGC) = 142 spikes of 9 cells; N (4wpiGC) = 170 spikes from 10 cells.

