

Abstract
BACKGROUND
Estrogen receptor (ER) remains one of the most important biomarkers for breast cancer subtyping and prognosis, and comparative genome hybridization has greatly contributed to the understanding of global genetic imbalance. The authors used single-nucleotide polymorphism (SNP) arrays to compare overall copy number aberrations (CNAs) as well as loss of heterozygosity (LOH) of the entire human genome in ER-positive and ER-negative breast carcinomas.
METHODS
DNA was extracted from frozen tumor sections of 21 breast carcinoma specimens and analyzed with a proprietary 50K XbaI SNP array. Copy number and LOH probability values were derived for each sample. Data were analyzed using bioinformatics and computational software, and permutation tests were used to estimate the significance of these values.
RESULTS
There was a global increase in CNAs and LOH in ER-negative relative to ER-positive cancers. Gain of the long arm of chromosome 1 (1q) and 8q were the most obvious changes common in both subtypes: An increase in the chromosome 1 short arm (1p)/1q ratio was observed in ER-negative samples, and an increased 16p/16q ratio was observed in ER-positive samples. Significant CNAs (adjusted P<.05) in ER-negative relative to ER-positive tumors included 5q deletion, loss of 15q, and gain of 2p and 21q. Copy-neutral LOH (cnLOH) common to both ER-positive and ER-negative samples included 9p21, the p16 tumor suppressor locus, and 4q13, the RCHY1 (ring finger and CHY zinc finger domain-containing 1) oncogene locus. Of particular interest was an enrichment of 17q LOH among the ER-negative tumors, potentially suggesting breast cancer 1 gene (BRCA1) mutations.
CONCLUSIONS
SNP array detected both genetic imbalances and cnLOH and was capable of discriminating ER-negative breast cancer from ER-positive breast cancer.
Keywords: breast cancer, estrogen receptor-negative, copy number, loss of heterozygosity, acquired uniparental disomy, single nucleotide polymorphism comparative genome hybridization
Genetic instability is common in breast cancer and is associated with cancer progression and prognosis.1 By using comparative genome hybridization (CGH), genetic imbalance in the form of copy number aberrations (CNAs) has been identified in the majority of patients with breast cancer.2,3 Studies have demonstrated frequent gains of the long arm of chromosome 1 (1q) and 8q and common losses of 5q and 16q, among others.4 Most earlier studies used the lower resolution metaphase CGH or bacteria artificial chromosome (BAC) array CGH.5–7 Recent studies have used higher resolution tiling BAC array or oligo array CGH, allowing for fine mapping of CNAs at the gene level.8,9 Single-nucleotide polymorphism (SNP) arrays offer high-resolution fine mapping of CNAs and also uniquely allow for the identification of genomic regions of loss of heterozygosity (LOH) without copy number loss, also known as somatic or acquired uniparental disomy (aUPD).10,11 This may arise from segmental deletions and subsequent replacement of the lost fragment through gene conversion or mitotic recombination during carcinogenesis.11 LOH/aUPD in cancer can lead to duplication of an activating mutation, homozygosity for a cancer-prone minor allele, duplication or deletion of a methylation pattern that impacts gene expression, or duplication of an allele that carries a deleted region, thus obtaining a homozygous deletion.11
Estrogen receptor (ER) status remains the most important biomarker for breast cancer subtyping and prognosis. Approximately 70% to 80% of primary breast carcinomas express ER (ER-positive) and are associated with a relatively good prognosis; currently, hormone therapy is targeted only to this group. ER-negative breast cancers, conversely, are more aggressive, and patients with these tumors have more limited treatment options, a higher recurrence rate, and an earlier onset of relapse. The genetic basis of this distinction remains enigmatic.
Distinct CGH profiles have been described for different breast cancer histopathology types, for various grades of differentiation, and for different prognoses.4 Comparison of genetic copy number differences based on ER status may be extrapolated from a few studies, such as BAC array CGH on flow-sorted breast cancer cells based on histologic subtype and ER status7; oligo-CGH arrays for breast cancers, including triple-negative cancers,9 and CGH on familial and sporadic breast cancers.12,13 LOH using 10K SNP arrays was reported on ER-positive breast cancers.14 However, there have been few published studies directly comparing genomic imbalance in ER-positive and ER-negative breast carcinomas that assessed both CNA and cnLOH. The closest are 2 studies that compared basal-like tumors with other molecular subtypes.15,16 Therefore, we applied high-resolution SNP-array CGH to compare and contrast the genomic differences between ER-positive and ER-negative breast carcinomas.
MATERIALS AND METHODS
Participants
Breast cancer specimens from 11 patients with ER-positive tumors and from 10 patients with ER-negative tumors were collected in a deidentified manner with approval from the University of Connecticut Health Center Institutional Review Board.
Microarray Analysis
To enrich tumor cells, DNA was extracted from frozen tumor sections cored from histologically distinct regions determined by hematoxylin and eosin (H&E) stain. In total, 21 breast carcinoma specimens were analyzed. DNA (250 ng) was digested with the XbaI restriction enzyme, amplified by ligation-mediated polymerase chain reaction (PCR), and hybridized to the 50K XbaI SNP array (Affymetrix, Santa Clara, Calif) according to the manufacturer’s protocol. Copy number state, log2 ratio, and LOH probability values were derived for each sample, interrogating ≈58,000 SNPs, with CNA Tool 4 (CNAT4) and Genotyping Console (GTC) 3.0.1 Affymetrix software using the XbaI dataset of 46 female HapMap project samples as reference.
Verification by Fluorescence In Situ Hybridization
Fluorescence in situ hybridization (FISH) was performed with the chromosome 5 probes LSI D5S721,D5S23/EGR1 (Abbott Molecular, North Chicago, Ill), which target the D5S721/D5S23 locus on the short arm and the early growth response gene 1 (EGR1) locus on the long arm, as described previously.17 Results were compared with copy number calls from the microarray analysis.
Statistical Analysis
Data were analyzed using the R programming language (R Development Core Team, Auckland, New Zealand) and Bioconductor (Bioconductor Core Team, Fred Hutchison Cancer Research Center, Seattle, Wash). Two approaches were taken to assess differences between groups. Genomic identification of significant targets in cancer (GISTIC)18 analysis identifies chromosomal segments in which CNAT4-derived, smoothed log2 ratio values are approximately unchanging in all samples and examines these segments for differential amplification or deletion between groups. Segments are identified by stratifying sample values using the GLAD Bioconductor package19 to identify breakpoints in the genomic profile and to find the set of disjoint segments across samples. This analysis calculates the average between-group difference in log2 ratios of selected probes in a segment. Probe values are selected using a global criterion, such that median-centered samples with log2 ratios >0.1 (for the assessment of amplification) or <−0.1 (for the assessment of deletion) are retained. Each threshold excludes approximately 80% of the log2 ratios. The “z-statistic” analysis uses GTC-derived log2 ratios and calculates a between-group t statistic for each probe; for each segment, it sums the t statistics and divides by the square root of the number of probes. It uses unsmoothed, log2 ratio values with a moderated t statistic calculated using the limma package20; segment regions are those determined in the GISTIC analysis. For both the GISTIC analysis and the z-statistic method, significance is assessed through the permutation (N = 10,000) of treatment labels, resulting in nominal and multiple-comparison adjusted (for the false discovery rate, using the Benjamini-Hochberg method) P values. Broadly, the GISTIC analysis identifies segments in which the extreme samples exhibit differential amplification/deletion; the z statistic identifies segments in which all samples considered together support amplification/deletion.
For LOH analysis, qualitative assessment of all LOH regions and copy-neutral LOH (cnLOH) (ie, LOH without alterations in copy number) was performed for each chromosome. Regions of cnLOH >3 megabases (Mb) were identified and compared between the analysis groups. Quantification of the statistical differences of LOH fraction between ER-positive and ER-negative groups was performed by using Pearson chi-square tests with Yates continuity correction.
RESULTS
Demographics and Clinical Information
The demographic and clinical data from the 21 patients who provided samples for this study are summarized in Table 1. The average age (±standard deviation [SD]) was 57 ± 14.4 years (range, 41–91 years; median, 56 years). The average tumor size was 2.0 ± 0.97 cm (range, 1.0–5.0 cm; median, 1.8 cm). Only 2 samples had amplification of the human epidermal growth factor 2 (HER2; ERBB2) gene, and both were ER-negative. Most samples were invasive ductal carcinoma, and two samples were ER-positive invasive lobular carcinoma. Most tumors were high-grade.
Table 1.
Clinical Information on the Breast Cancer Specimens Analyzed
| ID | Age, y | HER2 Status | ER Status | PR Status | Lymph Node Status | Tumor Type | Tumor Size, cm | Nottingham Grade |
|---|---|---|---|---|---|---|---|---|
| 10 | 49 | N | Negative | Negative | Negative | Ductal | 1.5 | III |
| 28 | 50 | N | Negative | Negative | Negative | Ductal | 2.2 | III |
| 30 | 45 | N | Negative | Negative | Negative | Ductal | 2.4 | III |
| 34 | 60 | A | Negative | Negative | Negative | Ductal | 5.0 | III |
| 36 | 45 | N | Negative | Negative | Negative | Ductal | 1.5 | III |
| 11 | 30 | N | Negative | Negative | Negative | Ductal | 1.0 | III |
| 25 | 80 | N | Negative | Negative | Positive | Ductal | 3.2 | III |
| 32 | 71 | N | Negative | Negative | Negative | Ductal | 1.8 | II |
| 52 | 56 | N | Negative | Negative | Negative | Ductal | 1.7 | III |
| 54 | 58 | A | Negative | Negative | Positive | Ductal | 2.2 | III |
| 40 | 41 | N | Positive | Positive | Positive | Ductal | 2.5 | III |
| 42 | 55 | N | Positive | Positive | Positive | Ductal | 1.5 | II |
| 20 | 70 | N | Positive | Positive | Negative | Ductal | 1.0 | III |
| 27 | 60 | N | Positive | Positive | Positive | Ductal | 1.7 | II |
| 29 | 66 | N | Positive | Positive | Negative | Ductal | 2.8 | II |
| 37 | 54 | N | Positive | Positive | Positive | Ductal | 3.2 | III |
| 53 | 36 | N | Positive | Positive | Positive | Ductal | 1.9 | I |
| 59 | 52 | N | Positive | Positive | Negative | Ductal | 2.0 | II |
| 60 | 91 | N | Positive | Positive | Negative | Lobular | 1.0 | II |
| 61 | 66 | N | Positive | Negative | Negative | Lobular | 1.1 | II |
| 62 | 65 | N | Positive | Positive | Negative | Ductal | 1.0 | II |
ID indicates identification number; HER2, human epidermal growth factor receptor 2; ER, estrogen receptor; PR, progesterone receptor; N, nonamplified; A, amplified.
Genetic Heterogeneity of Breast Cancer Specimens
Breast carcinomas are markedly heterogeneous, as reflected by distribution of the log2 ratio of each sample illustrated in Figure 1, with broad versus narrow distribution (eg, s10− vs s11−) and bimodality (eg, s29+). Enrichment of the tumor cells in the cored specimen was confirmed by comparing H&E-stained tissue sections before and after coring. Heterogeneity in the log2 ratio did not appear to correlate with the degree of tumor cell enrichment (data not shown).
Figure 1.

The genetic heterogeneity of breast cancer specimens is illustrated. The distribution of the log2 ratio of each sample is shown. Each point represents a probe; data were down-sampled to 10,000 markers per sample.
Correlation Between Chromosome 5 FISH and Array CGH Results
For quality control, we determined whether the array results correctly identified the chromosome 5 genetic imbalance in ER-negative samples, as reported previously.17 Of 8 samples that were examined by FISH analysis, the chromosome 5 long arm/short arm (5q/5p) copy number ratio correlated well in all samples, including 1 ER-negative sample that unexpectedly had normal copy numbers of both 5p and 5q by array CGH, and FISH confirmed a 5q/5p ratio of 0.94 without an imbalance. The remaining 7 ER-negative samples exhibited 5q/5p ratios <0.70 (range, 0.36–0.68) by FISH and similar results by array CGH. These observations suggest that SNP array technology was a reliable method with which to identify gene CNAs in this study.
Copy Number Differences Between ER-Positive and ER-Negative Samples
The most obvious and frequent CNAs at the global level were gain of 1q and 8q regardless of ER status (Fig. 2). Overall, there were remarkably more CNAs in the ER-negative group than in the ER-positive group (Fig. 2).
Figure 2.

The copy number state of all samples in the study is illustrated. Each panel represents a chromosome, with chromosomes 1 through 12 shown on the left (from bottom to top), chromosomes 13 through 22 shown on the right, and chromosome X shown at the top. Samples within a panel include estrogen receptor (ER)-positive samples (below the dashed blue line) and ER-negative samples (above the dashed line). Colors indicate copy number status (purple, deletion; red, duplication); greater color saturation indicates greater copy number aberration.
Two approaches, GISTIC analysis and the z-statistic method, were used as detailed above (see Materials and Methods, above) to identify differential CNAs between the ER-positive and ER-negative groups. Statistically significant regions of interest with multiple-comparison, adjusted P values <.05 were identified by using both methods. The data are summarized in Figure 3A, and specific examples of individual chromosomes are provided in Figure 3B,C.
Figure 3.

Statistical test results are illustrated for differential genomic copy number aberrations in estrogen receptor (ER)-negative relative to ER-positive breast carcinomas. The red bars present the genomic identification of significant targets in cancer (GISTIC) analysis of gained segments, and blue bars indicate the GISTIC analysis of deleted segments. Light and dark shades of gray present the z-statistic results of gained and deleted segments, respectively. The red dashed line marks multiple-comparison, adjusted P values (1 – pAdj) of .05. (A) This is an overview of the adjusted P values for all genomic segments from the GISTIC and z-statistic analyses. The x-axis depicts the genomic coordinates arranged in chromosome number order with the short arm (p) to the left and the long arm (q) to the right within each chromosome. The y-axis represents the results from testing the difference of log2 ratios between ER-positive cancers and ER-negative cancers, with the values representing (1 – pAdj) times the test result’s sign; the sign represents the direction of the 2-tailed statistical test result, in which a positive sign (upper half) indicates relative gain in ER-positive samples compared with ER-negative samples (ie, a relative loss in ER-negative samples), and a negative sign (lower half) indicates relative loss in ER-positive samples (ie, relative gain in ER-negative samples). Values near ±1 are statistically highly significant, whereas values near 0 are not. (B) This is a detailed view of the adjusted P values of chromosome 1 genomic segments. (C) This is a detailed view of the adjusted P values of chromosome 16 genomic segments.
By using GISTIC analysis, many genomic regions were identified as significant. This method uses only log2 ratios >0.1 in copy gain analysis and <−0.1 in deletion analysis. Samples with the log2 ratio excluded by the threshold at a given locus are not considered. The regions that gained significantly in ER-negative samples relative to ER-positive samples (represented by red bars in Fig. 3A outside the P = .05 line) were localized on chromosomes 1p, 2p, 2q, 3q, 4p, 4q, 6q, 7q, 9p, 9q, 10p, 10q, 11q, 12q, 13q, 14q, 15q, 17p, 18p, 18q, 19p, 19q, 21q, 22q, and Xq. The regions that were deleted significantly in ER-positive samples relative to ER-negative samples (represented by blue bars outside the P = .05 line in Fig. 3A) were localized to chromosomes 1p, 1q, 2p, 2q, 3q, 6p, 6q, 7q, 8q, 10p, 10q, 12q, 13q34, 17p11.2, 18q, 19p12, 20p, 20q, and 21q.
By using the z-statistic method, the significant genomic regions that discriminated ER-negative samples from ER-positive samples (represented by gray bars outside the P = .05 line in Fig. 3A) included 2p and 21q gains in ER-negative cancer relative to ER-positive cancer and relative deletions of 5q and 15q in ER-negative cancer. Differential regions with high likelihood (ie, P values close to .05) also were apparent. The regions that were deleted more in ER-negative cancers (or that gained more in ER-positive cancers) included 1q, 3p, 4p, 4q, 9q, 11q, 12q, 14q, 16p, and 17p; the regions that gained more in ER-negative cancers (or that were deleted more in ER-positive cancers) included 1p, 2q, 3q, 5p, 6q, 7q, 10p, 11q, 13q, 16q, and 18p. Figure 3B illustrates the high probability of differential gain of 1q in ER-positive breast cancer; similarly, Figure 3C illustrates the high probability of differential loss of 16q and gain of 16p in ER-positive cancers relative to ER-negative cancers.
LOH Differences Between ER-Positive and ER-Negative Samples
Strikingly more loci demonstrated LOH in ER-negative samples than in ER-positive samples (17% LOH/genome in ER-negative samples vs 6.0% LOH/genome in ER-positive samples; P<2.2e-16), and 90% were because of deletions (ie, copy numbers <2). The remaining cnLOH regions also were more frequent in ER-negative samples than in ER-positive samples. An analysis of recurrent cnLOH regions >3 Mb in size, which were present in at least 2 samples, revealed intriguing results. Five ER-negative samples exhibited LOH that encompassed the breast cancer 1 (BRCA1) gene at 17q21.31, and 3 spanned almost the entire long arm of chromosome 17 (Fig. 4). Another recurrent cnLOH region that was specific to ER-negative samples was 7q22: The LOH extended to the entire long arm of chromosome 7, mostly because of deletions except for 7q22, which was true cnLOH. Regions of cnLOH common to both ER-positive and ER-negative samples included 4q13, 9p21, and 10q21 (upstream of the phosphatase and tensin homolog [PTEN] gene). Regions of cnLOH that were specific to ER-positive samples included 8q11, 11q13, and the 12 pericentric region.
Figure 4.
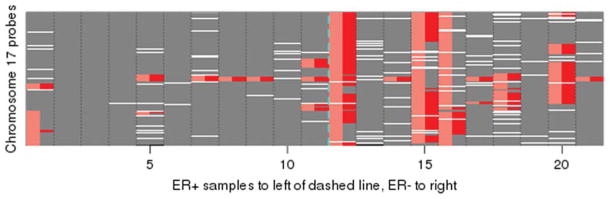
Copy-neutral loss of heterozygosity (cnLOH) of chromosome 17 is more frequent in estrogen receptor (ER)-negative (ER−) breast cancer (right of vertical blue dashed line) than in ER-positive (ER+) breast cancer (left of vertical blue dashed line). LOH without reduction in copy number in the 21 sample dataset is indicated in red; and overall LOH, including that associated with deletions, is indicated in pink. Missing values are indicated in white (4.3% genome-wide). Smaller genome coordinates representing the short arm are shown on the bottom.
DISCUSSION
In the current study, we investigated the feasibility of SNP-array CGH technology for detecting genomic differences between ER-negative and ER-positive breast carcinomas, including both CNA and LOH. Several statistically significant genomic regions with multiple-comparison, adjusted P values <.05 were identified with both of the methods that we used. GISTIC analysis is intended to identify more extreme sample values, whereas the z-statistic method takes all sample values into consideration. The findings were consistent overall with reports in the literature.7,9,12,14,15,21 Of great interest was the discovery of large cnLOH genomic regions that were associated differentially with ER status and were common to both groups.
Reliability of the array results was confirmed by assessing chromosome 5p and 5q copy number imbalances with FISH analysis in a subset of samples. Common aberrations that were reported previously, including gain of 1q and 8q, also were observed in the majority of the patients in our cohort. The amount of stromal and other normal tissues was kept at a minimum with the use of coring and did not appear to hamper the detection of abnormalities.
Many published CGH studies grouped their samples based on the gene-expression profiling analysis classification: luminal A, luminal B, basal-like, ERBB2, and normal-like carcinomas.15,22,23 It is necessary to adopt the accepted assumption that breast cancer subtypes derived from ER-negative cancer stem cells include basal-like, ERBB2, and luminal B24 carcinomas when comparing our data with data from other studies. This is not a truly direct comparison, because published studies compared the variations in individual molecular subtypes rather than commonalities based solely on ER status.
Discriminating Chromosomal Loss and Representative Genes in the Differential Regions
Deletion of 5q has been associated unequivocally with ER-negative breast cancer.7,15,17,25 This finding is supported by data from the current study. Genes on 5q have been described extensively, and those descriptions are not repeated here.7,9,25
Similarly, 15q deletion is associated with ER-negative cancer, concordant with a recent study of triple-negative breast cancer using oligonucleotide arrays.9,26 These genomic events are large in scale; although the regions with significant P values are limited based on the analysis, the distribution of the P values clearly suggests the involvement of large regions on the chromosome arm (Fig. 3A). We observed large deletions in 60% to 70% of ER-negative tumors and in none of the ER-positive tumors. Conversely, 2 gene loci at 15q13.3, transient receptor potential cation channel, subfamily M, member 1 (TRPM1) and ovarian tumor (OUT) domain containing 7A (OTUD7A), in addition to adenosine triphosphate binding domain 4 (ATPBD4) at 15q14, had copy number gains in ER-positive samples. TRPM1 expression was correlated inversely with melanoma aggressiveness, suggesting that it suppresses melanoma metastasis.27 OTUD7A belongs to the deubiquitinating enzyme subfamily, which is characterized by an OTU domain.28
Relative copy number loss of 3p, 4p, 4q, 12q, 14q, and 17q in ER-negative breast cancer (Fig. 3A) also is supported by the literature.7,9,13,15 Deletions associated with ER-positive cancer are loss of 16q (spanning the E-cadherin gene locus) and 1p (Figs. 2, 3B,C), congruent with the literature.12,15,29–32 Several studies have suggested that patients who have 16q loss have a better prognosis.30,31,33 Downing et al used FISH analysis to confirm that lower q/p ratios of chromosome 16 are associated with lower grade breast cancers.29 Simultaneous 1q gain and 16q loss also was reported in ER-positive, low-grade tumors.34 We demonstrated that genetic imbalance of chromosome 1 in the form of reduced 1p/1q ratio is associated with ER-positive samples (Fig. 3A,B). Alignment of the 1p deleted region in all ER-positive samples demonstrated a minimally deleted region at 1p22.1 that encompassed the breast cancer antiestrogen resistance 3 (BCAR3) gene, which is important for breast cancer progression and tamoxifen resistance.35 Eight of 11 ER-positive samples (73%) displayed a deletion of this locus, whereas; only 2 of 10 ER-negative samples (20%) had the deletion. On the basis of our results (Fig. 3B,C), we propose that the 1p/1q ratio and the 16p/16q ratio should be considered as better distinguishing markers. Furthermore, we observed 16q cnLOH in an ER-positive sample accompanied by recurrent 16q loss. Candidate genes on 16q, including ataxia telangiectasia-mutated (ATM)/ATM-Rad3-related substrate Chk2-interacting zinc finger protein (ASCIZ) and CCR4-NOT transcription complex, subunit 1(CNOT1), a potential repressor of endogenous estrogen target genes, have been discussed previously.36
Discriminating Chromosomal Gain and Representative Genes
We observed preferential copy number gain of Xq, 1p, 3q, 5p, 6q, 7q, 10p, and 21q in ER-negative cancers and preferential gain of Xp, 1q and 11q (the cyclin D1/protein tyrosine phosphatase, receptor type, f polypeptide interacting protein α 1 [CCND1/PPFIA1] locus) in ER-positive breast cancers, consistent with the literature.7,15,17,26,37,38 Chin et al reported that patients who had amplification of 8p11–12, 11q13-14, 17q11-12, or 20q13 had a significantly poor disease-specific survival regardless of ER status.26 For the 8p11-12 region, we observed copy number gain of the transforming, acidic coiled-coil containing protein 1 (TACC1) locus in 60% of ER-negative samples but copy number loss in 37% of ER-positive samples; however, we had no SNP probes that covered the fibroblast growth factor 1 (FGFR1) gene. We also observed more 11q14 gain (different from the CCND1 locus) in ER-negative tumors. The 20q13.32 region, which encompasses the guanine nucleotide binding protein, α stimulating (GNAS) gene, indeed was gained in 90% of ER-negative samples compared with 40% of ER-positive samples in the current study. And the bone morphogenetic protein 7 (BMP7)/breast cancer amplified 1 (BCAS1) locus on 20q13 had loss in 50% ER-negative samples and in 36% of ER-positive samples.
We did not observe the preferential gain of 6p in ER-negative breast cancer that has been reported by others.3,9 Specifically, the E2F transcription factor 3 (E2F3) gene at 6p22.3 was gained in 29% of triple-negative tumors in the study by Andre et al; however, in our study, E2F3 was gained in 70% ER-negative samples and in 55% of ER-positive samples. Similarly, vascular endothelial growth factor (VEGF) copy number gain at 6p21.1 was identified in 34% of triple-negative tumors; but we found no copy number gain in either ER-negative samples or ER-positive samples.
It is noteworthy that the absence of ER expression was not correlated with copy number loss of the estrogen receptor 1 (ESR1) locus at 6q25.1, which encodes ERα and is represented by 8 SNP probes. ESR1 had no copy number gain in any of the ER-positive samples but had a deletion in 1 sample from this group. In the ER-negative group, 40% had a copy number gain, and 10% had a deletion. Melchor et al reported a similar trend, with a higher ESR1 deletion frequency in ER-positive samples.13
Other Potential Genes Distinguishing ER Status
Among the genes in the differential region of 2p16, the B-cell chronic lymphocytic leukemia/lymphoma 11A (BCL11A) locus was deleted in 5 of 11 ER-positive samples (45%) but was deleted in only 2 of 10 ER-negative samples (20%); instead, there was copy number increase in 6 ER-negative samples (60%). The BCL11A gene encodes a zinc-finger protein by its similarity to the mouse Bcl11a/Evi9 protein, the gene of which is a common site of retroviral integration in myeloid leukemia. At 2p22.3, the mediator of cell motility 1 (MEMO1) gene was deleted in 73% of ER-positive tumors but in only 40% of ER-negative tumors. It is believed that this gene product mediates ERBB2 signaling and is required for breast cancer cell migration. Another gene at 2p22.3, RAS guanyl-releasing protein 3 (RASGRP3), is a guanine nucleotide exchange factor (GEF), and GEF family members are the key link between cell surface receptors and RAS activation.39
We specifically examined several gene loci that reportedly distinguish ER status. It was believed that copy number loss of tumor protein 53 (TP53) at 17p13.1 and of PTEN at 10q23.31 was more prevalent in ER-negative breast cancer.9 Our data revealed a TP53 deletion in 70% of ER-negative tumors and in 27% of ER-positive tumors and a PTEN deletion in 50% ER-negative tumors and in 36% of ER-positive tumors. However, the confidence level was low; there was only 1 SNP probe to cover each of these 2 genes in the array.
LOH Regions That Discriminate ER Status
The most intriguing finding from this study was the identification of 17q LOH predominantly in ER-negative samples that spanned almost the entire long arm of chromosome 17, some because of 17q deletion and others because of cnLOH. Studies in acute myeloid leukemia have demonstrated an association between FMS-like tyrosine kinase 3 (FLT3) mutation and the observation of LOH at 13q, where FLT3 is localized, and have demonstrated that the region of LOH often stretches out to cover the entire chromosome arm.40 Studies of chronic lymphocytic leukemia have indicated that there is an association between TP53 mutation and the LOH of 17p, where TP53 is localized.10 Recently, somatic LOH at the neurofibromatosis type 1 (NF1) locus, caused predominantly by segmental UPD of large parts of chromosome arm 17q, was identified as the main mechanism in children with juvenile myelomonocytic leukemia and NF1.41 Because BRCA1 mutation carriers tend to develop ER-negative tumors,42 and because growing evidence supports the potentially critical role of BRCA1 in the arising of basal-like breast cancers,24 it is likely that 17q LOH suggests the presence of a BRCA1 mutation. This hypothesis will be tested in future studies.
An earlier study that compared sporadic basal-like cancers (BLC) with non-BLC using 10K SNP arrays reported that whole X-chromosome isodisomy (equivalent to cnLOH) is common in BCL, with coexisting isodisomy of either or both chromosome 14 and 17, but is rare in non-BLCs.16 However, we did not observe cnLOH of either chromosome X or 14 characteristic of ER-negative tumors in our cohort, although there appeared to be more ER-negative tumors with LOH because of loss of chromosome X or 14, and there was 1 ER-negative case with cnLOH of Xq (data not shown).
The second cnLOH region that was associated with ER-negative cancer was 7q22. This is the same region that is commonly deleted in poor prognosis myeloid leukemias. Candidate genes include plasminogen activator inhibitor 1 (PLANH1), asparagine synthetase gene (ASNS), and phosphoinositide-3-kinase gamma (PIK3CG), which plays an important role in maintenance of the structural and functional integrity of epithelia.
LOH in 9p was reported previously in ER-positive breast cancers.14 We identified it in both ER-positive and ER-negative cancers and also mapped it to the cyclin-dependent kinase inhibitor 2A (CDKN2A [p16]) locus. Therefore, the p16 gene pathway may be common in the pathogenesis of ER-positive and ER-negative breast cancer. Another LOH region on 4q13 that was observed in both ER-positive and ER-negative cancers encompassed several chemokine family members and epidermal growth factor family members. An oncogene in this region, ring finger and CHY zinc finger domain-containing 1 (RCHY1), has ubiquitin-protein ligase activity and binds p53 to promote the ubiquitin-mediated proteosomal degradation of p53.28
In conclusion, although our study was limited by the sample size, we demonstrated that this SNP array platform is reliable for assessing CNAs and is advantageous in offering information on cnLOH, which cannot be obtained with either BAC arrays or various oligo-CGH arrays. Higher density SNP arrays with several million features are now available. These will provide higher resolution and facilitate improved power in statistical analysis and the refinement of breakpoints of LOH regions or of regions with differentially altered copy number, and they will aid with the identification of candidate genes that play critical roles in the tumorigenesis of ER-negative versus ER-positive breast cancer.
Along with the successful application of array CGH studies for the identification of new oncogenes and tumor suppressor genes, array CGH analysis has been proposed for routine use in clinical testing to stratify diseases into clinically relevant subgroups with implications for prognosis and treatment of both hematologic malignancies and solid tumors.4,11 Routine clinical use of array CGH is now well accepted in the pediatric genetics field.43 Normal copy number variants are being cataloged. In the field of cancer prognosis and risk stratification, extensive clinical validation will be required to establish the clinical validity and utility of array CGH testing. Given the frequent genomic imbalance in breast cancer, correlation of array CGH results with disease outcome may provide further support for the use of this approach as a comprehensive risk-stratification tool in clinical practice. In particular, based on reports that genomic lesions in invasive carcinomas are very similar to those present in the original premalignant lesions, such as atypical hyperplasia or carcinoma in situ,4 and that genomic profiles of “normal” breast tissue samples taken 2 cm away from the primary tumors had the same genomic aberrations that were observed in the primary tumors,44 SNP array CGH may help with the early identification of high-risk patients.
Acknowledgments
We thank Karyn Ronski and Allison Tyropolis for DNA extraction and Anupinder Kaur for array analysis. We also thank Jianming Pei and Joseph Testa from Fox Chase Cancer Research Center for initial array processing and discussion. We are grateful to Dr. Runowicz for presubmission review and critique of the article.
Footnotes
CONFLICT OF INTEREST DISCLOSURES
This research was supported in part by an Institutional Research Grant from the American Cancer Society (IRG-06-002-01; principal investigator, Carolyn Runowicz, MD). A pilot study fund from this grant was awarded to M.F. M.M. and J.D. are supported by Grant NIH-P30-CA015704 from the National Institutes of Health.
References
- 1.Hanahan D, Weinberg RA. The hallmarks of cancer. Cell. 2000;100:57–70. doi: 10.1016/s0092-8674(00)81683-9. [DOI] [PubMed] [Google Scholar]
- 2.Albertson DG. Profiling breast cancer by array CGH. Breast Cancer Res Treat. 2003;78:289–298. doi: 10.1023/a:1023025506386. [DOI] [PubMed] [Google Scholar]
- 3.van Beers EH, Nederlof PM. Array-CGH and breast cancer [serial online] Breast Cancer Res. 2006;8:210. doi: 10.1186/bcr1510. [DOI] [PMC free article] [PubMed] [Google Scholar]
- 4.Climent J, Dimitrow P, Fridlyand J, et al. Deletion of chromosome 11q predicts response to anthracycline-based chemotherapy in early breast cancer. Cancer Res. 2007;67:818–826. doi: 10.1158/0008-5472.CAN-06-3307. [DOI] [PubMed] [Google Scholar]
- 5.Kallioniemi A, Kallioniemi OP, Sudar D, et al. Comparative genomic hybridization for molecular cytogenetic analysis of solid tumors. Science. 1992;258:818–821. doi: 10.1126/science.1359641. [DOI] [PubMed] [Google Scholar]
- 6.Pinkel D, Albertson DG. Array comparative genomic hybridization and its applications in cancer. Nat Genet. 2005;37(suppl):S11–S17. doi: 10.1038/ng1569. [DOI] [PubMed] [Google Scholar]
- 7.Loo LW, Grove DI, Williams EM, et al. Array comparative genomic hybridization analysis of genomic alterations in breast cancer subtypes. Cancer Res. 2004;64:8541–8549. doi: 10.1158/0008-5472.CAN-04-1992. [DOI] [PubMed] [Google Scholar]
- 8.Brommesson S, Jonsson G, Strand C, et al. Tiling array-CGH for the assessment of genomic similarities among synchronous unilateral and bilateral invasive breast cancer tumor pairs [serial online] BMC Clin Pathol. 2008;8:6. doi: 10.1186/1472-6890-8-6. [DOI] [PMC free article] [PubMed] [Google Scholar]
- 9.Andre F, Job B, Dessen P, et al. Molecular characterization of breast cancer with high-resolution oligonucleotide comparative genomic hybridization array. Clin Cancer Res. 2009;15:441–451. doi: 10.1158/1078-0432.CCR-08-1791. [DOI] [PubMed] [Google Scholar]
- 10.Hagenkord JM, Monzon FA, Kash SF, Lilleberg S, Xie Q, Kant JA. Array-based karyotyping for prognostic assessment in chronic lymphocytic leukemia: performance comparison of Affymetrix 10K2.0, 250K Nsp, and SNP6.0 arrays. J Mol Diagn. 2010;12:184–196. doi: 10.2353/jmoldx.2010.090118. [DOI] [PMC free article] [PubMed] [Google Scholar]
- 11.Maciejewski JP, Tiu RV, O’Keefe C. Application of array-based whole genome scanning technologies as a cytogenetic tool in haematological malignancies. Br J Haematol. 2009;146:479–488. doi: 10.1111/j.1365-2141.2009.07757.x. [DOI] [PubMed] [Google Scholar]
- 12.Fridlyand J, Snijders AM, Ylstra B, et al. Breast tumor copy number aberration phenotypes and genomic instability [serial online] BMC Cancer. 2006;6:96. doi: 10.1186/1471-2407-6-96. [DOI] [PMC free article] [PubMed] [Google Scholar]
- 13.Melchor L, Honrado E, Huang J, et al. Estrogen receptor status could modulate the genomic pattern in familial and sporadic breast cancer. Clin Cancer Res. 2007;13:7305–7313. doi: 10.1158/1078-0432.CCR-07-0711. [DOI] [PubMed] [Google Scholar]
- 14.Loo LW, Ton C, Wang YW, et al. Differential patterns of allelic loss in estrogen receptor-positive infiltrating lobular and ductal breast cancer. Genes Chromosomes Cancer. 2008;47:1049–1066. doi: 10.1002/gcc.20610. [DOI] [PMC free article] [PubMed] [Google Scholar]
- 15.Waddell N, Arnold J, Cocciardi S, et al. Subtypes of familial breast tumours revealed by expression and copy number profiling. Breast Cancer Res Treat. 2010;123:661–677. doi: 10.1007/s10549-009-0653-1. [DOI] [PubMed] [Google Scholar]
- 16.Richardson AL, Wang ZC, De Nicolo A, et al. X chromosomal abnormalities in basal-like human breast cancer. Cancer Cell. 2006;9:121–132. doi: 10.1016/j.ccr.2006.01.013. [DOI] [PubMed] [Google Scholar]
- 17.Ronski K, Sanders M, Burleson JA, Moyo V, Benn P, Fang M. Early growth response gene 1 (EGR1) is deleted in estrogen receptor-negative human breast carcinoma. Cancer. 2005;104:925–930. doi: 10.1002/cncr.21262. [DOI] [PubMed] [Google Scholar]
- 18.Beroukhim R, Getz G, Nghiemphu L, et al. Assessing the significance of chromosomal aberrations in cancer: methodology and application to glioma. Proc Natl Acad Sci U S A. 2007;104:20007–20012. doi: 10.1073/pnas.0710052104. [DOI] [PMC free article] [PubMed] [Google Scholar]
- 19.Hupe P, Stransky N, Thiery J-P, Radvanyl F, Barillot E. GLAD: Gain and Loss Analysis of DNA. R Statistical Package, Version 2.10.0. Paris, France: Institut Curie Bioinformatics Unit; 2010. [Google Scholar]
- 20.Smyth GK. Limma: linear models for microarray data. In: Gentleman VC, Dudoit S, Irizarry R, Huber W, editors. Bioinformatics and Computational Biology Solutions Using R and Bioconductor. New York: Springer; 2005. pp. 397–420. [Google Scholar]
- 21.Climent J, Garcia JL, Mao JH, Arsuaga J, Perez-Losada J. Characterization of breast cancer by array comparative genomic hybridization. Biochem Cell Biol. 2007;85:497–508. doi: 10.1139/O07-072. [DOI] [PubMed] [Google Scholar]
- 22.Perou CM, Sorlie T, Eisen MB, et al. Molecular portraits of human breast tumours. Nature. 2000;406:747–752. doi: 10.1038/35021093. [DOI] [PubMed] [Google Scholar]
- 23.Sorlie T, Perou CM, Tibshirani R, et al. Gene expression patterns of breast carcinomas distinguish tumor subclasses with clinical implications. Proc Natl Acad Sci U S A. 2001;98:10869–10874. doi: 10.1073/pnas.191367098. [DOI] [PMC free article] [PubMed] [Google Scholar]
- 24.Melchor L, Benitez J. An integrative hypothesis about the origin and development of sporadic and familial breast cancer subtypes. Carcinogenesis. 2008;29:1475–1482. doi: 10.1093/carcin/bgn157. [DOI] [PubMed] [Google Scholar]
- 25.Wang ZC, Lin M, Wei LJ, et al. Loss of heterozygosity and its correlation with expression profiles in subclasses of invasive breast cancers. Cancer Res. 2004;64:64–71. doi: 10.1158/0008-5472.can-03-2570. [DOI] [PubMed] [Google Scholar]
- 26.Chin K, DeVries S, Fridlyand J, et al. Genomic and transcriptional aberrations linked to breast cancer pathophysiologies. Cancer Cell. 2006;10:529–541. doi: 10.1016/j.ccr.2006.10.009. [DOI] [PubMed] [Google Scholar]
- 27.Carlson JA, Ross JS, Slominski A, et al. Molecular diagnostics in melanoma. J Am Acad Dermatol. 2005;52:743–775. doi: 10.1016/j.jaad.2004.08.034. [DOI] [PubMed] [Google Scholar]
- 28.University of Santa Cruz (UCSC) [Accessed June 15, 2010];UCSC Genome Bioinformatics. http://genome.ucsc.edu/
- 29.Downing TE, Oktay MH, Fazzari MJ, Montagna C. Prognostic and predictive value of 16p12.1 and 16q22.1 copy number changes in human breast cancer. Cancer Genet Cytogenet. 2010;198:52–61. doi: 10.1016/j.cancergencyto.2009.12.007. [DOI] [PubMed] [Google Scholar]
- 30.Hansen LL, Yilmaz M, Overgaard J, Andersen J, Kruse TA. Allelic loss of 16q23.2-24.2 is an independent marker of good prognosis in primary breast cancer. Cancer Res. 1998;58:2166–2169. [PubMed] [Google Scholar]
- 31.Nordgard SH, Johansen FE, Alnaes GI, et al. Genome-wide analysis identifies 16q deletion associated with survival, molecular subtypes, mRNA expression, and germline haplo-types in breast cancer patients. Genes Chromosomes Cancer. 2008;47:680–696. doi: 10.1002/gcc.20569. [DOI] [PubMed] [Google Scholar]
- 32.Natrajan R, Lambros MB, Geyer FC, et al. Loss of 16q in high grade breast cancer is associated with estrogen receptor status: evidence for progression in tumors with a luminal phenotype? Genes Chromosomes Cancer. 2009;48:351–365. doi: 10.1002/gcc.20646. [DOI] [PubMed] [Google Scholar]
- 33.Wennmalm K, Calza S, Ploner A, et al. Gene expression in 16q is associated with survival and differs between Sorlie breast cancer subtypes. Genes Chromosomes Cancer. 2007;46:87–97. doi: 10.1002/gcc.20392. [DOI] [PubMed] [Google Scholar]
- 34.Farabegoli F, Hermsen MA, Ceccarelli C, et al. Simultaneous chromosome 1q gain and 16q loss is associated with steroid receptor presence and low proliferation in breast carcinoma. Mod Pathol. 2004;17:449–455. doi: 10.1038/modpathol.3800059. [DOI] [PubMed] [Google Scholar]
- 35.van Agthoven T, Sieuwerts AM, Meijer-van Gelder ME, et al. Relevance of breast cancer antiestrogen resistance genes in human breast cancer progression and tamoxifen resistance. J Clin Oncol. 2009;27:542–549. doi: 10.1200/JCO.2008.17.1462. [DOI] [PubMed] [Google Scholar]
- 36.Vincent-Salomon A, Lucchesi C, Gruel N, et al. Integrated genomic and transcriptomic analysis of ductal carcinoma in situ of the breast. Clin Cancer Res. 2008;14:1956–1965. doi: 10.1158/1078-0432.CCR-07-1465. [DOI] [PubMed] [Google Scholar]
- 37.Dancau AM, Wuth L, Waschow M, et al. PPFIA1 and CCND1 are frequently coamplified in breast cancer. Genes Chromosomes Cancer. 2010;49:1–8. doi: 10.1002/gcc.20713. [DOI] [PubMed] [Google Scholar]
- 38.Pierga JY, Reis-Filho JS, Cleator SJ, et al. Microarray-based comparative genomic hybridisation of breast cancer patients receiving neoadjuvant chemotherapy. Br J Cancer. 2007;96:341–351. doi: 10.1038/sj.bjc.6603483. [DOI] [PMC free article] [PubMed] [Google Scholar]
- 39.Rebhun JF, Castro AF, Quilliam LA. Identification of guanine nucleotide exchange factors (GEFs) for the Rap1 GTPase. Regulation of MR-GEF by M-Ras-GTP interaction. J Biol Chem. 2000;275:34901–34908. doi: 10.1074/jbc.M005327200. [DOI] [PubMed] [Google Scholar]
- 40.Raghavan M, Lillington DM, Skoulakis S, et al. Genome-wide single nucleotide polymorphism analysis reveals frequent partial uniparental disomy due to somatic recombination in acute myeloid leukemias. Cancer Res. 2005;65:375–378. [PubMed] [Google Scholar]
- 41.Steinemann D, Arning L, Praulich I, et al. Mitotic recombination and compound-heterozygous mutations are predominant NF1-inactivating mechanisms in children with juvenile myelomonocytic leukemia and neurofibromatosis type 1. Haematologica. 2010;95:320–323. doi: 10.3324/haematol.2009.010355. [DOI] [PMC free article] [PubMed] [Google Scholar]
- 42.Loman N, Johannsson O, Bendahl PO, Borg A, Ferno M, Olsson H. Steroid receptors in hereditary breast carcinomas associated with BRCA1 or BRCA2 mutations or unknown susceptibility genes. Cancer. 1998;83:310–319. [PubMed] [Google Scholar]
- 43.Paciorkowski AR, Fang M. Chromosomal microarray interpretation: what is a child neurologist to do? Pediatr Neurol. 2009;41:391–398. doi: 10.1016/j.pediatrneurol.2009.05.003. [DOI] [PubMed] [Google Scholar]
- 44.Li J, Wang K, Li S, Timmermans-Wielenga V, et al. DNA copy number aberrations in breast cancer by array comparative genomic hybridization. Genomics Proteomics Bioinformatics. 2009;7(1–2):13–24. doi: 10.1016/S1672-0229(08)60029-7. [DOI] [PMC free article] [PubMed] [Google Scholar]