

Abstract
Rationale
Biomarkers for monitoring response to anti-tuberculosis treatment are needed. We explored immune markers previously published as having predictive capability for 8 week culture status in 39 adults enrolled in a clinical trial in Kampala, Uganda.
Methods
We consecutively selected 20 HIV-negative pulmonary TB subjects with positive cultures, and 19 subjects with negative cultures at the end of intensive phase therapy. At baseline and after 8 weeks, serum was assayed for nine cytokines and soluble cytokine receptors using multiplexed platforms or ELISA. We evaluated their association with week 8 culture status first using single-variable logistic models, then using cross-validated estimates of the C-statistic, a measure of discrimination, of candidate models including 2 or 3 analytes in addition to age.
Results
All but one analyte decreased from baseline to week 8 (all p<0.01). Individual biomarkers were not associated with 8 week culture status. Logistic models including increasing age, higher baseline soluble tumor necrosis factor receptor alpha 1 (sTNF-R1), and higher week 8 C-reactive protein (CRP) concentration classified subjects by culture status with up to 85% accuracy and acceptable discrimination (cross-validated C-statistic 0.76) and calibration (Hosmer-Lemeshow P>0.2).
Conclusion
Exploratory post-hoc models including sTNF-R1, CRP, and age, classified 8 week culture status with promising accuracy.
Keywords: Biomarkers, treatment response, tuberculosis, pulmonary
Introduction
There is renewed interest in shortening the duration of TB treatment, currently six months for drug susceptible TB and up to 24 months for multidrug resistant TB, and several new drugs are in preclinical and clinical evaluation[1]. However, efficiently evaluating the efficacy of these new agents remains challenging. Testing the efficacy of new drugs and drug combinations currently relies on phase 2 trial designs that use M. tuberculosis (MTB) sputum culture status (positive or negative) on solid or liquid media at week 8 of treatment. Using dichotomous endpoints in phase 2 clinical trials is inefficient, and it necessitates large sample sizes[2]. Moreover, culture-based techniques depend upon the ability of patients to produce representative sputum throughout treatment, often a challenge after several weeks of therapy[3]. Several blood-based candidate markers for monitoring TB treatment response have shown promise in prior studies on the bases of high sensitivity, correlation with disease severity, and decline on treatment[4,5]. We re-evaluated nine putative serum markers previously published in small cohort studies to show association with treatment effect, in participants randomized in a Phase 2 clinical trial, who underwent rigorous, standardized collection of clinical, radiographic, and microbiologic data and additionally received directly observed therapy throughout the intensive phase of treatment.
The nine candidate markers are all nonspecific indicators of inflammation: neopterin, granzyme B, C-reactive protein (CRP), soluble Intercellular Adhesion Molecule 1 (sICAM-1), soluble urokinase plasminogen activator receptor (suPAR), interferon-gamma inducible protein (IP-10), soluble interleukin-2 receptor alpha (sIL-2Rα), soluble tumor necrosis factor alpha receptor 1 (sTNF-R1), and soluble tumor necrosis factor alpha receptor 2 (sTNF-R2). Neopterin is synthesized by macrophages in response to stimulation by IFN-γ, and serves as a marker of TH1-mediated immune activation. It is elevated in body fluids of patients with TB, and correlates with disease extent and activity[6-11]. Granzyme B is a serine protease that mediates apoptosis of infected cells, and has been utilized in multivariable models to predict response to anti-TB treatment[12]. CRP is a nonspecific acute phase reactant produced by the liver that opsonizes bacterial pathogens, binds to macrophages, and promotes phagocytosis. Multiple studies have reported that CRP is elevated at TB diagnosis, is correlated with severity of disease and sputum bacillary load, and decreases during treatment[13-19]. sICAM-1 is a cellular adhesion molecule which may play a role in maintaining a pro-inflammatory environment, and is elevated in active TB. It has also been included in models for prediction of TB treatment response[19-22]. suPAR is a receptor produced by macrophages and monocytes. It is elevated in active TB and correlates with sputum bacillary burden[23]. IP-10 is a monocyte and T-cell-derived chemokine that holds promise as a biomarker for both active and latent TB[24-27]. sIL-2rα is expressed by activated T lymphocytes, and it correlated with response to anti-TB therapy in one study[28]. TNF receptors sTNF-R1 and sTNF-R2 have been shown in other models to serve as markers of innate and adaptive immunity. Levels of sTNF-R1 are increased in active TB, and sTNF-R2 polymorphisms have been implicated in susceptibility to TB[29-31].
We describe the kinetics of change of these markers during treatment, and we constructed a biomarker-based classifier using multiple markers in combination with clinical characteristics that were associated with response to treatment.
Materials and Methods
Ethics Statement
The parent study was a CDC-sponsored clinical trial, TBTC Study 29 (ClinicalTrials.gov Identifier NCT00694629). It was approved by both CDC and local institutional review boards. Written informed consent was obtained from all study participants for collection of serum for TB-related research. In addition, the institutional review board at University of California, San Francisco (UCSF) approved this ancillary study to assess putative biomarkers of treatment response.
Study Population and Setting
TBTC Study 29, a randomized, phase 2 clinical trial, compared the antimicrobial activity and safety of standard daily regimen containing rifampin, to that of the experimental regimen with daily rifapentine (10 mg/kg/dose), both given with isoniazid, pyrazinamide and ethambutol to adults with smear positive, culture-confirmed pulmonary TB. The primary efficacy endpoint of the trial was the proportion of patients, by regimen, having negative sputum cultures at completion of 8 weeks (40 doses) of treatment. All TB treatment was administered 5 days/week for 8 weeks and directly observed. All participants underwent HIV testing. Information regarding the design, conduct, and results of TBTC Study 29 has been published [32].
Selection of participants and clinical, radiographic and microbiologic features
The cohort for this biomarker study was composed of adult (age ≥ 18) patients with culture-confirmed pulmonary TB enrolled in Kampala, Uganda, as part of TBTC Study 29. Out of a total of 531 participants in the parent study, the first 40 consecutively enrolled participants who met the following criteria were selected for this study based on feasibility and previously published sample sizes in the literature: HIV-uninfected, 40 uninterrupted doses of intensive phase TB therapy received by week 8, and adequate serum and requisite culture data available through week 8. In addition, the participants were systematically selected such that after 8 weeks of treatment, 20 were culture negative on both solid and liquid (Mycobacterial Growth Indicator Tube, MGIT 960 system, BD, Sparks, MD) media, and 20 were culture positive on either solid or liquid media (15 were positive on liquid media only, 1 on solid media only, and 4 on both). We report on 39 patients, as subsequent quality checks on data uncovered an error in the retrieval of serum samples from the repository for one patient. Of the 39 patients included in the analysis, 37 had drug-susceptible and two had drug-resistant TB (one resistant to isoniazid and rifampin, one resistant to rifampin and streptomycin). Detailed radiographic and microbiologic data were collected in a standardized manner as part of the parent clinical trial. Laboratory technicians who conducted the assays were blinded to all patient characteristics until after assay results were submitted to the TBTC Data and Coordinating Center.
Serum Collection, Processing and Storage
Blood was collected before anti-TB treatment (baseline), and after 8 weeks (40 doses) of combination drug therapy, using Becton Dickinson Serum Separator Tubes (BD Vacutainer® SST™ Tube, BD Diagnostics, Franklin Lakes, NJ, USA). BD Vacutainer® SST™ Tubes were centrifuged within 2 hours of collection and processed according to manufacturer recommendations. All sites conducted collection, processing and storage of sera according to a standardized manual of operating procedures that has been confirmed to provide quality samples free of processing errors[33]. Serum was aliquoted (minimum of 500ul volume) into 1.2 ml cryovials on site in Kampala, Uganda, then frozen at -70°C.
Immunoassays
All analytes were measured at UCSF, at the MTB Research Laboratory and the Core Immunology Laboratory at San Francisco General Hospital. Soluble receptor analytes (sIL-2Rα, sTNF-R1, and sTNF-R2) were measured on the Luminex 100 multiplex platform (Millipore Corporation, Billerica, MA, USA), with kits obtained from Millipore Corporation. Levels of neopterin (Immuno-Biological Laboratories, Inc., Minneapolis, MN, USA), Granzyme B (Bender MedSystems, San Diego, CA, USA), sICAM-1 (R&D Systems, Minneapolis, MN, USA), IP-10 (R&D Systems, Minneapolis, MN, USA), and suPAR (ViroGates, Birkerød, Denmark) were measured using enzyme-linked immunosorbant assays (ELISA) according to the manufacturer's instructions. CRP levels were measured using a standard sensitivity point-of-care (POC) assay (iCHROMA POC-CRP Reader, BodiTech Med Inc., South Korea) in accordance with the manufacturer's protocol. The iCHROMA POC-CRP Reader is a fully-quantitative (range: 2.5–300 mg/L; normal < 10 mg/L) lateral flow-based fluorescence sandwich immunoassay that provides CRP measurements from whole blood, serum, or plasma.
Sera were diluted before assay according to the manufacturers' instructions, except for IP-10, for which serum was diluted 1:10 because the anticipated concentrations in the samples were estimated to be outside of the standard curve range of the kits. Washes were performed with an ELX50 Auto Strip Washer, absorbance readings were measured by an ELX800 plate reader, and data were analyzed using Gen5 Software (all from Bio-Tek Instruments, Inc., Winooski, VT, USA). The mean values for duplicate wells of each serum sample were used for statistical analysis. For each ELISA test, standard curves were created with standards of known concentration provided by the manufacturers. The standard curves and the detection limit of each assay are shown in a supplemental online table.
Statistical Analysis
Differences in clinical covariates, including age, gender, pulmonary cavity on chest radiograph, and sputum AFB smear grade, between 8 week culture status groups, were tested for significance using Fisher's Exact and Mann-Whitney tests. Differences between baseline and week 8 values for each analyte were tested using Wilcoxon sign-rank tests. Associations between Week 8 culture status and analytes measured at baseline and week 8, as well as the change from baseline to week 8, were assessed using logistic models, first unadjusted, then adjusted for age and presence of pulmonary cavity, and in each case checking for departures from linearity in the biomarker effects using 3-knot restricted cubic splines. All p values were two-tailed and a p < 0.05 was considered statistically significant.
We then exhaustively screened candidate logistic models with two–four variables, including age, pulmonary cavity, and the baseline, week 8, and change score value for each analyte. With 19 culture positive results in a sample of 39 observations, two-variable models meet the criterion of 10 events per variable [34], while four-variable models meet the looser criterion of five events per variable that may be valid in some cases[35]. To limit the potential for over-fitting given the small sample size, models were ranked by the C-statistic, equivalent to the area under the receiver-operator characteristic curve, corrected for optimism using 10 repetitions of 5-fold cross-validation[36,37]. The C-statistic is the estimated probability that in a randomly selected case and control pair, the case has has higher predicted risk, thus providing a measure of the potential of the model to discriminate cases from controls. In addition, this method avoids using p-values to drive model selection, which can misleadingly omit potentially important predictors in small datasets[38]. Correct classification rates, Hosmer-Lemeshow goodness of fit, and calibration, assessed using plots of observed vs predicted culture positivity rates, were evaluated in models fitted to the overall data. All analyses were performed using Stata version 13 (StataCorp. 2013. Stata Statistical Software: Release 13. College Station, TX: StataCorp LP).
Results
Participant characteristics
The characteristics of the 39 participants are shown in Table 1, stratified by culture status on both solid and liquid media at 8 weeks. Participants who were culture negative at week 8 of intensive therapy were younger than those who remained culture positive (mean age 25.7 versus 31.3 years, respectively, p=0.01). Patients with extensive radiographic involvement at baseline, defined as greater than one half of the chest radiograph showing evidence of TB disease, were more likely to be culture positive at 8 weeks than those with less than half of the chest radiograph involved (p=0.024). Treatment allocation was not found to be associated with culture conversion; therefore, analyses were not stratified on this variable. None of the patients had significant co-morbid conditions. All were confirmed to be HIV-uninfected.
Table 1.
Patient characteristics by sputum culture status after 8 weeks of anti-TB therapy.
| Characteristics | Culture Negative at 8 weeks (N = 19) | Culture Positive at 8 weeks (N = 20) | p value |
|---|---|---|---|
| Mean age ± SD† | 25.7 ± 5.0 | 31.3 ± 7.9 | 0.013 |
| Male | 12 (63%) | 16 (80%) | 0.301 |
| Baseline sputum AFB smear grade | |||
| 2+ | 3 (16%) | 0 (0%) | |
| 3+ | 6 (32%) | 7 (35%) | 0.293 |
| 4+ | 10 (53%) | 13 (65%) | |
| Cavity on baseline chest radiograph | 11 (58%) | 11 (55%) | 1.0 |
| Extent of radiographic involvement | |||
| Limited | 0 (0%) | 3 (15%) | |
| Moderate | 14 (74%) | 7 (35%) | 0.024 |
| Extensive | 5 (26%) | 10 (50%) | |
| Mean days to detection on MGIT 960 liquid culture at baseline | 6.6 ± 1.8 | 7.0 ± 3.3 | 0.677 |
| Treatment allocation | 0.741 | ||
| Rifampin | 6 (32%) | 8 (40%) | |
| Rifapentine | 13 (68%) | 12 (60%) | |
| Initial drug resistance to rifampin | 0 (0%) | 2 (10%) | 0.372 |
Standard deviation
Changes in analyte concentrations from baseline to week 8
Concentrations of the candidate biomarkers at baseline and after 8 weeks of treatment are shown in Supplementary Table 1. All decreased significantly, irrespective of 8 week culture status (all p < 0.01), except granzyme B, which did not change significantly in either the culture positive or culture negative group (p = 0.69 and 0.28 respectively). (Figure 1)
Figure 1.
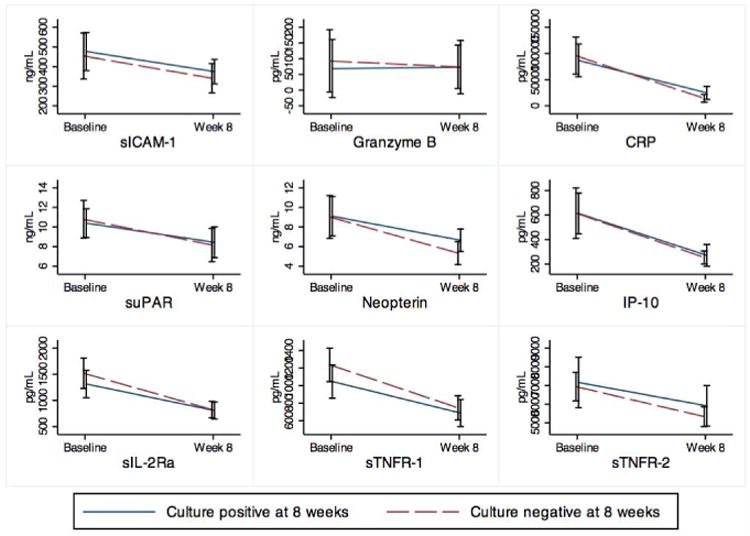
Mean concentrations of analytes at baseline and after intensive phase therapy, stratified by culture status at 8 weeks.
Association between analyte measurements and 8 week culture status
Figure 1 demonstrates the mean concentrations of analytes at baseline (before drug treatment) and after intensive phase therapy, stratified by culture status at 8 weeks. In unadjusted logistic models as well as models adjusting for age and radiographic extent of disease, none of the analytes was statistically significantly associated with culture conversion.
Logistic models for 8 week culture status
In a post-hoc exploratory analysis, logistic models were used to select combinations of variables, including serum analytes, age, and radiographic extent of disease, with the greatest potential for predicting 8 week culture status. The top-performing model included age, baseline sTNF-R1, and week 8 CRP level, achieving good discrimination (cross-validated C-statistic of 0.76), maximum correct classification rate of 85%, and acceptable calibration and goodness of fit (Hosmer-Lemeshow p-value > 0.2). Other top-performing models retained these same three factors, in combination with one other analyte. Table 2 describes the top four models along with measures of assessment. Calibration plots are not shown. Table 3 demonstrates improvement in p-values with combination of multiple variables, providing evidence of negative confounding in univariate analysis that is mitigated with these logistic models.
Table 2. Logistic models.
| Model | C-statistic | Maximum correct classification rate | Calibration† |
|---|---|---|---|
| Age + baseline sTNF-R1 + week 8 CRP | 0.757 | 85% | 0.28 |
| Age + baseline sTNF-R1 + week 8 CRP + delta Granzyme | 0.753 | 85% | 0.72 |
| Age + baseline sTNF-R1 + week 8 CRP + delta sTNF-R2 | 0.749 | 85% | 0.37 |
| Age + baseline sTNF-R1 + week 8 CRP + delta sICAM | 0.747 | 82% | 0.29 |
Calibration statistic is the p-value for the Hosmer-Lemeshow Goodness of Fit test. Acceptable values are > 0.05.
Table 3.
Analytes in top-performing model, with odds ratios for week 8 culture positivity and associated p-values, demonstrating evidence of negative confounding and improvement in statistical significance with multivariate modeling.
| Analyte | Unadjusted OR (95% CI) | Unadjusted p-value | Adjusted OR (95% CI) | Adjusted p-value | Joint p-value |
|---|---|---|---|---|---|
| Week 8 CRP | 1.68 (0.78-3.63) | 0.183 | 2.42 (1.01-5.81) | 0.043 | 0.064 |
| Baseline sTNF-R1 | 0.63 (0.32-1.23) | 0.176 | 0.43 (0.19-0.97) | 0.048 |
The performance of these models remained stable after exclusion of the two rifampin-resistant patients, who likely responded differently to initial treatment than did the other participants in this study. The model including age, baseline sTNF-R1, and week 8 CRP level maintained 84% accuracy and acceptable discrimination (cross-validated C-statistic 0.75) and calibration (Hosmer-Lemeshow P>0.2).
Discussion
In this exploratory study, we sought to determine whether 9 of the most extensively described serum markers of interest in TB retained their reported associations with TB treatment response, when evaluated in participants enrolled in a randomized clinical trial. While eight out of nine of these markers did decrease from baseline to the end of intensive phase therapy as previously published, none were individually associated with culture status at week 8. However, the combination of age, baseline sTNF-R1 level, and week 8 CRP level, had good discrimination, calibration, and accuracy for classifying subjects by 8 week culture conversion. The nine biomarkers chosen for this targeted study were selected on the basis of prior published data implicating their respective roles in TB diagnosis and monitoring. Multiple studies have reported that levels of these markers either correlate with TB infection, disease extent and severity, or decline over the course of intensive therapy[7,10,13-15,24,27,39,40]. The literature also supports the idea that a slower decline in these biomarkers over the course of treatment correlates with poorer treatment response [18,41]. Many have reported in small studies that CRP, sIL-2Rα, sTNF-R1, sTNF-r2, and neopterin were higher at baseline or failed to decline as rapidly in slower treatment responders or treatment failures[8,9,12,17,18,28,41]. Here, we have replicated the findings of Siawaya and colleagues in observing a treatment-related decline in all analytes except granzyme B, but no difference in these analytes between fast and slow treatment responders (as defined by 8 week culture status) in univariate analyses. Siawaya et al were able to classify fast and slow responders with a reasonable degree of accuracy with the use of discriminant analysis and support vector machine analysis techniques, identifying CRP, sICAM, granzyme B, and sTNF-R1 among their biomarkers of interest [19]. Similarly, our study has identified logistic models that use many of these same biomarkers, and in combination, achieve good discrimination for 8 week culture conversion. The discrepancy between our negative univariate and positive multivariate findings shows that the individual analytes are negatively confounded, each to some extent masking the effects of the others in unadjusted analysis. The fact that several of the top-scoring multivariate models performed similarly, a commonly seen pattern in prediction[42], suggests that biomarkers may change in parallel, reflecting the same or closely related biological pathways, and that selection between alternative validated models with comparably good performance could be driven by the cost and availability of the assays.
The major strength of our exploratory study lies in its integration within a randomized clinical trial, which provided the infrastructure to conduct our measurements rigorously. Clinical, radiographic, and bacteriologic data were collected using standardized forms and methods, AFB smears and cultures were performed at a single quality-controlled microbiology laboratory, and all biomarker assays were done at a single quality-controlled immunology laboratory. All treatment was administered under direct supervision using Good Manufacturing Practice-grade drugs and serum collection for biomarker exploration was linked specifically to number of doses taken, rather than time on therapy. Our result therefore provides surprising support for the potential utility of these biomarkers, even when assessed as part of a rigorously conducted clinical trial. Our study also has limitations that are similar to other published works on TB biomarker discovery. Our study consisted of 39 protocol correct participants selected for purposes of feasibility and based on previously published sample sizes for similar studies in the literature, rendering it not large enough to rule out substantial effects in univariate analyses, all of which were estimated with wide confidence intervals, nor to assess the multivariate models using separate derivation and validation sets. As such, our results are suggestive but certainly not conclusive or confirmatory, and must be validated in other independent cohorts. Nevertheless, the cross-validation technique employed here serves to mitigate any potential bias in our results based on the relatively low events per variable and small sample size, which would otherwise be vulnerable to over-fitting[43]. In addition, the retention of the same three factors – age, baseline sTNF-R1, and week 8 CRP – in all of our top-performing models further supports the stability of this approach. A second limitation common to biomarker discovery studies arises from the fact that the optimal nested case-control study would use treatment failure and relapse as the gold standard endpoint. None of the patients in our study failed treatment, and subjects were not followed for relapse as the parent trial was a Phase 2 study. We instead looked at the association between the immune markers and 8 week culture status, a widely used intermediate microbiologic endpoint correlated with relapse[44,45]. The value of assessing 8 week CRP to “predict” 8 week culture status may seem questionable, but the possibility of using serum as opposed to mycobacterial culture would greatly shorten the time to a result, and avoid the pitfalls of contamination associated with culture. Thirdly, the parent trial found no difference in intermediate microbiologic outcomes across treatment arms. As such, this substudy is unable to evaluate the candidacy of these biomarkers as surrogates for treatment regimen, which may be a valuable function worth pursuing even in the absence of patient-level predictive capability. This exploratory study serves as a precursor to future studies in which diligent assessment of treatment outcomes and such analytes in models is possible.
In summary, nine blood-based, non-specific cytokines, chemokines and soluble receptors previously published as TB biomarkers retained their reported associations with TB treatment response when evaluated in participants in a randomized clinical trial. We found a significant decline in these biomarkers from baseline to the end of intensive therapy. Logistic models incorporating multiple biomarkers, specifically baseline sTNF-R1 and week 8 CRP in addition to age performed sufficiently well to merit evaluation in larger cohorts. Future approaches to biomarker identification with at least 12 months of post-treatment follow-up to capture relapses may identify additional targets that could improve the performance of the models described.
Supplementary Material
Supplementary Table 1. Mean concentrations of 9 cytokines measured at baseline (before drug exposure) and after intensive phase therapy, stratified by culture status at 8 weeks. P values reflect unadjusted within-group comparisons between baseline and week 8 concentrations.
Acknowledgments
We thank Michael Inman and Elise Sambrano at the UCSF Clinical and Translational Science Institute, and the Core Immunology Laboratory at San Francisco General Hospital for performing the Luminex assays. We thank BodiTech Med, Inc., for donating kits for the CRP assays. We thank the patients enrolled in Study 29 and the study coordinators and staff at the CDC TBTC and in Uganda for their contributions. We thank Drs. Susan Dorman, Richard Chaisson and Neil Schluger, Chair and Co-Chairs of Study 29, as well as the Study 29 Protocol Team. We thank the CDC TBTC Biomarker Working Group for their critical input into the development of the facility for sample storage and distribution for TBTC Studies 29 and 29X.
Financial Support: Funding for recruitment, enrollment, and clinical and laboratory follow-up of TBTC Study 29 participants was provided by the United States Centers for Disease Control and Prevention. The biomarker assays and PN were supported by the National Institutes of Health through National Institute of Allergy and Infectious Diseases funding (1R01AI104589), and by the Centers for Disease Control and Prevention TB Trials Consortium.
Footnotes
Potential conflicts of interest: None
Publisher's Disclaimer: This is a PDF file of an unedited manuscript that has been accepted for publication. As a service to our customers we are providing this early version of the manuscript. The manuscript will undergo copyediting, typesetting, and review of the resulting proof before it is published in its final citable form. Please note that during the production process errors may be discovered which could affect the content, and all legal disclaimers that apply to the journal pertain.
Contributor Information
E Vittinghoff, Email: eric.vittinghoff@ucsf.edu.
MR Segal, Email: mark.segal@ucsf.edu.
WR MacKenzie, Email: wrm0@cdc.gov.
JL Johnson, Email: jlj@case.edu.
P Gitta, Email: pgitta@mucwru.or.ug.
J Saukkonen, Email: jussi.saukkonen@va.gov.
M Weiner, Email: weiner@uthscsa.edu.
M Engle, Email: Englem2@uthscsa.edu.
C Yoon, Email: christina.yoon@ucsf.edu.
M Kato-Maeda, Email: midori.kato-maeda@ucsf.edu.
P Nahid, Email: pnahid@ucsf.edu.
References
- 1.Zumla A, Hafner R, Lienhardt C, Hoelscher M, Nunn A. Advancing the development of tuberculosis therapy. Nat Rev Drug Discov. 2012;11:171–2. doi: 10.1038/nrd3694. [DOI] [PubMed] [Google Scholar]
- 2.Phillips PPJ, Gillespie SH, Boeree M, Heinrich N, Aarnoutse R, McHugh T, et al. Innovative trial designs are practical solutions for improving the treatment of tuberculosis. J Infect Dis. 2012;205(Suppl 2):S250–7. doi: 10.1093/infdis/jis041. [DOI] [PubMed] [Google Scholar]
- 3.Hartung TK, Maulu A, Nash J, Fredlund VG. Suspected pulmonary tuberculosis in rural South Africa--sputum induction as a simple diagnostic tool? S Afr Med J. 2002;92:455–8. [PubMed] [Google Scholar]
- 4.Wallis RS, Pai M, Menzies D, Doherty TM, Walzl G, PERKINS MD, et al. Biomarkers and diagnostics for tuberculosis: progress, needs, and translation into practice. Lancet. 2010;375:1920–37. doi: 10.1016/S0140-6736(10)60359-5. [DOI] [PubMed] [Google Scholar]
- 5.Wallis RS, Doherty TM, Onyebujoh P, Vahedi M, Laang H, Olesen O, et al. Biomarkers for tuberculosis disease activity, cure, and relapse. Lancet Infect Dis. 2009;9:162–72. doi: 10.1016/S1473-3099(09)70042-8. [DOI] [PubMed] [Google Scholar]
- 6.Immanuel C, Swamy R, Kannapiran M, Vijayalakshmi S, Sundaram V, Jagannath K, et al. Neopterin as a marker for cell-mediated immunity in patients with pulmonary tuberculosis. Int J Tuberc Lung Dis. 1997;1:175–80. [PubMed] [Google Scholar]
- 7.Fuchs D, Hausen A, Kofler M, Kosanowski H, Reibnegger G, Wachter H. Neopterin as an index of immune response in patients with tuberculosis. Lung. 1984;162:337–46. doi: 10.1007/BF02715666. [DOI] [PubMed] [Google Scholar]
- 8.Horak E, Gassner I, Sölder B, Wachter H, Fuchs D. Neopterin Levels and Pulmonary Tuberculosis in Infants. Lung. 1998;176:337–44. doi: 10.1007/pl00007615. [DOI] [PubMed] [Google Scholar]
- 9.Immanuel C, Rajeswari R, Rahman F, Kumaran PP, Chandrasekaran V, Swamy R. Serial evaluation of serum neopterin in HIV seronegative patients treated for tuberculosis. Int J Tuberc Lung Dis. 2001;5:185–90. [PubMed] [Google Scholar]
- 10.Güler M, Hüddam D, Unsal E, Ciftçi B, Bukan N, Erdoğan Y, et al. The role of serum neopterin level in the evaluation of activation and response to treatment in the patients with pulmonary tuberculosis. Tuberk Toraks. 2006;54:330–5. [PubMed] [Google Scholar]
- 11.Turgut T, Akbulut H, Deveci F, Kacar C, Muz MH. Serum interleukin-2 and neopterin levels as useful markers for treatment of active pulmonary tuberculosis. Tohoku J Exp Med. 2006;209:321–8. doi: 10.1620/tjem.209.321. [DOI] [PubMed] [Google Scholar]
- 12.Brahmbhatt S, Black GF, Carroll NM, Beyers N, Salker F, Kidd M, et al. Immune markers measured before treatment predict outcome of intensive phase tuberculosis therapy. Clin Exp Immunol. 2006;146:243–52. doi: 10.1111/j.1365-2249.2006.03211.x. [DOI] [PMC free article] [PubMed] [Google Scholar]
- 13.Baynes R, Bezwoda W, Bothwell T, Khan Q, Mansoor N. The non-immune inflammatory response: serial changes in plasma iron, iron-binding capacity, lactoferrin, ferritin and C-reactive protein. Scand J Clin Lab Invest. 1986;46:695–704. doi: 10.3109/00365518609083733. [DOI] [PubMed] [Google Scholar]
- 14.Plit ML, Anderson R, Van Rensburg CE, Page-Shipp L, Blott JA, Fresen JL, et al. Influence of antimicrobial chemotherapy on spirometric parameters and pro-inflammatory indices in severe pulmonary tuberculosis. Eur Respir J. 1998;12:351–6. doi: 10.1183/09031936.98.12020351. [DOI] [PubMed] [Google Scholar]
- 15.Bajaj G, Rattan A, Ahmad P. Prognostic value of “C” reactive protein in tuberculosis. Indian Pediatr. 1989;26:1010–3. [PubMed] [Google Scholar]
- 16.De Beer FC, Nel AE, Gie RP, Donald PR, Strachan AF. Serum amyloid A protein and C-reactive protein levels in pulmonary tuberculosis: relationship to amyloidosis. Thorax. 1984;39:196–200. doi: 10.1136/thx.39.3.196. [DOI] [PMC free article] [PubMed] [Google Scholar]
- 17.Lee JH, Chang JH. Changes of plasma interleukin-1 receptor antagonist, interleukin-8 and other serologic markers during chemotherapy in patients with active pulmonary tuberculosis. Korean J Intern Med. 2003;18:138–45. doi: 10.3904/kjim.2003.18.3.138. [DOI] [PMC free article] [PubMed] [Google Scholar]
- 18.Scott GM, Murphy PG, Gemidjioglu ME. Predicting deterioration of treated tuberculosis by corticosteroid reserve and C-reactive protein. J Infect. 1990;21:61–9. doi: 10.1016/0163-4453(90)90669-y. [DOI] [PubMed] [Google Scholar]
- 19.Djoba Siawaya JF, Bapela NB, Ronacher K, Veenstra H, Kidd M, Gie R, et al. Immune parameters as markers of tuberculosis extent of disease and early prediction of anti-tuberculosis chemotherapy response. J Infect. 2008;56:340–7. doi: 10.1016/j.jinf.2008.02.007. [DOI] [PubMed] [Google Scholar]
- 20.Shijubo N, Imai K, Nakanishi F, Yachi A, Abe S. Elevated concentrations of circulating ICAM-1 in far advanced and miliary tuberculosis. Am Rev Respir Dis. 1993;148:1298–301. doi: 10.1164/ajrccm/148.5.1298. [DOI] [PubMed] [Google Scholar]
- 21.Mukae H, Ashitani JI, Tokojima M, Ihi T, Kohno S, Matsukura S. Elevated levels of circulating adhesion molecules in patients with active pulmonary tuberculosis. Respirology. 2003;8:326–31. doi: 10.1046/j.1440-1843.2003.00471.x. [DOI] [PubMed] [Google Scholar]
- 22.Bäumer I, Zissel G, Schlaak M, Müller-Quernheim J. Soluble intercellular adhesion molecule 1 (sICAM-1) in bronchoalveolar lavage (BAL) cell cultures and in the circulation of patients with tuberculosis, hypersensitivity pneumonitis and sarcoidosis. Eur J Med Res. 1998;3:288–94. [PubMed] [Google Scholar]
- 23.Eugen-Olsen J, Gustafson P, Sidenius N, Fischer TK, Parner J, Aaby P, et al. The serum level of soluble urokinase receptor is elevated in tuberculosis patients and predicts mortality during treatment: a community study from Guinea-Bissau. Int J Tuberc Lung Dis. 2002;6:686–92. [PubMed] [Google Scholar]
- 24.Ruhwald M, Dominguez J, Latorre I, Losi M, Richeldi L, Pasticci MB, et al. A multicentre evaluation of the accuracy and performance of IP-10 for the diagnosis of infection with M. tuberculosis. Tuberculosis (Edinb) 2011;91:260–7. doi: 10.1016/j.tube.2011.01.001. [DOI] [PubMed] [Google Scholar]
- 25.Ruhwald M, Bodmer T, Maier C, Jepsen M, Haaland MB, Eugen-Olsen J, et al. Evaluating the potential of IP-10 and MCP-2 as biomarkers for the diagnosis of tuberculosis. European Respiratory Journal. 2008;32:1607–15. doi: 10.1183/09031936.00055508. [DOI] [PubMed] [Google Scholar]
- 26.Ruhwald M, Bjerregaard-Andersen M, Rabna P, Eugen-Olsen J, Ravn P. IP-10, MCP-1, MCP-2, MCP-3, and IL-1RA hold promise as biomarkers for infection with M. tuberculosis in a whole blood based T-cell assay. BMC Res Notes. 2009;2:19. doi: 10.1186/1756-0500-2-19. [DOI] [PMC free article] [PubMed] [Google Scholar]
- 27.Redfield RJ, editor. Is IP-10 a better biomarker for active and latent tuberculosis in children than IFNgamma? PLoS ONE. 2008;3:e3901. doi: 10.1371/journal.pone.0003901. [DOI] [PMC free article] [PubMed] [Google Scholar]
- 28.Rajalingam R, Mehra NK, Pande JN, Jain RC, Singla R. Correlation of serum interleukin-2 receptor-alpha levels with clinical manifestations in pulmonary tuberculosis. Tuber Lung Dis. 1996;77:374–9. doi: 10.1016/s0962-8479(96)90105-7. [DOI] [PubMed] [Google Scholar]
- 29.Lawn SD, Rudolph D, Wiktor S, Coulibaly D, Ackah A, Lal RB. Tuberculosis (TB) and HIV infection are independently associated with elevated serum concentrations of tumour necrosis factor receptor type 1 and beta2-microglobulin, respectively. Clin Exp Immunol. 2000;122:79–84. doi: 10.1046/j.1365-2249.2000.01341.x. [DOI] [PMC free article] [PubMed] [Google Scholar]
- 30.Bartholdy C, Nansen A, Marker O, Thomsen AR. Soluble tumour necrosis factor (TNF)-receptor levels in serum as markers of anti-viral host reactivity. Clin Exp Immunol. 1999;116:299–306. doi: 10.1046/j.1365-2249.1999.00903.x. [DOI] [PMC free article] [PubMed] [Google Scholar]
- 31.Mokrousov I, Wu XR, Vyazovaya A, Feng WX, Sun L, Xiao J, et al. Polymorphism of 3'UTR region of TNFR2 coding gene and its role in clinical tuberculosis in Han Chinese pediatric population. Infect Genet Evol. 2011;11:1312–8. doi: 10.1016/j.meegid.2011.04.025. [DOI] [PubMed] [Google Scholar]
- 32.Dorman SE, Goldberg S, Stout JE, Muzanyi G, Johnson JL, Weiner M, et al. Substitution of rifapentine for rifampin during intensive phase treatment of pulmonary tuberculosis: study 29 of the tuberculosis trials consortium. J Infect Dis. 2012;206:1030–40. doi: 10.1093/infdis/jis461. [DOI] [PubMed] [Google Scholar]
- 33.De Groote MA, Nahid P, Jarlsberg L, Johnson JL, Weiner M, Muzanyi G, et al. Elucidating novel serum biomarkers associated with pulmonary tuberculosis treatment. PLoS ONE. 2013;8:e61002. doi: 10.1371/journal.pone.0061002. [DOI] [PMC free article] [PubMed] [Google Scholar]
- 34.Peduzzi P, Concato J, Kemper E, Holford TR, Feinstein AR. A simulation study of the number of events per variable in logistic regression analysis. Journal of Clinical Epidemiology. 1996;49:1373–9. doi: 10.1016/s0895-4356(96)00236-3. [DOI] [PubMed] [Google Scholar]
- 35.Vittinghoff E, McCulloch CE. Relaxing the rule of ten events per variable in logistic and Cox regression. Am J Epidemiol. 2007;165:710–8. doi: 10.1093/aje/kwk052. [DOI] [PubMed] [Google Scholar]
- 36.Efron B, Gong G. A leisurely look at the bootstrap, the jackknife, and cross-validation. The American Statistician. 1983;37:36–48. [Google Scholar]
- 37.Shao J. Linear model selection by cross-validation. Journal of the American Statistical Association. 1993;88:486–94. [Google Scholar]
- 38.Harrell FE, Lee KL, Mark DB. Tutorial in biostatistics multivariable prognostic models: issues in developing models, evaluating assumptions and adequacy, and measuring and reducing …. Statistics in Medicine. 1996 doi: 10.1002/(SICI)1097-0258(19960229)15:4<361::AID-SIM168>3.0.CO;2-4. [DOI] [PubMed] [Google Scholar]
- 39.Lawn SD, Obeng J, Acheampong JW, Griffin GE. Resolution of the acute-phase response in West African patients receiving treatment for pulmonary tuberculosis. Int J Tuberc Lung Dis. 2000;4:340–4. [PubMed] [Google Scholar]
- 40.Tsao TCY, Huang CC, Chiou WK, Yang PY, Hsieh MJ, Tsao KC. Levels of interferon-gamma and interleukin-2 receptor-alpha for bronchoalveolar lavage fluid and serum were correlated with clinical grade and treatment of pulmonary tuberculosis. Int J Tuberc Lung Dis. 2002;6:720–7. [PubMed] [Google Scholar]
- 41.Almeida MLD, Barbieri MA, Gurgel RQ, Abdurrahman ST, Baba UA, Hart CA, et al. alpha1-acid glycoprotein and alpha1-antitrypsin as early markers of treatment response in patients receiving the intensive phase of tuberculosis therapy. Trans R Soc Trop Med Hyg. 2009;103:575–80. doi: 10.1016/j.trstmh.2008.11.024. [DOI] [PubMed] [Google Scholar]
- 42.Vittinghoff E, Glidden DV, Shiboski SC, McCulloch CE. Regression Methods in Biostatistics. Boston, MA: Springer US; 2012. [Google Scholar]
- 43.Vittinghoff E, McCulloch CE. Relaxing the rule of ten events per variable in logistic and Cox regression. Am J Epidemiol. 2007;165:710–8. doi: 10.1093/aje/kwk052. [DOI] [PubMed] [Google Scholar]
- 44.Mitchison DA. Assessment of new sterilizing drugs for treating pulmonary tuberculosis by culture at 2 months. Am Rev Respir Dis. 1993;147:1062–3. doi: 10.1164/ajrccm/147.4.1062. [DOI] [PubMed] [Google Scholar]
- 45.Wallis RS, Wang C, Doherty TM, Onyebujoh P, Vahedi M, Laang H, et al. Biomarkers for tuberculosis disease activity, cure, and relapse. Lancet Infect Dis. 2010;10:68–9. doi: 10.1016/S1473-3099(10)70003-7. [DOI] [PubMed] [Google Scholar]
Associated Data
This section collects any data citations, data availability statements, or supplementary materials included in this article.
Supplementary Materials
Supplementary Table 1. Mean concentrations of 9 cytokines measured at baseline (before drug exposure) and after intensive phase therapy, stratified by culture status at 8 weeks. P values reflect unadjusted within-group comparisons between baseline and week 8 concentrations.