

Abstract
We report here an ENDOR study of an S = ½ intermediate state trapped during reduction of the binuclear Mo/Cu enzyme CO dehydrogenase by CO. ENDOR spectra of this state confirm that the 63,65Cu exhibits strong and almost entirely isotropic coupling, show that this coupling atypically has a positive sign, aiso = +148 MHz, and indicate an apparently undetectably small quadrupolar coupling. When the intermediate is generated using 13CO, coupling to the 13C is observed, with aiso = +17.3 MHz. A comparison with the couplings seen in related, structurally assigned Mo(V) species from xanthine oxidase, in conjunction with complementary computational studies, leads us to conclude that the intermediate contains a partially reduced, Mo(V)/Cu(I), center with CO bound at the copper. Our results provide strong experimental support for a reaction mechanism that proceeds from a comparable complex of CO with fully oxidized, Mo(VI)/Cu(I), enzyme.
Keywords: CO dehydrogenase, Molybdenum binuclear center, ENDOR spectroscopy
Introduction
Carbon monoxide dehydrogenase from Oligotropha carboxidovorans1 is a member of the xanthine oxidase family of molybdenum-containing enzymes2,3 that catalyzes the oxidation of CO to CO2 (Scheme 1), transferring the reducing equivalents thus obtained into the quinone pool of the organism4. The reaction is essential for the organism when growing on CO as the sole source of both carbon and energy.
Scheme 1.

The enzyme has been characterized crystallographically5,6, and found to be an (αβγ)2 heterohexamer, with a pair of [2Fe-2S] clusters in its small subunits (CoxS, 17.8 kDa), FAD in its medium subunits (CoxM, 30.2 kDa), and a unique binuclear Mo(VI)/Cu(I) cluster in the large subunits (CoxL, 88.7 kDa) of oxidized enzyme. The binuclear cluster is the site at which CO is oxidized and has the structure shown in Figure 1, with the two transition metals linked by a μ-sulfido bridge6. In the course of reduction of the enzyme by excess CO, the binuclear cluster exhibits a Mo(V) EPR signal with g = [2.0010, 1.9604, 1.9549] and large hyperfine coupling to the I = 3/2 63,65Cu nuclei, A(63,65Cu) = [117, 164, 132] MHz7. The signal exhibits no proton super-hyperfine structure and is unchanged when the sample is prepared in D2O, but modest line-broadening is observed when 13CO is used as substrate suggesting coupling to the carbon atom derived from substrate7.
Figure 1.
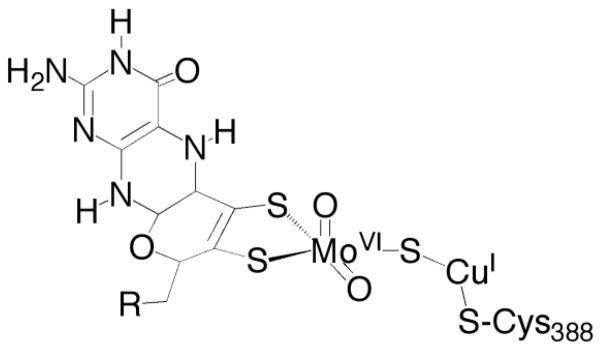
The active site of CO dehydrogenase from O. carboxidovorans. The molybdenum coordination geometry is approximately square-pyramidal, with the pyranopterin cofactor present as the dinucleotide of cytosine (R).
Both the μ-sulfido ligand and the Cu(I) ion of the binuclear cluster can be removed by treating the enzyme with cyanide, and a reconstitution protocol has been developed using Cu(I)•thiourea as the copper source. Alternatively, when Ag(I)•thiourea is used the Ag(I) ion is reconstituted into the active site. The Ag(I) substituted enzyme remains active and is reduced by CO with a limiting rate constant of 8.2 s−1, as compared with 51 s−1 for the native Cu-containing form of the enzyme8. In the course of reduction by CO, the Ag(I) substituted form of the enzyme also exhibits a characteristic EPR signal, with g = [2.0043, 1.9595, 1.9540] and with strong coupling to the I = ½ 107,109Ag nuclei with A(107,109Ag) = [82, 79, 82] MHz.
Several structures can be envisaged for the EPR-active Mo(V) form of the native copper-containing CO dehydrogenase, as illustrated in Figure 2. Structure A is the Mo(V)-containing analog of a proposed Mo(IV)-containing intermediate in the reaction of enzyme with CO based on the 1.1-Å resolution structure of the enzyme in complex with n-butylisonitrile, in which the inhibitor is found to insert between the S-Cu bond of the μ-sulfido bridge (Figure 2, Structure A′).6 The Mo(V) species would be formed from an initial Mo(IV) species by transfer of one electron from the binuclear cluster to the other redox-active centers of the enzyme prior to completion of the reaction (in a manner analogous to generation of the “very rapid” Mo(V) species seen with xanthine oxidase9,10,11). Structure B represents an alternate reaction intermediate proposed on the basis of density functional studies of the binuclear center,12,13 with the Mo(V) species again generated by one-electron oxidation of a Mo(IV) species. Structure C is a Mo(V)-containing analog of the presumed complex of CO with oxidized enzyme that is believed to represent the initial intermediate in catalysis. Here, the CO is coordinated to the Cu(I) with a residual electron remaining in the binuclear center after reaction with a prior equivalent of CO (in this case, partial reduction of the center would have occurred by reaction of a prior equivalent of CO). In all three structures, the molybdenum is formally Mo(V) and the copper is Cu(I).
Figure 2.
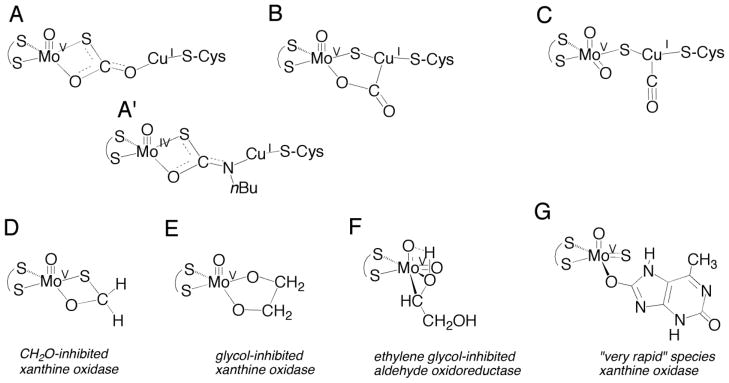
Possible structures for the EPR-active species seen with CO dehydrogenase (A–C), and structures of various relevant EPR-active Mo(V) species observed with the related enzyme xanthine oxidase (D–G).
To discriminate among these structural alternatives and gain insight into the mechanism of CO oxidation, we have used 35 GHz pulsed-ENDOR spectroscopy to determine the 13C, 95,97Mo, and 63,65Cu hyperfine coupling tensors and the 63,65Cu quadrupole coupling interaction for 12,13CO-reduced CO dehydrogenase. The measured 13C-hyperfine coupling is compared with reported 13C-coupling for paramagnetic Mo(V) species observed with other members of the xanthine oxidase family, and the magnitude and sign of the 63,65Cu couplings are compared with those of other Cu centers. The combination of these measurements with DFT calculations discriminates among the potential structures for the intermediate (Figure 2), and support a spin-delocalized [Mo(V)-(μ-S)-Cu(I)] structure that has CO coordinated to Cu(I). This species represents a paramagnetic analog of the initial [Mo(VI)-(μ-S)-Cu(I)•CO] Michaelis complex of the catalytic cycle, from which a catalytic sequence can be developed.
Materials and Methods
Carbon monoxide gas was obtained from Air, Inc. at a purity of 99.5 % and 13CO at 99 % enrichment was from Cambridge Isotope Laboratories. All other reagents were obtained at the highest level of purity available commercially. O. carboxidovorans (ATCC 49405) cells were grown at 30°C, pH 7.0 in a 20 L fermentor (BioFlo 415, New Brunswick) containing minimal medium and CO as the carbon source (introduced as a mixture of 50 % CO and 50 % air). Cells were harvested in late log phase (OD436 >5), washed in 50 mM HEPES (pH 7.2) and stored at −80°C until needed. CO dehydrogenase was purified according to the procedure described by Zhang et al.7, using a combination of Q-Sepharose and Sephacryl S-300 FPLC chromatography. Enzyme was routinely reconstituted with copper using the method of Resch et al.14, and the degree of functionality determined by comparing the extent of enzyme bleaching, as observed at 450 nm, by CO (which reduces only the fully functional enzyme) with that seen using dithionite (which reduces both functional and nonfunctional enzyme); this typically exceeded 50 %.
ENDOR samples were prepared by making the enzyme (at a concentration of ~200 μM) anaerobic by cyclic evacuation and flushing with O2-scrubbed argon gas for 1 h, followed by reduction under 1 atmosphere of CO for 30 s prior to freezing in a dry ice-acetone bath and storage in liquid N2. Accumulation of the EPR-active state was confirmed by EPR, using a Brüker Instruments ER 300 spectrometer equipped with an ER 035M gaussmeter and HP 5352B microwave frequency counter. Temperature was controlled at 150 K using a Brüker ER 4111VT liquid N2 cryostat. 35 GHz pulsed EPR/ENDOR spectra were recorded as reported previously.15,16
Spin-unrestricted gas-phase geometry optimizations for all CO dehydrogenase structures were performed at the density functional level of theory (DFT) using the ORCA software package (an ab initio, DFT and semiempirical SCF-MO package, version 2.8-20, September, 2010). All calculations employed the B3LYP hybrid exchange-correlation functional and a TZVP basis set for all atoms. DFT bonding calculations and EPR calculations used a scalar relativistic Hamiltonian, and the radial integration accuracies for Mo and Cu were increased as recommended for heavy atoms. The enzyme active site was represented by a Mo(V) ion with an apical oxo ligand and an equatorial ene-1,2-dithiolate ligand, either an equatorial oxo or hydroxy ligand, and an equatorial μ-sulfido ligand bridged to Cu(I)-SCH3. EPR spin-Hamiltonian parameters were calculated for these two structures and various postulated CO/HCO3-bound Mo(V) forms. Geometry optimizations were performed without constraints as well as with select bond and dihedral angles in the Oapical-Mo-S-Cu-S chain constrained to maintain geometries consistent with those seen in the enzyme crystal structure.
Results
X-band (~ 9.5 GHz) EPR spectra of CO-reduced CO dehydrogenase were collected for samples prepared with 12,13CO in H2O 50 mM HEPES buffer, pH 7.2 at 150 K (Figures 3 (top) and S1). The EPR spectrum of the binuclear center of the enzyme generated with 12CO (black line) shows a well-resolved structure centered around g ~ 1.96 with complex multiplet features due to hyperfine interactions with both Mo [I(95,97Mo) = 5/2; 25 % natural abundance] and Cu [I(63,65Cu) = 3/2; 100 % natural abundance] nuclei. In addition to the [Mo, Cu] cluster, the enzyme contains two [2Fe-2S] centers. However, at liquid nitrogen temperatures and above, the EPR signals arising from the iron-sulfur centers relax very fast and are not detected,
Figure 3.

X-band (top) and Q-band (bottom) EPR spectra of the [Mo, Cu] center (black) in H2O buffer at 150 K and 2 K respectively. (Top): 9.45 GHz, modulation amplitude = 5 G; red is the simulation with 150K parameters from Table 1. (Bottom): Numerical derivative of 34.8 GHz, two-pulse echo-detected spectrum (π-pulse = 80 ns, τ = 600 ns, repetition time = 50 ms). red: simulation of the binuclear signal using the 2K parameters from Table 1. g-scale included for correlation with ENDOR field-frequency patterns given in Figure 4. Note that the scale of this simulation is exaggerated relative to the intensity of the signal in the experimental spectrum to better illustrate line positions. The ‘braces’ show the field values for the canonical g-values of the FeS clusters. The asrterisk denotes the signal of adventitions Cu(II) in the signal, and the double asterisk the isotropic signal of FADH• from the enzyme, with g = 2.00.
The 150 K X-band spectrum of the [Mo, Cu] center is well reproduced (red dashed line) with the following spin-Hamiltonian parameters: g is roughly axial, g = [2.002, 1.958, 1.953]; A(63,65Cu) is dominated by the isotropic interaction, |A(63,65Cu)| = [117, 164, 132] MHz, corresponding to |aiso(63,65Cu)|= 138 MHz, with a small anisotropic coupling, T = [−21, 26, −7], having a maximum anisotropic component, |Tmax(63,65Cu)| = 26 MHz.7 The g values, all being ≤ ge, indicate that the EPR signal arises from a Mo(V) rather than Cu(II) species. A 2K echo-detected Q-band EPR spectrum of the same sample, Figure 3, lower, clearly shows the features of the [Mo, Cu] center, as can be seen by comparison with a simulation computed using 63,65Cu hyperfine parameters determined by ENDOR, below. At this temperature, however, the EPR signals from the [2Fe-2S] centers relax slowly and overlap that of the binuclear center and their features are much more prominent owing to the greater degree of reduction of the iron-sulfur centers (40–50%) as compared to the fraction of the binuclear center that is paramagnetic (no greater than 15%). The spectrum gives no evidence for magnetic coupling between the binuclear center and the proximal [2Fe-2S] cluster, as expected given the conditions the sample was prepared (ie. by partial reduction of the substrate).
A preliminary set of X-band and Q-band spectra collected between 150 K and 77K confirm the above g-tensor, but shows that the small hyperfine anisotropy seen at 150K decreases upon cooling; this finding is extended in 2K ENDOR measurements presented below.1 When the binuclear signal is generated using 13CO, the X-band spectrum shows significant line broadening (Figure S1) due to unresolved hyperfine coupling to the 13C, as previously reported.14
The g values for the EPR signal of the binuclear center, all being ≤ ge, indicate that the signal arises from a Mo(V) rather than Cu(II) species, consistent with the known constitution of the binuclear center, with Mo(VI) and Cu(I) in the fully oxidized state. This conclusion is supported by contrasting the nearly isotropic 63,65Cu, hyperfine tensor with the highly anisotropic hyperfine coupling observed for Cu(II) systems.17 The conclusion is confirmed below by ENDOR measurements that determine the signs of the 63,65Cu couplings.
The overlap at 2K of the EPR signals from the slowly-relaxing [2Fe-2S] centers causes no problem for ENDOR measurements of the [Mo, Cu] binuclear center, as the 13C and 63,65Cu nuclei being studied by ENDOR are associated only with the [Mo, Cu] center. 13CO signals are identified by comparing centers prepared with 12,13CO, and the [2Fe-2S] centers give no ENDOR response in the vicinity of 63,65Cu ENDOR transitions. 20–23
Davies ENDOR spectra of the binuclear center of CO dehydrogenase, recorded at 2 K and taken at g = 1.971, are shown in Figure 4 (top) for samples reduced by 12,13CO. The υ+ = 23 MHz branch of the 13C doublet (υ±(13C) = |A(13C)/2 ± υ(13C)|) from 13CO is evident in the latter case.2 At the field of observation, υ(13C) is ~ 13.5 MHz, yielding A(13C) ~ 19 MHz for the 13C-hyperfine coupling. The ENDOR intensity in the 9–16 MHz region for both labeled and unlabeled samples can be assigned to amide 14N features from the two [2Fe-2S] clusters, whose EPR signals overlap the Mo(V) EPR signal at low temperature (Figure 3; bottom). Subtraction of the 12CO background (black line) from the 13CO spectrum (red line) of the binuclear cluster more clearly shows the υ+ peak (red dotted line), but also reveals the υ− branch of the 13C-doublet (relaxation effects lead to the reduced intensity for υ−). Figure 4 (bottom) shows a 2-D field-frequency plot of the background-subtracted Davies 13C-ENDOR spectra for the binuclear cluster of CO dehydrogenase reduced by 13CO, recorded at selected magnetic fields across the EPR envelope (For complete 2-field-frequency pattern, see Figure S2). The frequencies of the 13C doublet remain essentially constant over the entire absorption envelope, and the pattern can be simulated by the hyperfine tensor, A(13C) = +[16.7, 16.5, 18.8] MHz. The 13C hyperfine tensor is thus dominated by an isotropic coupling of aiso(13C) = +17.33 MHz, with an extremely small anisotropic term that approximates the dipolar form: T = [−T, −T, 2T] where T = 0.73 MHz. These results are summarized in Table 1.
Figure 4.

Top, Davies 13C-ENDOR spectra of the binuclear signal measured at g = 1.971. The red dotted line shows the 13C hyperfine coupling, obtained by subtracting the spectrum of 12CO (black line) from that of 13CO (red line) in H2O. The black horizontal bar connects the 13C peaks centered at υ(13C) and separated by A(13C). The low intensity of the low-frequency partner common in Q-band ENDOR. Bottom, simulated (red dotted lines) and experimental (black lines) 2-D field-frequency plot of Davies 13C-ENDOR spectra of the binuclear signal reduced by 13CO. The amplitudes of the simulated υ−(13C) signals are multiplied by 1/3 to reflect the low-intensities due to relaxation effects (see text). Conditions: π-pulse length = 120 ns, τ = 600 ns, repetition time = 40 ms, microwave frequency = 34.795 GHz, T = 2 K.
Table 1.
Spin Hamiltonian parameters used to simulatea the 2-D ENDOR patterns of 13C and 63,65Cu nuclei of Cu-CO dehydrogenase.
| Nuclei | A1 | A2 | A3 | aiso |
|---|---|---|---|---|
| 13C | +16.7 | +16.5 | +18.8 | +17.33 |
| 63,65Cu(ENDOR)b | +148 | +148 | +148 | +148 |
| 63,65Cu(EPR) | 117 | 164 | 132 | +137.6 |
Simulations employed g = [2.002, 1.958, 1.953] and the hyperfine couplings are in MHz.
Quadrupole splitting for 63,65Cu (I = 3/2) are not observed, their inclusion had no effect on simulations, so were not incorporated.
Figure 5 shows a 2-D field-frequency plot of Davies ENDOR spectra collected over the frequency range of 30–100 MHz at multiple field settings across the EPR envelope for the spectrum seen with enzyme reduced by 12CO. At all magnetic field settings the spectra exhibit a strong 1H-ENDOR response arising from weakly coupled proton(s) without well-resolved structure. These 1H-ENDOR features overlap with ENDOR features attributable to 95,97Mo (I = 5/2), isotopes that together account for 25 % of the total isotopic abundance. These features are similar to those that have been seen previously in the ENDOR spectrum of the formaldehyde-inhibited Mo(V) signal of xanthine oxidase24. Because of the poor resolution and low natural abundance, combined with the additional complexity arising from strong quadrupolar coupling in the case of 97Mo, no attempt has been made to simulate this pattern. However, its overall character indicates that the isotropic hyperfine coupling for molybdenum, aiso(95,97Mo), is roughly 75–125 MHz. 25
Figure 5.

2-D field-frequency plot of broad-band Davies ENDOR spectra of the binuclear signal reduced by 12CO. The black brace encompasses the frequency range of 1H signals; the red brace encompasses the frequency range of 95,97Mo signals, with the (*) in representative spectra identifying resolved 95,97Mo signals. Blue ‘goalpost’ connects the 63,65Cu peaks at υ+(63,65Cu) ~ 87 MHz and υ−(63,65Cu) ~ 60 MHz; the center frequency is A(63,65Cu)/2 and separation is 2υ(63,65Cu). Blue dotted lines are simulations of the 63,65Cu spectra, where the amplitudes of the υ− branches are multiplied by ½ to reflect their low intensities. Conditions: π-pulse length = 120 ns, τ = 600 ns, repetition time = 40 ms, microwave frequency = 34.772 GHz, T = 2 K.
The hyperfine tensor measured in the X-band EPR spectrum from the overlapping splittings of 63Cu (69 %), and 65Cu (30 %), predicts the presence of a Q-band 63,65Cu ENDOR response from the υ+(63,65Cu) manifold in the frequency range, ~ 75–100 MHz. The Q-band ENDOR spectra taken at 2 K exhibit the predicted response, with υ+(63,65Cu) ~ 90 MHz (Figure 5, blue horizontal bar) corresponding to a hyperfine coupling of |A(63,65Cu)| = 148 MHz, within the range of values expected from the EPR-derived hyperfine tensor. The signals are exceedingly sharp compared to those seen for a Cu(II) protein26; and there is no evidence in the ENDOR spectra for the significant quadrupolar coupling to the I = 3/2 nuclear spin of 63,65Cu seen in Cu(II) proteins.
The frequency of this 63,65Cu signal remains constant as the field is moved towards g2 and g3, indicating that the hyperfine interaction is isotropic within experimental error, with aiso(63,65Cu) = +148 MHz, a slight increase from, aiso(63,65Cu) obtained from the continuous-wave EPR spectra at higher temperature, Table 2. The vanishing of the anisotropic coupling upon cooling to 2K is compatible with the temperature variation of the small 63,65Cu hyperfine anisotropy seen at higher temperatures (see above). This phenomenon may be assigned to changes in the geometry at Cu(I) with cooling. It is well known that considerable changes in the geometry of a diatomic bound to a metal ion can occur during cooling,27 and this quite likely is happening to the Cu-CO linkage. However, the spectra collected towards the high field/low-g-value edge of the EPR spectrum do show a ‘tailing’ towards higher frequency that may reflect a heterogeneity in the geometry at Cu(I). For consistency, the 2K ENDOR-derived 63,65Cu coupling will be used in the following discussion.
Table 2.
Experimental and computed EPR parameters for CO-reduced CO dehydrogenase.a
| gmin | gmid | gmax | 63,65Cu aiso | 63,65Cu T | 13C aiso | 13C T | 1H aiso | 1H T | 95,97Mo aiso | |
|---|---|---|---|---|---|---|---|---|---|---|
| Experiment | 1.953 | 1.958 | 2.002 | +148b 138c | ~0b [−20.7, +26.4, −5.7]c | 17.3b | [−.6, −.8, 1.5]b | N/A | N/A | 75–100 |
| MoO2 + CO bound to Cu(I) | 1.911 | 1.950 | 1.996 | 167 | −13, 2, 11 | 3.7 | −4.5, −5.1, 9.7 | N/A | N/A | 59 |
| Mo(O)(HCO3−) | 1.949 | 1.967 | 2.022 | 281 | −17, −7, 24 | 18.6 | −1.0, −1.0, 2.0 | 3 | −1, −1, 2 | 65 |
| Mo(O)(OH)(CO) | 1.954 | 1.958 | 2.015 | 90 | −13, −8, 21 | 15.8 | −2.6, −1.7, 4.4 | 4 | −5, −7, 11 | 65 |
| Mo(O)(OH) + CO bound to Cu(I) (constrained S-Cu-S at 139°) | 1.955 | 1.959 | 2.012 | 137 | −15, −7, 21 | 26.6 | −3.5, −1.9, 5.5 | 4 | −5, −7, 11 | 65 |
All hyperfine coupling constants are in MHz.
These values derive from the present 2K ENDOR measurements,
from the 150K X-band EPR spectrum (ref. 7).
Signs for the hyperfine tensors, which are not available from EPR measurements, were determined from the ENDOR spectra of the binuclear cluster (more specifically, the sign of gNucANuc) using the Pulse-Endor-SaTuration-REcovery (PESTRE) protocol, a pulse sequence comprised of multiple Davies ENDOR sequences28,29. Figure 6 shows the PESTRE measurements obtained at g = 1.975 for the υ+ branches of the 13C and 63,65Cu-ENDOR responses, where relatively sharp ENDOR responses for 13C and 63,65Cu nuclei are observed. In phase I of the PESTRE traces (no radio frequency illumination), the υ+ branches of the 13C and 63,65Cu have reached the steady-state electron spin-echo baseline; in phase II, radio frequency excitation is applied and converts the spin populations and spin-echo response to their steady-state ENDOR values; in phase III (again in the absence of radio frequency illumination), the electron-nuclear spin populations give rise to a spin-echo signal denoted as the dynamic reference level, which relaxes to the BSL. In phase III, the υ+ signals of 13C (red line) and 63Cu (blue line; inset) both relax to the spin-echo baseline ‘from below’, behavior that unambiguously establishes that both A(13C) and A(63,65Cu) are positive.
Figure 6.

PESTRE spectra measured at the υ+ peaks of the 13C and 63,65Cu nuclei (inset; indicated as red and blue lines) of the binuclear signal. The RF frequencies and the g value at which PESTRE experiments were carried out are given in the inset: Conditions: π-pulse length = 120 ns, τ = 600 ns, repetition time = 40 ms, tRF = 20 μs, microwave frequency = 34.795 GHz, T = 2 K.
Discussion
The aim of the present investigation is to determine the structure of the species that gives rise to the EPR signal seen upon partial reduction of CO dehydrogenase with CO, and to use this information in conjunction with DFT calculations to elucidate the reaction mechanism of the enzyme. The experimental and computational results are summarized in Table 2, where it can be seen that the most remarkable feature of this species is the large and positive isotropic hyperfine coupling to copper, with aiso(63,65Cu) = +148 MHz, with negligible anisotropic hyperfine coupling to the I = 3/2 nuclear spin. The small-to-vanishing anisotropic component seen with CO dehydrogenase contrasts sharply with the large anisotropy in Cu(II) centers, where large negative isotropic and negative anisotropic 63,65Cu couplings are typically observed: aiso(63,65Cu) ~ Tmax (63,65Cu) ~ −[150–200] MHz30–32; for a type 2 Cu(II) center, aiso(63,65Cu) ~ Tmax(63,65Cu) ~ −70 MHz for a type I Cu.33,34 No less startling, the ENDOR/PESTRE measurements show that the observed isotropic 63,65Cu hyperfine coupling is positive, opposite in sign to those of d9 Cu(II) centers with an unpaired electron in a (dσ*) orbital. The Cu hyperfine couplings in CO dehydrogenase are instead consistent with a d10 Cu(I) ion whose closed-shell electronic configuration acquires a large positive aiso through delocalization of the electron spin in the ‘Mo(V) SOMO’ over the entire [Mo(V)-(μ-S)-Cu(I)] unit, into the 4s orbital of Cu.
In support of this assignment, we observe that the Cu(I) hyperfine coupling seen here is quite similar to that of Cu(I) in an inorganic model compound prepared by Gourlay et al.,35 which mimics the structure and spectroscopic properties of the paramagnetic active site of CO dehydrogenase: [TpiPrMo(V)(O)(OAr)(μ-S)Cu(I)(Me3tcn)] (where TpiPr = hydrotris(3-isopropylpyrazol-1-yl)borate; OAr = 3,5-(di-t-butyl)phenolate; Me3tcn = 1,4,7-trimethyl-1,4,7-triazacyclononane). The isotropic Cu(I) hyperfine interaction, |aiso(63,65Cu)| ~ 159 MHz, observed for this model is quite similar in magnitude to aiso(63,65Cu) = +148 MHz seen with CO dehydrogenase. Calculations on the model have confirmed that the remarkably large values of aiso reflect a strong covalent delocalization of the SOMO through the bridging sulfido.
The hyperfine coupling to 13C in the EPR signal manifested by 13CO-reduced CO dehydrogenase also is distinctive in being highly isotropic. The isotropic coupling, aiso(13C) = +17.4 MHz, is intermediate between the values observed to date for carbon-containing ligands to a paramagnetic Mo(V) center: aiso(13C) = +43.8 MHz for formaldehyde-inhibited xanthine oxidase24,36,37,32 and |aiso(13C)| = 7.9 MHz for the ‘very rapid’ Mo(V) intermediate trapped with that enzyme10,38. Additionally, the anisotropic component seen here with CO dehydrogenase, T = 0.73 MHz39, is smaller than that observed in the formaldehyde-inhibited xanthine oxidase (T = 3.8 MHz) and slightly smaller than that observed in the ‘very rapid’ intermediate (T = 1.15 MHz). We therefore argue that this small isotropic 13C coupling is unlikely to arise from a species with a Mo-C bond.
One possible assignment for the state studied here is Structure A of Fig 2. Our recent 1,2H and 13C-ENDOR study of the formaldehyde-inhibited Mo(V) of xanthine oxidase24,37,40 has shown that it possesses the core of four-membered ring structure D, with a Mo-C distance of 2.76 Å in the DFT-optimized geometry. 24,40 This structure resembles that of structure A′ (Fig 2), found by X-ray diffraction of n-butylisonitrile-inhibited CO dehydrogenase (with a Mo-C distance of 2.63 Å)6. The planar geometry of the related Structure D, with short Mo-C distance within the ring, favors strong covalent spin delocalization via the Mo-O-C linkage or a strong “transannular hyperfine interaction” between Mo(V) dxy orbital and carbon 2s orbitals, resulting in an extremely large hyperfine coupling to the 13C of formaldehyde, with aiso = 44.6 MHz24. The significantly smaller hyperfine coupling for 13C seen here with CO dehydrogenase thus argues against Structure A of Figure 2 being responsible for the observed EPR signal.
A second possible assignment of the Mo(V) species studied here is the five-membered metallocyclic ring of Structure B (Fig 2), the closest established analogue of which is the species giving rise to the “glycol-inhibited” Mo(V) EPR signal of desulfo xanthine oxidase (Figure 2, Structure E). The 1,2H-ENDOR results for the “glycol-inhibited” species were interpreted in terms of a five-membered (Mo-O-C-C-O) metallocyclic structure24,37. The paramagnetic Mo(V) species giving rise to the “very rapid” EPR signal seen with xanthine oxidase also has a Mo-O-C unit analogous to that of Structure B. Here, the slow substrate 2-hydroxy-6-methylpurine9 is bound to the Mo(V) ion via the equatorial oxygen atom after being incorporated into product as a hydroxyl group10,41. When the C-8 position of 2-hydroxy-6-methylpurine is labeled with 13C, aiso for the “very rapid” signal is 7.9 MHz24, while aiso for the 13C of glycol in the glycol-inhibited signal is even smaller at 6.2 MHz (Shanmugam et al., unpublished). In both cases, the 13C hyperfine coupling is weak because there is no direct bonding of carbon to Mo(V) and the Mo-C distance is long (~ 3.4 Å), precluding strong overlap between Mo(V) dxy and carbon 2s orbitals. The DFT results for structure B yield a very large aiso for 13C of 54 MHz, however, much larger than observed experimentally. The calculated copper hyperfine also is highly rhombic, A(63,65Cu) = [19,−94,105] MHz, in sharp disagreement with the observed isotropic coupling seen here with CO dehydrogenase. These observations argue against Structure B being responsible for the signal seen with CO dehydrogenase.
It is noteworthy that a recent X-ray crystallography study of the glycol- and glycerol-inhibited Mo centers of AOR claims a third structure variant, a direct Mo-C bond (structure F) for this species.19 However, if for illustrative purposes we assume that the dipolar interaction arises solely from a through-space interaction of the 13C with a point electron spin on Mo(V), the measured value T = 0.73 MHz corresponds to a Mo-C distance of ~ 2.4 Ǻ. Subtraction of a 13C local contribution to the observed Tobs = 0.73 MHz, would further increase the resultant Mo-C distance10, thus ruling out a direct Mo-C bond in CO dehydrogenase. A similar analysis10 has helped rule out a direct Mo-C bond in the “very rapid” Mo(V) signal of xanthine oxidase prepared with 2-hydroxy-6-methylpurine (13C-8).
Overall, a comparison of the 13C coupling seen here (Table 2) with previously reported 13C hyperfine tensors for a ligand to the paramagnetic Mo(V) enzyme species indicates that Structures A and B, as well as any structure with a Mo-CO bond, are unlikely to represent the structure of the binuclear center of CO dehydrogenase. Instead we propose that Structure C of Figure 2, with CO coordinated to the copper of the Mo(V)-Cu(I) binuclear center best represents the structure seen in the enzyme.
A structure having a Cu(I)-coordinated CO is consistent with both of the computational studies of the reaction of CO dehydrogenase that identify CO coordinated to the copper of a fully oxidized binuclear center as the starting point for catalysis12,13. In the case of the partially reduced complex examined in the present study, with the molybdenum in the EPR-active Mo(V) valence state, the enzyme cannot progress through the catalytic sequence, thus accounting for the accumulation of the signal in the course of our sample preparation. Our Mo(V)/Cu(I)•CO species in fact represents a paramagnetic analog to the bona fide Michaelis complex for the reaction, and is thus analogous to the species giving rise to the well-characterized “Rapid” Mo(V) EPR signals in the related molybdenum-containing enzyme xanthine oxidase42 (albeit with a substantively different structure).
Although there is no EPR or ENDOR evidence regarding protonation of the equatorial Mo=O group in the Mo(V) state, our DFT calculations (Table 2) indicate that the observed g-tensor anisotropy is not consistent with a dioxo species such as seen in the oxidized enzyme6,7. Coupled uptake of protons with electrons is a common property of even the simplest molybdenum complexes,43,44 and there is precedent for equatorial Mo-OH protons being only very weakly coupled.45,46 We thus consider it likely that the partially reduced binuclear center in fact possesses an equatorial Mo-OH (in contrast to the equatorial Mo=O of oxidized enzyme6,7) in the Mo(V) state.
Conclusion
Our ENDOR results provide direct experimental support for CO coordination to Cu(I) of the binuclear center of CO dehydrogenase. Upon binding of CO, the reaction progresses as shown in Figure 7 by nucleophilic attack of the equatorial Mo=O oxygen on the Cu-bound CO, with substrate likely activated to at least some degree by backbonding from the copper which leads to population of the CO π* orbital. The DFT calculations of Hofmann and coworkers13 indicate that this chemistry leads to a set of three species having the structures shown in brackets in Figure 7. Although presented as discrete intermediates in the computational work, we consider it likely that these species are readily interconverted. We further observe that they involve bonding of the carbon of substrate to each of the three atoms of the Mo-μ(S)-Cu core, and that subsequent work has shown each of the three core atoms to contribute significantly to the redox-active orbital35. We therefore present these species in Figure 7 as an ensemble of states from which the reaction proceeds further. Completion of the catalytic sequence involves formal reduction of the binuclear cluster and formation of CO2 from this ensemble, with hydroxide from solvent necessarily being introduced into the molybdenum coordination sphere to regenerate the equatorial ligand of the molybdenum and complete the catalytic cycle.
Figure 7.

The reaction mechanism of CO dehydrogenase.
In summary, the ENDOR and computational study presented here provides direct experimental evidence that the EPR signal seen in the course of substrate reduction of CO dehydrogenase arises from a partially reduced, Mo(V)/Cu(I), binuclear center with CO bound at the copper. This conclusion provides strong support for a reaction mechanism that begins with a fully oxidized binuclear center, with CO coordinated to copper and thereby activated for nucleophilic attack by the equatorial Mo=O ligand.
Supplementary Material
Acknowledgments
The authors wish to acknowledge the support of the National Institutes of Health (GM 057378 to MLK), the National Science Foundation (MCB 0723330 to BMH, DGE-0824162 to GEC) and the Department of Energy (13ER16411 to RH).
ABBREVIATIONS
- CO dehydrogenase
Carbon monoxide dehydrogenase
- XO
Xanthine oxidase
- AOR
aldehyde oxidoreductase
Footnotes
This temperature dependence is not central to the present paper and will be described in detail elsewhere.
Assignment as υ− would yield a hyperfine coupling too large to be compatible with the X-band EPR spectra.
Supporting material Figure S1: 9.5 GHz EPR spectra of the CO dehydrogenase binuclear signal reduced with 12,13CO. Figure S2: 2-D 13C-Davies ENDOR spectra of the binuclear center of CO dehydrogenase collected at selected magnetic fields across the EPR envelope, 2 K. This material is available free of charge via the Internet at http://pubs.acs.org
References
- 1.Meyer O, Lalucat J, Schlegel HG. International Journal of Systematic Bacteriology. 1980;30:189. [Google Scholar]
- 2.Hille R. Chemical Reviews. 1996;96:2757. doi: 10.1021/cr950061t. [DOI] [PubMed] [Google Scholar]
- 3.Hille R. Trends in Biochemical Sciences. 2002;27:360. doi: 10.1016/s0968-0004(02)02107-2. [DOI] [PubMed] [Google Scholar]
- 4.Wilcoxen J, Zhang B, Hille R. Biochemistry. 2011;50:1910. doi: 10.1021/bi1017182. [DOI] [PMC free article] [PubMed] [Google Scholar]
- 5.Dobbek H, Gremer L, Meyer O, Huber R. Proceedings of the National Academy of Sciences of the United States of America. 1999;96:8884. doi: 10.1073/pnas.96.16.8884. [DOI] [PMC free article] [PubMed] [Google Scholar]
- 6.Dobbek H, Gremer L, Kiefersauer R, Huber R, Meyer O. Proceedings of the National Academy of Sciences of the United States of America. 2002;99:15971. doi: 10.1073/pnas.212640899. [DOI] [PMC free article] [PubMed] [Google Scholar]
- 7.Zhang B, Hemann CF, Hille R. Journal of Biological Chemistry. 2010;285:12571. doi: 10.1074/jbc.M109.076851. [DOI] [PMC free article] [PubMed] [Google Scholar]
- 8.Wilcoxen J, Snider S, Hille R. Journal of the American Chemical Society. 2011;133:12934. doi: 10.1021/ja205073j. [DOI] [PubMed] [Google Scholar]
- 9.McWhirter RB, Hille R. Journal of Biological Chemistry. 1991;266:23724. [PubMed] [Google Scholar]
- 10.Manikandan P, Choi EY, Hille R, Hoffman BM. Journal of the American Chemical Society. 2001;123:2658. doi: 10.1021/ja003894w. [DOI] [PubMed] [Google Scholar]
- 11.Bray RC, Vanngard T. Biochemical Journal. 1969;114:725. doi: 10.1042/bj1140725. [DOI] [PMC free article] [PubMed] [Google Scholar]
- 12.Siegbahn PEM, Shestakov AF. Journal of Computational Chemistry. 2005;26:888. doi: 10.1002/jcc.20230. [DOI] [PubMed] [Google Scholar]
- 13.Hofmann M, Kassube JK, Graf T. Journal of Biological Inorganic Chemistry. 2005;10:490. doi: 10.1007/s00775-005-0661-5. [DOI] [PubMed] [Google Scholar]
- 14.Resch M, Dobbek H, Meyer O. Journal of Biological Inorganic Chemistry. 2005;10:518. doi: 10.1007/s00775-005-0006-4. [DOI] [PubMed] [Google Scholar]
- 15.Davoust CE, Doan PE, Hoffman BM. Journal of Magnetic Resonance Series A. 1996;119:38. [Google Scholar]
- 16.Doan PE, Telser J, Barney BM, Igarashi RY, Dean DR, Seefeldt LC, Hoffman BM. Journal of the American Chemical Society. 2011;133:17329. doi: 10.1021/ja205304t. [DOI] [PMC free article] [PubMed] [Google Scholar]
- 17.Solomon EI, Baldwin MJ, Lowery MD. Chemical Reviews. 1992;92:521. [Google Scholar]
- 18.Romao MJ, Archer M, Moura I, Moura JJG, Legall J, Engh R, Schneider M, Hof P, Huber R. Science. 1995;270:1170. doi: 10.1126/science.270.5239.1170. [DOI] [PubMed] [Google Scholar]
- 19.Santos-Silva T, Ferroni F, Thapper A, Marangon J, Gonzalez PJ, Rizzi AC, Moura I, Moura JJG, Romao MJ, Brondino CD. Journal of the American Chemical Society. 2009;131:7990. doi: 10.1021/ja809448r. [DOI] [PubMed] [Google Scholar]
- 20.Werst MM, Kennedy MC, Houseman ALP, Beinert H, Hoffman BM. Biochemistry. 1990;29:10533. doi: 10.1021/bi00498a016. [DOI] [PubMed] [Google Scholar]
- 21.Werst MM, Kennedy MC, Beinert H, Hoffman BM. Biochemistry. 1990;29:10526. doi: 10.1021/bi00498a015. [DOI] [PubMed] [Google Scholar]
- 22.Houseman ALP, Oh BH, Kennedy MC, Fan CL, Werst MM, Beinert H, Markley JL, Hoffman BM. Biochemistry. 1992;31:2073. doi: 10.1021/bi00122a026. [DOI] [PubMed] [Google Scholar]
- 23.Walsby CJ, Hong W, Broderick WE, Cheek J, Ortillo D, Broderick JB, Hoffman BM. Journal of the American Chemical Society. 2002;124:3143. doi: 10.1021/ja012034s. [DOI] [PubMed] [Google Scholar]
- 24.Shanmugam M, Zhang B, McNaughton RL, Kinney RA, Hille R, Hoffman BM. Journal of the American Chemical Society. 2010;132:14015. doi: 10.1021/ja106432h. [DOI] [PMC free article] [PubMed] [Google Scholar]
- 25.Hille R. In: Metals in Biology: Applications of High-Resolution EPR to Metalloenzymes. Hanson G, Berliner L, editors. Vol. 29. 2010. p. 91. [Google Scholar]
- 26.Roberts JE, Brown TG, Hoffman BM, Peisach J. J Am Chem Soc. 1980;102:826. [Google Scholar]
- 27.Hori H, Ikeda-Saito M, Yonetani T. J Biol Chem. 1981;256:7849. [PubMed] [Google Scholar]
- 28.Doan PE. Journal of Magnetic Resonance. 2011;208:76. doi: 10.1016/j.jmr.2010.10.008. [DOI] [PMC free article] [PubMed] [Google Scholar]
- 29.Kinney RA, Hetterscheid DGH, Hanna BS, Schrock RR, Hoffman BM. Inorganic Chemistry. 2010;49:704. doi: 10.1021/ic902006v. [DOI] [PMC free article] [PubMed] [Google Scholar]
- 30.Holm RH, Kennepohl P, Solomon EI. Chem Rev. 1996;96:2239. doi: 10.1021/cr9500390. [DOI] [PubMed] [Google Scholar]
- 31.LaCroix LB, Shadle SE, Wang YN, Averill BA, Hedman B, Hodgson KO, Solomon EI. Journal of the American Chemical Society. 1996;118:7755. [Google Scholar]
- 32.Penfield KW, Gay RR, Himmelwright RS, Eickman NC, Norris VA, Freeman HC, Solomon EI. Journal of the American Chemical Society. 1981;103:4382. [Google Scholar]
- 33.Roberts JE, Cline JF, Lum V, Gray HB, Freeman H, Peisach J, Reinhammar B, Hoffman BM. J Am Chem Soc. 1984;106:5324. [Google Scholar]
- 34.Chow C, Chang K, Willett RD. J Chem Phys. 1973;59:2629. [Google Scholar]
- 35.Gourlay C, Nielsen DJ, White JM, Knottenbelt SZ, Kirk ML, Young CG. Journal of the American Chemical Society. 2006;128:2164. doi: 10.1021/ja056500f. [DOI] [PubMed] [Google Scholar]
- 36.Howes BD, Bennett B, Bray RC, Richards RL, Lowe DJ. Journal of the American Chemical Society. 1994;116:11624. [Google Scholar]
- 37.Howes BD, Bray RC, Richards RL, Turner NA, Bennett B, Lowe DJ. Biochemistry. 1996;35:1432. doi: 10.1021/bi9520500. [DOI] [PubMed] [Google Scholar]
- 38.Howes BD, Bray RC, Richards RL, Turner NA, Bennett B, Lowe DJ. Biochemistry. 1996;35:3874. doi: 10.1021/bi9520500. [DOI] [PubMed] [Google Scholar]
- 39.Manikandan P, Choi EY, Hille R, Hoffman BM. J Am Chem Soc. 2001;123:2658. doi: 10.1021/ja003894w. [DOI] [PubMed] [Google Scholar]
- 40.Sempombe J, Stein B, Kirk ML. Inorganic Chemistry. 2011;50:10919. doi: 10.1021/ic201477n. [DOI] [PMC free article] [PubMed] [Google Scholar]
- 41.Pauff JM, Zhang JJ, Bell CE, Hille R. Journal of Biological Chemistry. 2008;283:4818. doi: 10.1074/jbc.M707918200. [DOI] [PubMed] [Google Scholar]
- 42.Hille R, Kim JH, Hemann C. Biochemistry. 1993;32:3973. doi: 10.1021/bi00066a018. [DOI] [PubMed] [Google Scholar]
- 43.Stiefel EI, Gardner JK. Journal of the Less-Common Metals. 1974;36:521. [Google Scholar]
- 44.Stiefel EI. Proceedings of the National Academy of Sciences of the United States of America. 1973;70:988. doi: 10.1073/pnas.70.4.988. [DOI] [PMC free article] [PubMed] [Google Scholar]
- 45.Klein EL, Astashkin AV, Raitsimring AM, Enemark JH. Coordination Chemistry Reviews. 2013;257:110. doi: 10.1016/j.ccr.2012.05.038. [DOI] [PMC free article] [PubMed] [Google Scholar]
- 46.Astashkin AV, Hood BL, Feng CJ, Hille R, Mendel RR, Raitsimring AM, Enemark JH. Biochemistry. 2005;44:13274. doi: 10.1021/bi051220y. [DOI] [PubMed] [Google Scholar]
Associated Data
This section collects any data citations, data availability statements, or supplementary materials included in this article.