CT can be useful to obtain minimally invasive reliable estimates of bilateral single-kidney function in human subjects.
Abstract
Purpose
To test the hypothesis that computed tomography (CT)–derived measurements of single-kidney glomerular filtration rate (GFR) obtained in human subjects with 64-section CT agree with those obtained with iothalamate clearance, a rigorous reference standard.
Materials and Methods
The institutional review board approved this HIPAA-compliant study, and written informed consent was obtained. Ninety-six patients (age range, 51–73 years; 46 men, 50 women) with essential (n = 56) or renovascular (n = 40) hypertension were prospectively studied in controlled conditions (involving sodium intake and renin-angiotensin blockade). Single-kidney perfusion, volume, and GFR were measured by using multidetector CT time-attenuation curves and were compared with GFR measured by using iothalamate clearance, as assigned to the right and left kidney according to relative volumes. The reproducibility of CT GFR over a 3-month period (n = 21) was assessed in patients with renal artery stenosis who were undergoing stable medical treatment. Statistical analysis included the t test, Wilcoxon signed rank test, linear regression, and Bland-Altman analysis.
Results
CT GFR values were similar to those of iothalamate clearance (mean ± standard deviation, 38.2 mL/min ± 18 vs 41.6 mL/min ± 17; P = .062). Stenotic kidney CT GFR in patients with renal artery stenosis was lower than contralateral kidney GFR or essential hypertension single-kidney GFR (mean, 23.1 mL/min ± 13 vs 36.9 mL/min ± 17 [P = .0008] and 45.2 mL/min ± 16 [P = .019], respectively), as was iothalamate clearance (mean, 26.9 mL/min ± 14 vs 38.5 mL/min ± 15 [P = .0004] and 49.0 mL/min ± 14 [P = .001], respectively). CT GFR correlated well with iothalamate GFR (linear regression, CT GFR = 0.88*iothalamate GFR, r2 = 0.89, P < .0001), and Bland-Altman analysis was used to confirm the agreement. CT GFR was also moderately reproducible in medically treated patients with renal artery stenosis (concordance coefficient correlation, 0.835) but was unaffected by revascularization (mean, 25.3 mL/min ± 15.2 vs 30.3 mL/min ± 18.5; P = .097).
Conclusion
CT assessments of single-kidney GFR are reproducible and agree well with a reference standard. CT can be useful to obtain minimally invasive estimates of bilateral single-kidney function in human subjects.
© RSNA, 2015
Introduction
Single-kidney glomerular filtration rate (GFR) may be important in the assessment for kidney donation and in patients with unilateral kidney disorders, such as ureteral obstruction, malformation of the urinary tract, or renal artery stenosis. The assessment of split kidney function has traditionally been achieved with radioactive agents and renal imaging systems (1–4), which for technical reasons are inaccurate compared with reference methods like inulin clearance (1,2) and often provide only relative renal function. Therefore, simple and accurate quantification of single-kidney GFR remains a challenge clinically (1,4).
Computed tomography (CT) is often performed for clinical indications and could provide an opportunity to assess both renal anatomy and split renal function in the same session. Absolute GFR was initially quantified by using CT scanners with modest spatial and temporal resolution (5–8). Yet, the advent of subsecond helical CT scanners with improved spatial and temporal resolution, in conjunction with application of the indicator dilution theory, allows calculation of renal perfusion and GFR from the same time-attenuation curves. We have previously shown the feasibility of obtaining electron beam CT–derived measurements of renal blood flow (RBF) in human subjects and both RBF and GFR in animal models (8–12). We have also shown that 64-section multidetector CT provides reliable assessment of single-kidney GFR in pigs (10). However, the ability to obtain accurate estimates of GFR in human subjects remains unknown.
This study served to test the hypothesis that CT-derived measurements of single-kidney GFR obtained in human subjects by using 64-section CT would agree well with those obtained by using iothalamate clearance, a rigorous reference standard.
Materials and Methods
Patients
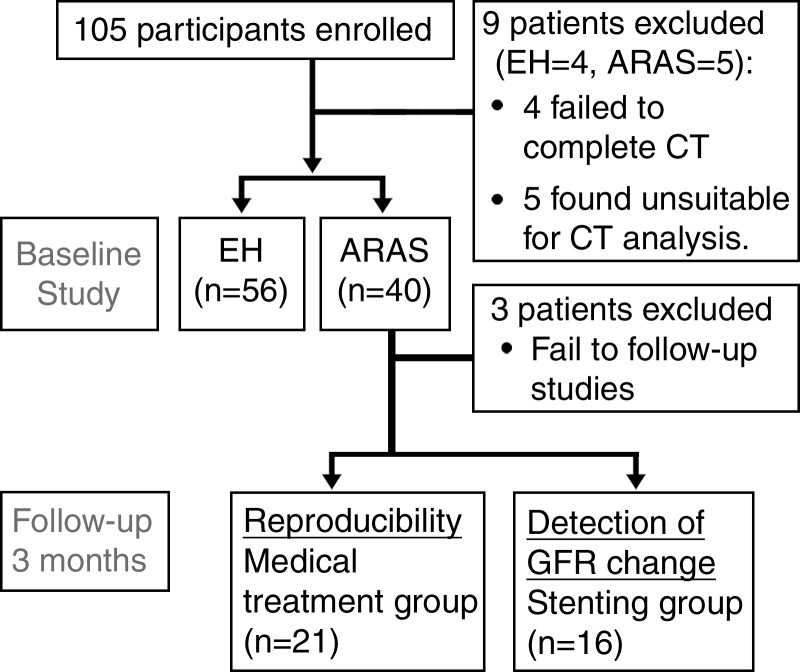
The study was approved by the institutional review board and was Health Insurance Portability and Accountability Act compliant. Written informed consent was obtained from each patient. We prospectively recruited 105 hypertensive patients aged at least 18 years, with essential hypertension (EH) or atherosclerotic renal artery stenosis (ARAS) and with serum creatinine levels of less than 2.5 mg/dL [221 μmol/L] (because of the need to use contrast media) to participate in studies (13,14) between January 2008 and September 2012. Similar to the Cardiovascular Outcomes with Renal Atherosclerotic Lesions study (15), ARAS was defined as cross-sectional luminal obstruction of more than 60% per CT or magnetic resonance (MR) angiography or Doppler velocities of at least 300 cm/sec. Exclusion criteria included failure to complete the study owing to medical reasons and/or the patient’s safety, study withdrawal, a nonfunctioning kidney, and technical difficulty in analysis, such as severe artifacts or anatomic abnormalities. Of 105 patients examined, nine (four with EH, five with ARAS) did not complete studies because of an inability to hold their breath during scanning (two patients with ARAS and one with EH), vasovagal attack before CT (one patient with EH), multiple cysts (two patients with EH), or extremely atrophic kidneys (three patients with ARAS) (Fig 1). The 3-day inpatient protocol in the clinical research unit included regulated dietary intake of sodium (150 mEq per day) and an isocaloric diet, measurement of GFR by means of iothalamate clearance on day 1, and CT scanning on day 3. On day 2, MR imaging studies that included furosemide injection (20 mg) were performed for unrelated studies (13).
Figure 1:
Flowchart of the experimental study design and patient enrollment.
Patients with ARAS subsequently underwent renal stent placement or continued their medical therapy, according to clinical indications and management decisions. For uniformity, all patients were treated with agents that block the renin-angiotensin system (angiotensin-converting enzyme inhibitors or angiotensin receptor blockers). Thirty-seven patients with ARAS returned for repeat measurements 3 months after the initial protocol, with or without revascularization performed after standard procedures. Three patients did not complete follow-up studies owing to medical reasons unrelated to this study. After stent placement, renal angiography was used to exclude any residual segmental or intrarenal disease.
Renal Function and Blood Pressure
Plasma clearance of iothalamate (iothalamate meglumine, Conray; Mallinckrodt, St Louis, Mo) was measured as the reference standard for GFR. Iothalamate GFR was then calculated from the concentration of iothalamate in timed urine and blood collections. On the day of the test, the patients fasted for 4 hours preceding the test but had four glasses of water. Patients were given oral hydration of 200 mL/min throughout the test. Baseline urine and plasma samples were obtained. Two timed collections were performed; patients received a single subcutaneous injection of 0.5 mL of iothalamate, and iothalamate clearance was calculated at a 45-minute equilibration period from the change in its concentration (14,16). To estimate single-kidney iothalamate clearance, total iothalamate clearance was apportioned by the percentage of volume for each kidney—that is, it was multiplied by fractional renal volume (right or left volume divided by the sum of right and left renal volumes), assuming that the relative contribution of each kidney would be approximately proportional to its size (8,9). We also calculated estimated GFR by using the Modification of Diet in Renal Disease equation (17). Blood pressure was measured by means of automated oscillometric recording (Omron blood pressure monitor; Omron, Kyoto, Japan), averaging three measurements at 5, 7, and 9 minutes after a 5-minute rest. Blood samples for plasma renin activity were obtained from the inferior venal cava and stenotic renal vein of all patients, as described previously (18). Samples were centrifuged, and the supernatant was stored at −80°C until measurement.
CT Studies
A 5-F pigtail Cobra catheter (Cook, Bloomington, Ind) was placed in the right atrium for central venous injection of contrast material for flow studies by using a dual-source 64-section helical multidetector CT scanner (Somatom Definition; Siemens Medical Solutions, Forchheim, Germany), as described previously (14). Flow scans were performed (by A.S., with 3 years of experience) at 120 kVp and 160 mAs (adjusted per level of signal-to-noise ratio of the scan) with 20 × 1.2 collimation and 0 table feed and were composed of 45 acquisitions, of which the first 35 acquisitions were divided into three consecutive scanning sequences (each 20 seconds long), followed by 10 additional acquisitions at 8-second intervals. Four tomographic sections (each with 5-mm thickness) localized in the hilum region were acquired after a bolus injection of iopamidol-370 or iohexol-350 (0.5 mL per kilogram of body weight up to 40 mL at approximately 10 mL/sec) by using a power injector during coached respiratory suspension and reconstructed by using a B40f kernel. Fifteen minutes later, a kidney volume study (5-mm-thick sections) was performed in the helical mode after a second similar contrast material injection to determine right and left cortical and medullary regional volumes.
The total effective dose of radiation associated with all the sequences (non–contrast enhanced, test bolus, perfusion, volume, and delay) was calculated with dosimetry as 26.4 mSv for men and 27.3 mSv for women.
CT Data Analysis
Multidetector CT images were reconstructed and displayed with the Analyze software package (Biomedical Imaging Resource; Mayo Clinic, Rochester, Minn) to delineate cortical and medullary regions of interest in each kidney (A.S.). Cortical time-attenuation data were then plotted and fitted by using an extended gamma-variate model to derive curve-fitting parameters to obtain measures of renal function, as described previously (8,10,19). Briefly, GFR was derived from the initial acquisitions that defined the slope of the proximal tubular curve, which represents the rate of contrast medium accumulation subsequent to glomerular filtration. Regional GFR (milliliters per minute per cubic centimeter of tissue) was calculated as follows: [(slope of proximal tubular curve × cortical vascular mean transit time)/area under the cortical vascular curve] × 60 × (1 − hematocrit). Finally, regional GFR was multiplied by the corresponding cortical volume (measured by means of planimetry) to obtain absolute GFR (in milliliters per minute). Renal volumes were measured (A.S.) with previously validated statistical volume estimation with the Analyze package, which involves sampling of randomly distributed points over the identified region of interest. On each CT section, the cortex, medulla, and renal contours were differentiated by the substantial cortical enhancement during the vascular phase, and the volumes were calculated from the number of sampled points (9). RBF was subsequently calculated as the sum of cortical and medullary blood flows obtained from each cortex and medulla as the product of its perfusion and volume (11).
Statistical Analysis
Data were analyzed (by S.H.K., with 8 years of experience) by using the JMP software package version 8.0 (SAS Institute, Cary, NC). Comparisons between independent groups with hypertension or ARAS were performed by using the unpaired two-tailed t test (or the Wilcoxon rank sum test for skewed data). Correlation coefficients were calculated by using the least-squares fit (forced through zero) to assess the relationship between CT GFR and reference GFR, and Bland-Altman analysis was used to evaluate the agreement between them. Linear regression model assumptions of linearity, independence of observations, normality of error terms, and homoscedasticity were all checked by using SAS Diagnostic Tools (SAS Institute). We defined the outliers who had at least 30 mL/min difference between CT GFR and iothalamate GFR and analyzed their characteristics. Reproducibility was checked with the Lin concordance coefficient correlation test in the medically treated group. To detect the GFR change in stent groups, we compared values between kidneys in the same individual (before and after revascularization) by using the Wilcoxon signed rank test. Statistical significance for all tests was judged at P less than .05.
Results
Demographic Comparison between Patients with EH and Those with ARAS
The 96 participants (192 kidneys) in the analysis included 56 patients with EH and 40 with ARAS. Ten patients in the ARAS group had bilateral stenosis; four underwent bilateral stent placement, three underwent unilateral stent placement, and three continued medical therapy. Age, serum creatinine level, urinary protein excretion, and plasma renin activity were higher in patients with ARAS, whereas Modification of Diet in Renal Disease–estimated GFR and diastolic blood pressure were lower (Table 1).
Table 1.
Baseline Clinical Characteristics of Hypertensive Patients
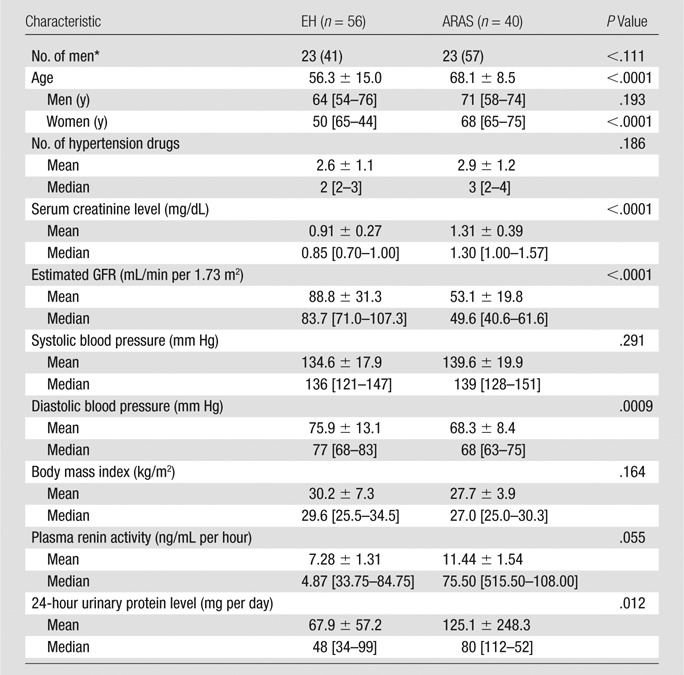
Note.—Mean values are presented as means ± standard deviations, and median values are presented with interquartile ranges in brackets. To convert milligrams per deciliter to micromoles per liter, multiply by 88.4.
*Numbers in parentheses are percentages.
GFR from CT and Iothalamate Clearance
Among all kidneys, means ± standard deviations of single-kidney CT GFR (38.2 mL/min ± 18.6) and iothalamate GFR (41.6 mL/min ± 17.3) were not significantly different (P = .062). Wilcoxon rank sum tests showed that they did not differ within either patient group and that stenotic kidney GFR measured with either method was lower compared with both the nonstenotic ARAS kidney and EH GFR (Table 2).
Table 2.
Single-Kidney GFR in Patients with EH and Those with ARAS
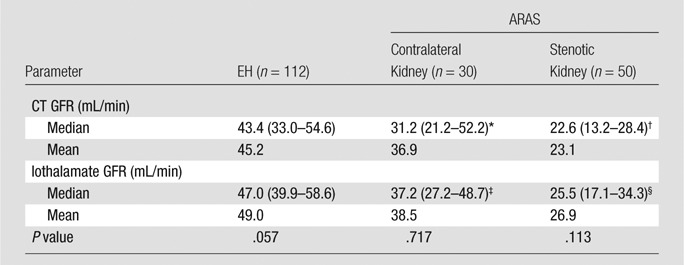
Note.—Numbers in parentheses are interquartile ranges.
*P = .019 versus patients with EH.
†P = .0008 versus the contralateral kidney in patients with ARAS.
‡P = .001 versus patients with EH.
§P = .0004 versus the contralateral kidney in patients with ARAS.
Correlation between Single-Kidney CT GFR and Iothalamate GFR
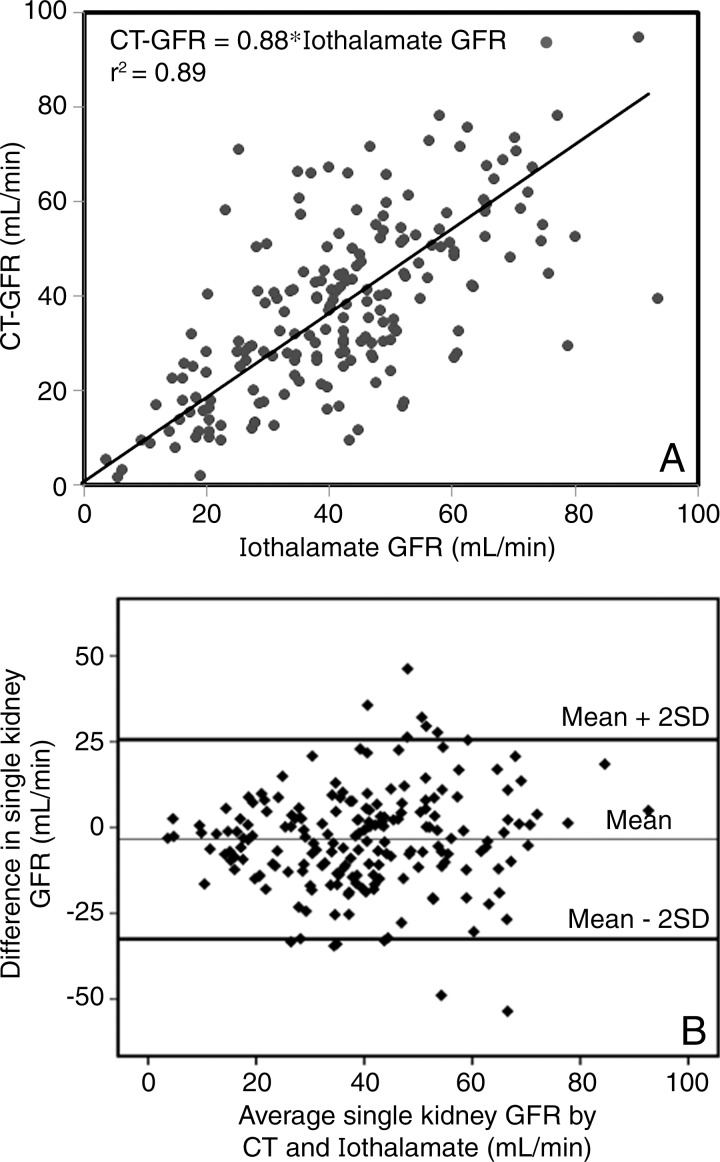
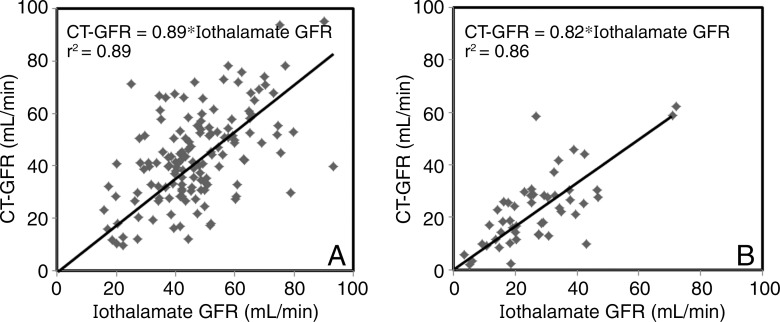
Regression analysis showed a moderate linear correlation between the two methods (r2 = 0.89 with no intercept, CT GFR = 0.88*iothalamate; and r2 = 0.45 with intercept, CT GFR = 0.72*iothalamate GFR + 7.98; both P < .0001), with a standard error of the estimate of 14.0 mL/min (no intercept) and 13.6 mL/min (with intercept) (Fig 1). Bland-Altman plots showed moderate agreement between CT- and iothalamate-derived single-kidney GFR without consistent skewing (Fig 2). When subgroups are considered, GFR values obtained for nonstenotic (n = 142) and stenotic (n = 50) kidneys each also correlated significantly with iothalamate clearance (r2 = 0.89, standard error of the estimate = 15.3 mL/min; and r2 = 0.86, standard error of the estimate = 9.6 mL/min, respectively; P < .0001 for both; Fig 3). SAS Diagnostic Tools (SAS Institute) yielded no deviations from the model assumptions. We identified no unifying characteristics of nine outliers.
Figure 2:
Plots show linear regression analysis of, A, iothalamate GFR and, B, single-kidney CT-derived GFR in the entire patient cohort. Bland-Altman analysis demonstrates the agreement between the two measures of GFR.
Figure 3:
Plots show linear regression analysis of, A, stenotic kidney and, B, nonstenotic kidney CT GFR and iothalamate GFR.
Reproducibility and Detection of GFR Change in CT GFR Measurement
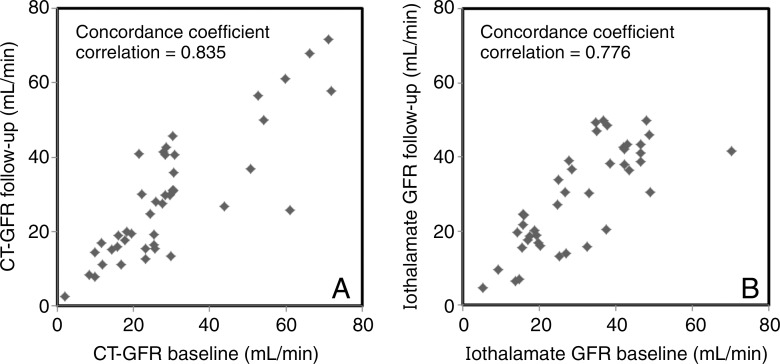
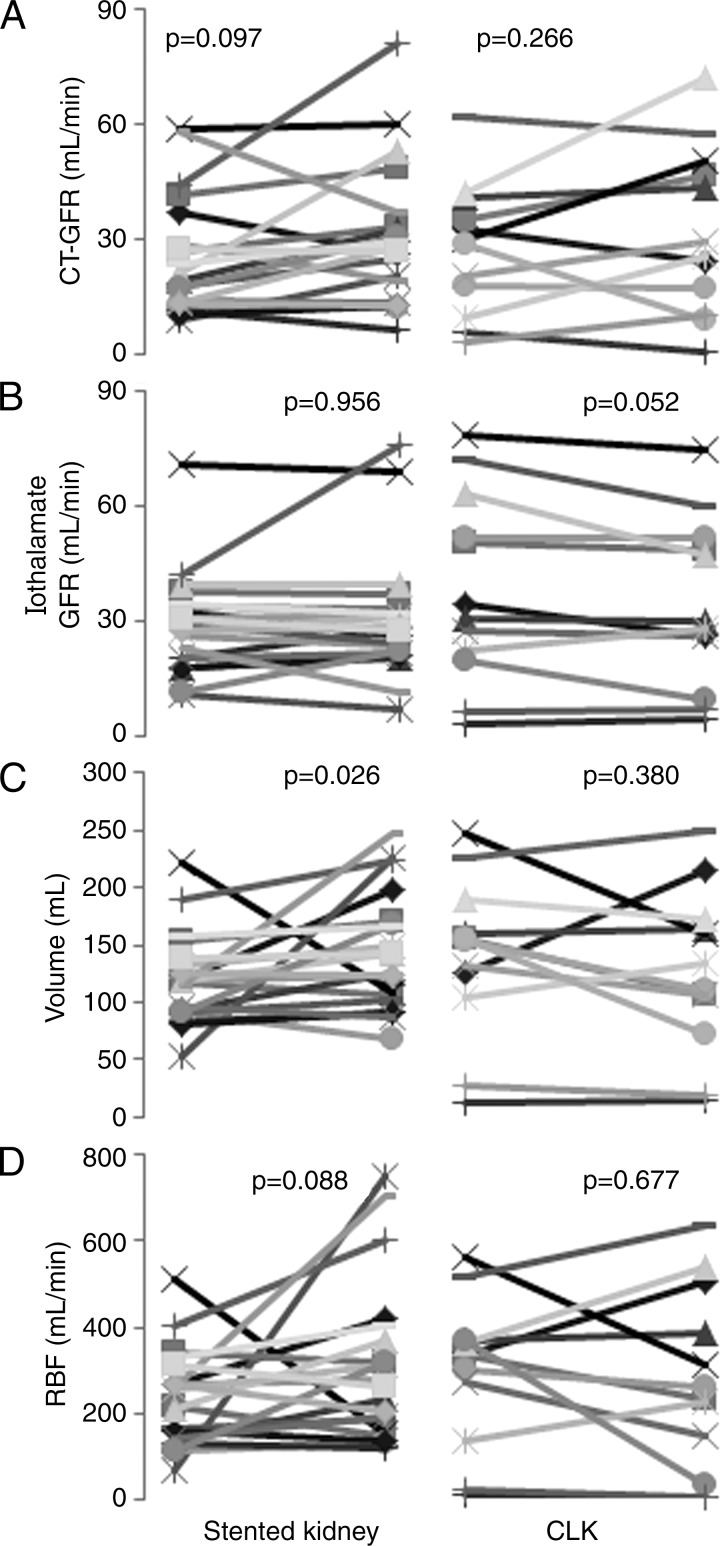
Thirty-seven patients with ARAS completed follow-up studies. In the medically treated group (n = 21), CT and iothalamate GFR of stenotic or nonstenotic kidney at the 3-month follow-up were similar to values measured at baseline, and serum creatinine level and blood pressure were not significantly changed (Fig 4). The group with stents (n = 16) also showed no change in either iothalamate or CT GFR in either kidney 3 months after the procedure. In the group with stents, mean serum creatinine levels decreased after revascularization (1.53 mg/dL ± 0.38 to 1.23 mg/dL ± 0.28 [135.25 μmol/L ± 33.59 to 108.73 μmol/L ± 24.75], P = .0005), and stenotic kidney volume increased, but blood pressure and RBF did not change (Fig 5).
Figure 4:
Plots of concordance coefficient analysis used to compare GFR values at baseline with 3 months of follow-up in the medical treatment group. A, CT GFR and, B, iothalamate GFR are shown.
Figure 5:
Graphs of individual single-kidney GFR, volume, and RBF determined by means of CT or iothalamate clearance at baseline and at 3-month follow-up in the stented group. A, CT GFR, B, iothalamate GFR, C, kidney volume, and D, RBF are shown. Revascularization did not affect CT GFR, iothalamate GFR, or RBF (patients with stents, n = 16; kidneys with stents, n = 20; contralateral kidneys without stents [CLK], n = 12).
Discussion
Our study demonstrates the feasibility of deriving reliable estimates of single-kidney GFR by using multidetector CT. We found that measurement of GFR obtained by using CT and iothalamate clearance in patients with EH and ARAS showed moderate agreement and were linearly correlated over a wide range of values. Single-kidney CT GFR was used to detect the asymmetric function in patients with ARAS, which was similar to reference values. In the EH group, GFR was higher than that in the stenotic or contralateral ARAS kidneys, which was consistent with Modification of Diet in Renal Disease–estimated GFR. These results suggest that multidetector CT may be a useful tool to evaluate kidney function.
CT may provide data to describe important physiologic parameters in the kidney, such as RBF, regional perfusion, and GFR (5,11,12). GFR is widely accepted as the most representative index of kidney function. Thus, its determination Using CT should be valuable in the clinical setting. In this study, as a reference value we used iothalamate GFR, which is used most commonly in the development of recent GFR estimation equations. Iothalamate GFR correlates well with urinary clearance of inulin in both healthy subjects (20) and patients with hypertensive chronic kidney disease (21). Our study demonstrated a moderate correlation of CT GFR with this robust reference standard, as well as its reproducibility in patients with ARAS. These results imply that estimation of CT GFR with a standardized CT protocol could constitute a reliable method for determining single-kidney GFR.
We previously showed good correlation between single-kidney GFR and inulin clearance in a swine model (9), and the current study shows a moderate correlation with iothalamate clearance in human subjects, as well. Iothalamate GFR was slightly higher than CT GFR, possibly because of its tubular secretion (22,23) or inaccuracies consequent to our method of apportioning GFR. Imprecision may also result from difficulties in the accurate measurement of urine volume and timing, iothalamate concentration, and incomplete bladder emptying (23). Alternatively, inaccuracies in curve fitting and modeling or acute effects of contrast media might all undermine CT analysis.
Previous studies were conducted to investigate the feasibility of assessing CT GFR by using other methods (3,5–8,24–28). The Patlak method is a two-compartment technique in which it is assumed that the contrast agent is fully trapped within the system at the time of measurement (29), but the complexity of tubular anatomy is neglected. Tubular function concentration or dilution of contrast agent could lead to inaccurate assessments of contrast material concentration and thereby over- or underestimation of the glomerular filtration (9,26). We have shown that time-attenuation modeling provides more robust estimates of GFR (9). In addition, Frennby et al previously defined GFR from the accumulation of nonionic contrast material in the kidney within a few minutes after intravenous injection and compared it with radiolabeled scintigraphy (6,24). This method was simple, but the assumption that contrast agents must all be contained within the kidney at these times may cause underestimation of GFR (25). Our extended gamma-variate modeling of first-pass cortical time-attenuation curves accounts for vascular and extravascular compartments (8) and was validated in a swine model against inulin clearance. This study extends our previous observations by showing in human subjects a moderate correlation of CT GFR compared with iothalamate GFR, a rigorous clinical reference standard for GFR (21,30).
Interestingly, stenotic kidney CT GFR showed slightly better correlation with iothalamate GFR than that of nonstenotic kidneys, possibly owing to more extreme values that improve the correlation coefficient. Hence, this method might be more useful in stenotic kidneys to detect ARAS or assess treatment response. In addition, although the Bland-Altman analysis did not exhibit a consistent bias, lower GFR values might narrow the differences between two methods. Notably, restoring stenotic kidney blood flow after stent placement was not associated with improved GFR, as is consistent with previous clinical studies (14,15,31). Experimental models demonstrating that ARAS induces microvascular rarefaction, oxidative stress injury, and interstitial fibrosis within stenotic kidney may account for the irreversible renal dysfunction, which remained unchanged after reperfusion (32).
Our methods are limited by the use of central contrast material injection by using a catheter advanced after renal vein sampling. This allowed for a single tight bolus injection of contrast material, which better complies with the assumptions underlying the indicator dilution theory but does not involve the use of peripheral intravenous contrast material infusion, as is used most often for clinical CT. However, lower-rate peripheral injections of contrast media might suffice, as was shown in pigs for measurements of RBF (33). Second, single-kidney iothalamate GFR was apportioned for individual kidneys by their fractional volumes, an assumption that may affect the correlation and agreement between two GFR methods. However, we have previously used this method successfully to assess the relative GFR of each kidney (8,9). Third, we did not have a normal control group, our subjects were all hypertensive, and they were treated with antihypertensive medications that might have affected GFR values, although the effects of drugs on the relationship between CT and iothalamate remain to be defined. Also, our approach has yet to be applied to other kidney abnormalities, and until it is validated in other diseases, the data need to be interpreted cautiously. Physiological changes in GFR over the course of 3 months may also account for the moderate reproducibility of our measurements, as suggested by the similarly modest reproducibility of iothalamate GFR. Additional studies are needed to confirm the accuracy of CT single-kidney GFR in other populations. Finally, CT GFR is limited by the need for contrast media and by the radiation burden, which should be weighed carefully for safety in individual patients and considered in patients undergoing CT for clinical benefit. The effective dose incurred in our studies (26–27 mSv) was much higher than that associated with typical CT examinations (about 1–12 mSv), but dose optimization and reduction strategies can reduce the dose from CT by a factor of two to four (34). Notably, in the present study, we used a protocol that encompassed 45 acquisitions to depict the transit of contrast material throughout the renal tubular system, but a smaller number of acquisitions would likely suffice to obtain accurate estimates of GFR alone.
In conclusion, CT can be useful to obtain minimally invasive reliable estimates of bilateral single-kidney function in human subjects. High speed, remarkable spatial and temporal resolution, and minimal invasiveness make CT a useful tool to study the kidney in various conditions. Further studies are required to confirm the clinical usefulness and significance of the method in other forms of renal disease.
Advances in Knowledge
■ Single-kidney glomerular filtration rate (GFR) was measured by using multidetector CT (mean ± standard deviation, 38.2 mL/min ± 18.6 [range, 25.9–51.3 mL/min]).
■ Single-kidney GFR with multidetector CT correlates with iothalamate single-kidney GFR (CT GFR = 0.88*iothalamate GFR).
■ Multidetector CT–derived single-kidney GFR values are similar between time intervals (concordance coefficient correlation, 0.835).
Implication for Patient Care
■ The method introduced in this study may assist radiologists and other clinicians in assessing kidney function and structure simultaneously with multidetector CT.
Received August 20, 2014; revision requested October 2; revision received November 21; accepted December 22; final version accepted January 13, 2015.
Funding: This research was supported by the National Institutes of Health (grants DK73608, HL121561, DK100081, HL123160, and UL1TR000135).
Abbreviations:
- ARAS
- atherosclerotic renal artery stenosis
- EH
- essential hypertension
- GFR
- glomerular filtration rate
- RBF
- renal blood flow
Disclosures of Conflicts of Interest: S.H.K. disclosed no relevant relationships. A.S. disclosed no relevant relationships. S.M.H. disclosed no relevant relationships. S.C.T. disclosed no relevant relationships. L.O.L. Activities related to the present article: disclosed no relevant relationships. Activities not related to the present article: institution received payment from Stealth Biopharmaceuticals for consultancy; institution received grants from Stealth Biopharmaceuticals and AstraZeneca; author received royalties from COBAR for development of a peptide. Other relationships: disclosed no relevant relationships.
References
- 1.Itoh K. Comparison of methods for determination of glomerular filtration rate: Tc-99m-DTPA renography, predicted creatinine clearance method and plasma sample method. Ann Nucl Med 2003;17(7):561–565. [DOI] [PubMed] [Google Scholar]
- 2.Ma YC, Zuo L, Zhang CL, Wang M, Wang RF, Wang HY. Comparison of 99mTc-DTPA renal dynamic imaging with modified MDRD equation for glomerular filtration rate estimation in Chinese patients in different stages of chronic kidney disease. Nephrol Dial Transplant 2007;22(2):417–423. [DOI] [PubMed] [Google Scholar]
- 3.Nilsson H, Wadström J, Andersson LG, Raland H, Magnusson A. Measuring split renal function in renal donors: can computed tomography replace renography? Acta Radiol 2004;45(4):474–480. [DOI] [PubMed] [Google Scholar]
- 4.Stevens LA, Levey AS. Measured GFR as a confirmatory test for estimated GFR. J Am Soc Nephrol 2009;20(11):2305–2313. [DOI] [PubMed] [Google Scholar]
- 5.Dawson P, Peters AM. Functional imaging in computed tomography. The use of contrast-enhanced computed tomography for the study of renal function and physiology. Invest Radiol 1993;28(Suppl 5):S79–S84; discussion S85–S86. [PubMed] [Google Scholar]
- 6.Frennby B, Almén T, Lilja B, et al. Determination of the relative glomerular filtration rate of each kidney in man. Comparison between iohexol CT and 99mTc-DTPA scintigraphy. Acta Radiol 1995;36(4):410–417. [PubMed] [Google Scholar]
- 7.Hackstein N, Puille MF, Bak BH, Scharwat O, Rau WS. Measurement of single kidney contrast media clearance by multiphasic spiral computed tomography: preliminary results. Eur J Radiol 2001;39(3):201–208. [DOI] [PubMed] [Google Scholar]
- 8.Krier JD, Ritman EL, Bajzer Z, Romero JC, Lerman A, Lerman LO. Noninvasive measurement of concurrent single-kidney perfusion, glomerular filtration, and tubular function. Am J Physiol Renal Physiol 2001;281(4):F630–F638. [DOI] [PubMed] [Google Scholar]
- 9.Daghini E, Juillard L, Haas JA, Krier JD, Romero JC, Lerman LO. Comparison of mathematic models for assessment of glomerular filtration rate with electron-beam CT in pigs. Radiology 2007;242(2):417–424. [DOI] [PubMed] [Google Scholar]
- 10.Daghini E, Primak AN, Chade AR, et al. Assessment of renal hemodynamics and function in pigs with 64-section multidetector CT: comparison with electron-beam CT. Radiology 2007;243(2):405–412. [DOI] [PubMed] [Google Scholar]
- 11.Lerman LO, Bell MR, Lahera V, et al. Quantification of global and regional renal blood flow with electron beam computed tomography. Am J Hypertens 1994;7(9 Pt 1):829–837. [DOI] [PubMed] [Google Scholar]
- 12.Lerman LO, Taler SJ, Textor SC, Sheedy PF, 2nd, Stanson AW, Romero JC. Computed tomography-derived intrarenal blood flow in renovascular and essential hypertension. Kidney Int 1996;49(3):846–854. [DOI] [PubMed] [Google Scholar]
- 13.Gloviczki ML, Glockner JF, Crane JA, et al. Blood oxygen level-dependent magnetic resonance imaging identifies cortical hypoxia in severe renovascular disease. Hypertension 2011;58(6):1066–1072. [DOI] [PMC free article] [PubMed] [Google Scholar]
- 14.Saad A, Herrmann SM, Crane J, et al. Stent revascularization restores cortical blood flow and reverses tissue hypoxia in atherosclerotic renal artery stenosis but fails to reverse inflammatory pathways or glomerular filtration rate. Circ Cardiovasc Interv 2013;6(4):428–435. [DOI] [PMC free article] [PubMed] [Google Scholar]
- 15.Cooper CJ, Murphy TP, Cutlip DE, et al. Stenting and medical therapy for atherosclerotic renal-artery stenosis. N Engl J Med 2014;370(1):13–22. [DOI] [PMC free article] [PubMed] [Google Scholar]
- 16.Wilson DM, Bergert JH, Larson TS, Liedtke RR. GFR determined by nonradiolabeled iothalamate using capillary electrophoresis. Am J Kidney Dis 1997;30(5):646–652. [DOI] [PubMed] [Google Scholar]
- 17.Levey AS, Bosch JP, Lewis JB, Greene T, Rogers N, Roth D. A more accurate method to estimate glomerular filtration rate from serum creatinine: a new prediction equation. Modification of Diet in Renal Disease Study Group. Ann Intern Med 1999;130(6):461–470. [DOI] [PubMed] [Google Scholar]
- 18.Eirin A, Gloviczki ML, Tang H, et al. Inflammatory and injury signals released from the post-stenotic human kidney. Eur Heart J 2013;34(7):540–548a. [DOI] [PMC free article] [PubMed] [Google Scholar]
- 19.Chade AR, Rodriguez-Porcel M, Grande JP, et al. Distinct renal injury in early atherosclerosis and renovascular disease. Circulation 2002;106(9):1165–1171. [DOI] [PubMed] [Google Scholar]
- 20.Rosenbaum RW, Hruska KA, Anderson C, Robson AM, Slatopolsky E, Klahr S. Inulin: an inadequate marker of glomerular filtration rate in kidney donors and transplant recipients? Kidney Int 1979;16(2):179–186. [DOI] [PubMed] [Google Scholar]
- 21.Perrone RD, Steinman TI, Beck GJ, et al. Utility of radioisotopic filtration markers in chronic renal insufficiency: simultaneous comparison of 125I-iothalamate, 169Yb-DTPA, 99mTc-DTPA, and inulin. The Modification of Diet in Renal Disease Study. Am J Kidney Dis 1990;16(3):224–235. [DOI] [PubMed] [Google Scholar]
- 22.Ott NT. A simple technique for estimating glomerular filtration rate with subcutaneous injection of (125I)lothalamate. Mayo Clin Proc 1975;50(11):664–668. [PubMed] [Google Scholar]
- 23.Kwong YT, Stevens LA, Selvin E, et al. Imprecision of urinary iothalamate clearance as a gold-standard measure of GFR decreases the diagnostic accuracy of kidney function estimating equations. Am J Kidney Dis 2010;56(1):39–49. [DOI] [PMC free article] [PubMed] [Google Scholar]
- 24.Frennby B, Almén T. Use of spiral CT and the contrast medium iohexol to determine in one session aortorenal morphology and the relative glomerular filtration rate of each kidney. Eur Radiol 2001;11(11):2270–2277. [DOI] [PubMed] [Google Scholar]
- 25.Tsushima Y, Blomley MJ, Okabe K, Tsuchiya K, Aoki J, Endo K. Determination of glomerular filtration rate per unit renal volume using computerized tomography: correlation with conventional measures of total and divided renal function. J Urol 2001;165(2):382–385. [DOI] [PubMed] [Google Scholar]
- 26.Hackstein N, Bauer J, Hauck EW, Ludwig M, Krämer HJ, Rau WS. Measuring single-kidney glomerular filtration rate on single-detector helical CT using a two-point Patlak plot technique in patients with increased interstitial space. AJR Am J Roentgenol 2003;181(1):147–156. [DOI] [PubMed] [Google Scholar]
- 27.Hackstein N, Buch T, Rau WS, Weimer R, Klett R. Split renal function measured by triphasic helical CT. Eur J Radiol 2007;61(2):303–309. [DOI] [PubMed] [Google Scholar]
- 28.Summerlin AL, Lockhart ME, Strang AM, Kolettis PN, Fineberg NS, Smith JK. Determination of split renal function by 3D reconstruction of CT angiograms: a comparison with gamma camera renography. AJR Am J Roentgenol 2008;191(5):1552–1558. [DOI] [PMC free article] [PubMed] [Google Scholar]
- 29.Patlak CS, Blasberg RG. Graphical evaluation of blood-to-brain transfer constants from multiple-time uptake data. Generalizations. J Cereb Blood Flow Metab 1985;5(4):584–590. [DOI] [PubMed] [Google Scholar]
- 30.Levey AS, Greene T, Schluchter MD, et al. Glomerular filtration rate measurements in clinical trials. Modification of Diet in Renal Disease Study Group and the Diabetes Control and Complications Trial Research Group. J Am Soc Nephrol 1993;4(5):1159–1171. [DOI] [PMC free article] [PubMed] [Google Scholar]
- 31.ASTRAL Investigators , Wheatley K, Ives N, et al. Revascularization versus medical therapy for renal-artery stenosis. N Engl J Med 2009;361(20):1953–1962. [DOI] [PubMed] [Google Scholar]
- 32.Eirin A, Zhu XY, Urbieta-Caceres VH, et al. Persistent kidney dysfunction in swine renal artery stenosis correlates with outer cortical microvascular remodeling. Am J Physiol Renal Physiol 2011;300(6):F1394–F1401. [DOI] [PMC free article] [PubMed] [Google Scholar]
- 33.Lemoine S, Papillard M, Belloi A, et al. Renal perfusion: noninvasive measurement with multidetector CT versus fluorescent microspheres in a pig model. Radiology 2011;260(2):414–420. [DOI] [PubMed] [Google Scholar]
- 34.McCollough CH, Chen GH, Kalender W, et al. Achieving routine submillisievert CT scanning: report from the summit on management of radiation dose in CT. Radiology 2012;264(2):567–580. [DOI] [PMC free article] [PubMed] [Google Scholar]


