Abstract
Symmetry is a biologically relevant, mathematically involving, and aesthetically compelling visual phenomenon. Mirror symmetry detection is considered particularly rapid and efficient, based on experiments with random noise. Symmetry detection in natural settings, however, is often accomplished against structured backgrounds. To measure salience of symmetry in diverse contexts, we assembled mirror symmetric patterns from 101 natural textures. Temporal thresholds for detecting the symmetry axis ranged from 28 to 568 ms indicating a wide range of salience (1/Threshold). We built a model for estimating symmetry-energy by connecting pairs of mirror-symmetric filters that simulated cortical receptive fields. The model easily identified the axis of symmetry for all patterns. However, symmetry-energy quantified at this axis correlated weakly with salience. To examine context effects on symmetry detection, we used the same model to estimate approximate symmetry resulting from the underlying texture throughout the image. Magnitudes of approximate symmetry at flanking and orthogonal axes showed strong negative correlations with salience, revealing context interference with symmetry detection. A regression model that included the context-based measures explained the salience results, and revealed why perceptual symmetry can differ from mathematical characterizations. Using natural patterns thus produces new insights into symmetry perception and its possible neural circuits.
Keywords: symmetry perception, computational modeling, texture perception, psychophysics, natural images
Introduction
Symmetry is a visually compelling phenomenon that has been extensively studied and modeled, as summarized in the reviews by Tyler (1996) and Treder (2010), but the neural mechanisms of symmetry perception remain obscure. In mathematics, symmetry is defined as invariance to transformations such as reflection, rotation, and translation (Conway, Burgiel, & Goodman-Strauss, 2008). Symmetry is thus a powerful rule that reduces the information required to describe or retrieve a pattern (Lin, 1996). If the process of shape formation were random, symmetric shapes would be extremely rare. Instead, symmetric shapes abound in nature (Thompson, 1942/1992), and are used frequently for manmade objects (Pizlo, 2010) and ornamentation (Washburn & Crowe, 1988). Symmetry has thus proven to be a useful reductive principle for defining shapes (Blum, 1973; Leyton, 1992; Marr & Nishihara, 1978; Wertheimer, 1958).
Mirror symmetry has been considered the most salient of all symmetries (Mach, 1886/1959). Vertical mirror-symmetric patterns can be detected at the fixation point in around 50 ms (Julesz, 1971). Variations in location or orientation reduce this efficiency, but perception of approximate mirror symmetry near fixation survives the addition of considerable noise (Barlow & Reeves, 1979; Gurnsey, Herbert, & Kenemy, 1998). Such evidence has led to suggestions that recognition of mirror symmetry is pre-attentive (Baylis & Driver, 1994; Julesz, 1971). It is possible that mirror-symmetry perception is privileged as a component of specialized face-neurons (Tsao, Freiwald, Tootell, & Livingstone, 2006) and facial attractiveness judgments (Perrett et al., 1999; Rhodes, Proffitt, Grady, & Sumich, 1998). Moreover, other species also detect and use mirror symmetry (Delius & Nowak, 1982; Giurfa, Eichmann, & Menzel, 1996; Swaddle & Cuthill, 1994; Swaddle & Pruett-Jones, 2001), especially for judging mate attractiveness (Møller & Thornhill, 1998), suggesting that this ability is biologically significant and may have a canonical neural substrate.
There are surprisingly few experimental studies of mirror symmetry detection by human observers using ecologically representative stimuli. The bulk of research has employed randomly generated dot or block patterns. In such impoverished stimuli, images contain only accidental structure except for that produced by the image reflection. Images of natural or manmade surfaces, on the other hand, contain a wealth of patterns generated by the presence of surface markings, textures, objects, terrains, illumination patterns, etc. We tested the hypothesis that the geometric characteristics of the surrounding patterns affect mirror symmetry salience. Using a variety of natural and manmade textures (Brodatz, 1966) we generated mirror-symmetric images that included contour symmetries, in which the outlines of shapes are symmetric (Wilson & Wilkinson, 2002), and pattern symmetries, that have dense symmetric point correspondences (Barlow & Reeves, 1979). We measured temporal thresholds for identifying the symmetry orientation, and quantified salience as the inverse of the threshold.
It is obvious that perceiving symmetry requires comparisons across retinal locations. The nature of the underlying long-range neural interactions has barely been explored (Saarinen & Levi, 2000), but it is clear that such connections occur only after striate cortex. Cells in striate cortex are tuned to spatial frequencies and orientations (Hawken & Parker, 1987; Hubel & Wiesel, 1968), so one class of models attempts to detect symmetry with oriented filters (Osorio, 1996; Poirier & Wilson, 2010). Dakin and Watt (1994) and Dakin and Hess (1997) used outputs of filters oriented orthogonal to the axis of symmetry to locate the axis. As a counterexample, Rainville and Kingdom (2000) showed that symmetry perception in human vision involves detecting oblique mirror orientations with respect to the axis of symmetry. We designed a model to estimate the magnitude of symmetry-energy, using spatial filters consistent with cardinal and obliquely oriented cortical receptive fields. We then tested whether the salience of symmetry across the patterns could be predicted from the magnitude of symmetry-energy, or whether it was necessary to include interference from measures of the surrounding structure. Finally, we used the context-based model to explain why some mathematically symmetric patterns can be judged as symmetric only after extended inspection.
Methods
Stimuli
One hundred and one textures were selected from the Brodatz (1966) set, which consists of photographs of texture patterns under spatially uniform light, and has been widely used and analyzed in computer vision. Mirror symmetries were generated by adding each image matrix to its reflection. This technique generated perfectly mirror symmetric images that exhibited a wide range of natural image characteristics, varying considerably in texture scale, periodicity, randomness, homogeneity and structure. Each texture image was used to generate a class of eight symmetric and 24 nonsymmetric images through the process illustrated in Figure 1: Each image was divided into quadrants. First, each quadrant was reflected about a vertical axis, and then each of the original quadrants was added to each of the reflected quadrants (pixel-by-pixel). Four symmetric images resulted from each quadrant added to its own reflection. Twelve nonsymmetric images resulted from each of the four quadrants added to the reflection of each of the other three quadrants. Then the same process was repeated with reflections about the horizontal axis doubling the number of test images in an image class. Two directions of reflection assured that a dominant orientation within an image class would not provide a reliable cue to the direction of symmetry. Symmetric test images were presented with the axis oriented vertically (randomly 0° or 180°) or horizontally (90° or 270°). Nonsymmetric images were used as masks and were presented at 0°, 90°, 180°, or 270°, determined randomly. Since the nonsymmetric masks were generated through the same procedure as the symmetric stimuli, they have similar spatial-frequency and orientation statistics. Tests and masks were square grayscale images subtending 6.2 degrees of visual angle. Each image was histogram-equalized, and normalized for maximum contrast.
Figure 1.
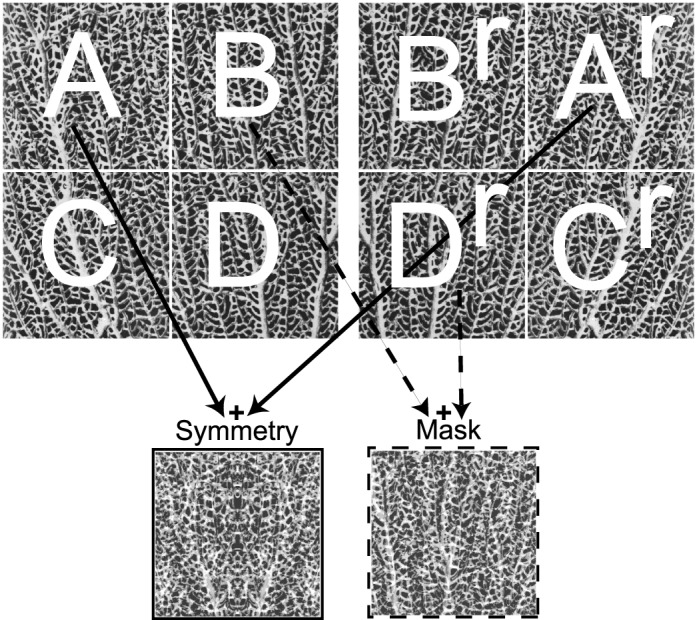
The technique employed for generating tests and masks. Each original image was divided into quadrants. Symmetric test images were produced by adding a quadrant to its reflection (A + Ar). Mask images were produced by adding one quadrant to the reflection of another quadrant (B + Dr). The base texture image was adapted from Brodatz (1966).
Procedure
For each texture class, we measured temporal thresholds for determining symmetry orientation. Images were presented with a vertical or horizontal symmetry axis, and observers identified the orientation by pressing buttons. The orientation task allows subjects to determine the correct answer in a single image without comparison to other images, while the forced choice makes it less susceptible to criterion shifts than judgments of the presence or absence of symmetry. Vertical symmetry detection is generally faster than horizontal detection (Barlow & Reeves, 1979; Mach, 1886/1959), but with equal chance of presentation in either orientation, this inequality should not affect the results.
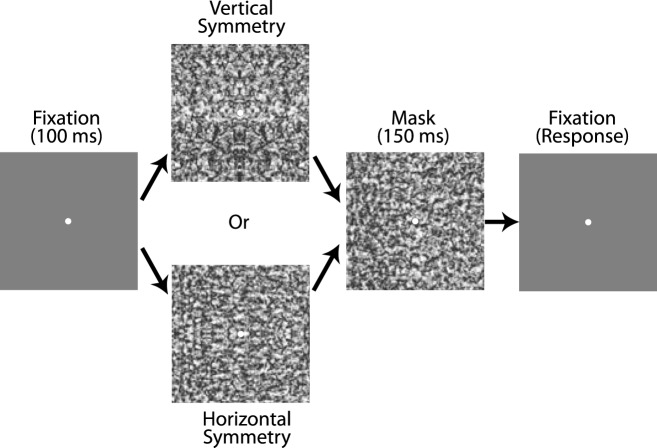
We used double-random staircases that adjusted for stimulus duration (Figure 2). To estimate the threshold corresponding to 79% accuracy, reversals followed three consecutive correct responses or one incorrect response (Wetherill & Levitt, 1965). Starting values for the two independent staircases were 480 ms and 40 ms. Presentation intervals were changed by 120 ms for the first two reversals, and 16 ms for the remaining reversals. Each test presentation was followed by a 150-ms mask. Threshold values were calculated as means of the last eight reversals each of the two staircases. The experiment consisted of about 11,000 trials for the 202 randomly interleaved staircases. After 1 hour of practice, observers participated for six to eight sessions (1 hour each) spread over a few weeks.
Figure 2.
The experiment trial sequence.
Equipment
Stimuli were generated using Matlab, and presented on a Sony GDM-F500 flat screen monitor with 1024 × 768 pixels (Sony, Tokyo, Japan) running at a refresh rate of 120 Hz via a Cambridge Research Systems Visage Visual Stimulus Generator (Cambridge Research Systems, Rochester, Kent, UK). The Visage uses 14-bit digital to analog converters. The output of the screen was linearized using the CRS OptiCal. Head position was stabilized by a chinrest situated 1 m from the stimulus monitor. Stimuli were presented level with the observer's eyes. Viewing was binocular in a dimly lit room, and there was no feedback.
Observers
Author EC and three paid uninformed observers participated in all conditions. Observers (two male, two female) ranged in age from 22 to 31 years. All had normal or corrected-to-normal vision.
Results
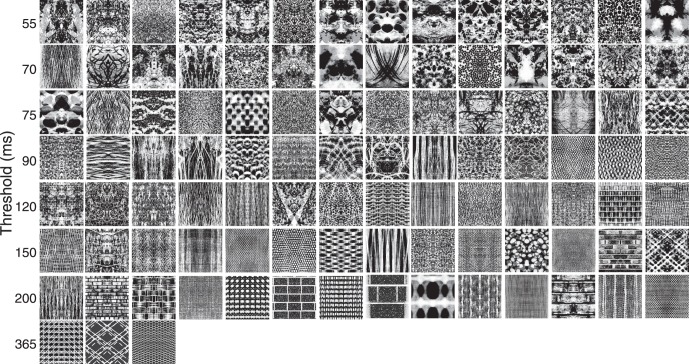
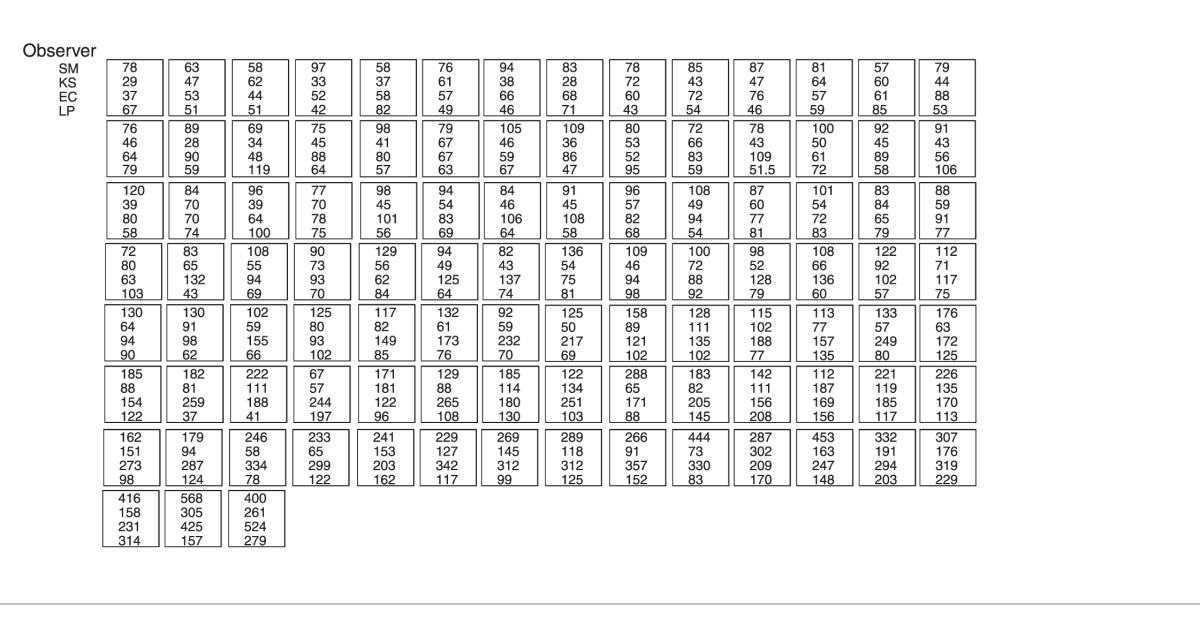
Figure 3 depicts examples of all 101 texture classes, displayed in order of duration thresholds, averaged over the four observers. Individual observer's data are shown in Appendix Table 1. Duration thresholds varied 20-fold from 28 ms to 568 ms, indicating that mirror symmetry detection is not universally rapid. Thresholds ranged roughly over a factor of 10 for each observer, showing a strong dependence on the context provided by the generating texture. There was decent concordance between observers, reflected by a mean correlation of r = 0.68, p < 0.0001, (SE = 0.07). Using the standard definition of Salience as perceptual prominence, or likelihood of being noticed, we assume that the more prominent a feature is, the faster it can be seen, so 1/Temporal-Threshold quantifies Salience, just as 1/Contrast-Threshold quantifies Sensitivity. In order to determine the sources of variation in symmetry salience, we calculated measures of mirror symmetric energy and distracting factors across the complete set of images.
Figure 3.
Instances of each type of symmetric texture class displayed in the order of mean observer duration threshold for that class. In the experiment, each class contained eight distinct symmetric images. Numbers on the Y-axis correspond to mean threshold for the first pattern of each row.
Image analyses
Model
In all the symmetric patterns in Figure 3, every oriented feature on one side of the axis, is accompanied at the same distance on the opposite side by an identical but mirror-reflected feature. We designed a model that uses filters for such mirror-concordances to identify the axis of symmetry and a measure of symmetry-energy1. To simulate oriented, odd-symmetric, cortical filters in a computationally efficient manner, we used steerable pyramids (Simoncelli & Freeman, 1995) at six orientations spaced uniformly around the circle, and four spatial scales beginning from the finest possible at the pixel size and then becoming progressively coarser by an octave in spatial frequency. All 24 pyramid filters were correlated with the image at every pixel. For every pixel, only the orientation and output of the filter with the absolute maximum response at each scale was retained, with its sign intact. This nonlinear operation drastically reduces the amount of computation required for subsequent analyses. For every candidate axis, pixels equidistant to the axis were compared for the orientations of the filters with the maximum response. If the two orientations were related by a mirror reflection, then an AND junction was activated (Figure 4). At each AND junction, if the outputs of the two filters were equal within a small tolerance, their outputs were summed into a symmetry-energy index (To inhibit inaccuracies in image rendering, pixel registration, rounding and other such factors from inactivating the AND operation, the tolerance was set at difference/sum < 0.05. Given the variance of neural responses, this tolerance seems realistic. It made little difference if the tolerance was set at 0.025). We calculated symmetry-energy for vertical and horizontal axes at every pixel within the central half of the image. In the absence of canonical data about how to degrade weights for symmetry-energy with distance from the axis, we used uniform weighting from the axis to one-fourth of the size of the image on both sides.
Figure 4.

Filters at six orientations connected to their mirror symmetric counterparts with AND junctions. The model repeats this in parallel at four scales and at all locations.
Axis selectivity
The axis with the maximum symmetry-energy calculated by the model was taken as the axis of symmetry. The images are on a discrete square grid, and the only possibilities are horizontal or vertical symmetry. This means that given an n × n image, there are 2n possibilities for the axis. The maximum response of our model provided the location of the correct axis for every one of the 101 × 8 = 808 patterns. Our model's search for the symmetry axis also yields measures of symmetry-energy at flanking and orthogonal axes. Therefore to examine the robustness of the axis-selectivity of the model, we calculated two ratios for the 101 generating patterns: symmetry-energy around the primary axis where it was maximum (“Primary Symmetry-Energy”) divided by energy around the orthogonal axis where it was maximum (“Orthogonal Symmetry-Energy”), and energy around the maximum axis divided by energy around the parallel flanking axis with the next largest magnitude of symmetry-energy (“Flanking Symmetry-Energy”). Figure 5 shows that both ratios are substantially over unity for all patterns (mean ratios, 14.2 and 8.4, ranges 4.1–24.70 and 2.7–15.2), demonstrating that the model easily identified the correct axis for patterns differing widely in spatial frequency, randomness and structure. Note that the relationships between salience and the distracting ratios are essentially linear.
Figure 5.
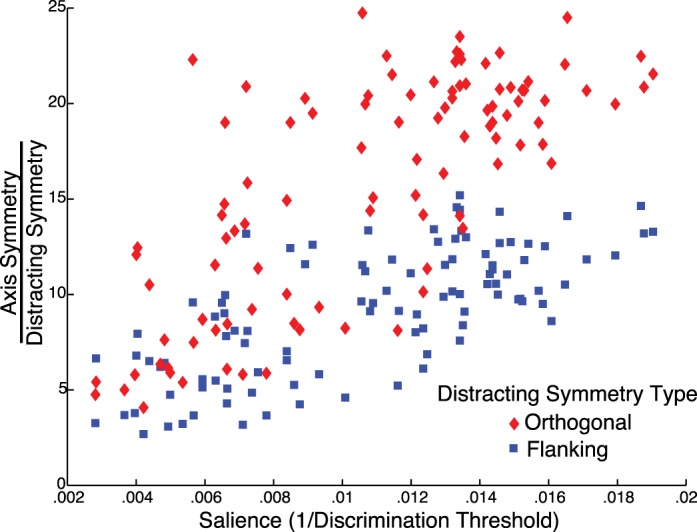
Ratio of symmetry-energy at best axis to best flanking axis (squares), and ratio of symmetry-energy at best axis to best orthogonal axis (diamonds), plotted against salience for all 101 textures.
Symmetry salience
The magnitude of axis symmetry-energy was an excellent predictor of the symmetry axis location. However, over the 101 patterns, axis Primary Symmetry-Energy was only weakly and negatively correlated with symmetry axis Salience (r = −0.38, df = 100, p < 0.01). Thus the simplest explanation of symmetry salience as being proportional to symmetry-energy around the principal axis, can be rejected. Clearly, some other measures are necessary to explain observer performance.
Inspection of Figure 3 shows that many symmetric images that are least salient occur in repetitive texture patterns, while the most salient occur within textures without a repeating structure. The measures of symmetry-energy at flanking and orthogonal axes calculated for the axis location procedure can also be used to quantify approximate symmetry in the generating patterns. We tested whether the presence of approximate symmetry at other axes would reduce the salience of the primary symmetry axis, and thus lead to higher temporal thresholds. For example, approximate symmetry at a flanking axis could cause confusion about the location of the primary axis, and approximate symmetry around an orthogonal axis could cause confusion about the orientation of the primary axis. The ratio of axis symmetry-energy to orthogonal symmetry-energy had a positive correlation of 0.75 (df = 100, p < 0.0001) with salience, and the ratio of axis symmetry-energy to flanking symmetry-energy had a positive correlation of 0.71 (df = 100, p < 0.0001) (Figure 5). These correlation magnitudes clearly show that the distracting effects of flanking and orthogonal approximate symmetries overcome the effects of symmetry-energy at the main axis. The correlations of Salience are higher with the Flanking-Ratio and Orthogonal-Ratio than with the un-normalized maximum flanking and orthogonal symmetry-energies (0.56 and 0.61), possibly because the ratios reflect the weighing of the relative energies in the decision. If the effects of the distracting symmetry energies are partialled out, the correlation between axis symmetry and salience is essentially zero. The partial correlation of Salience with Primary Symmetry-Energy when controlling for Flanking and Orthogonal Symmetry-Energy, is −0.03, implying that salience is essentially a function of the two distractors.
To get a measure of the combined effect of a context-based explanation, we regressed salience on the three measures of symmetry-energy (axis, orthogonal ratio, and flanking ratio). The resultant R2 = 0.63 (df = 97, p < 0.0001) should be compared to the mean between-observer correlation (R2 = 0.46). The coefficient of the Primary Symmetry-Energy in the regression equation was vanishingly small. The combined effect of the two distractors is greater than each individual effect, even though the correlation between the distractors is 0.94. This analysis shows that when the image is also approximately symmetric around other axes, that reduces the salience of the primary axis and observers take longer to discern the correct axis and report its orientation. Salience differences for symmetry across a wide variety of natural patterns can thus be explained by these context effects.
Could the salience differences be explained by a simpler factor such as spatial frequency? Low salience images tended to have more energy at higher frequencies than did high salience images. There was a significant correlation (r = 0.38, p < 0.0001) between duration thresholds and the frequency of maximum energy, but this effect is much weaker than the flanking and orthogonal distracting effects, and adding spatial frequency to the regression did not substantially increase R2.
Discussion
Our symmetry estimation model has only four serial steps, so its operation would be rapid and efficient when implemented in parallel, as would be done in the cortex. Shepherd and Brayton (1987) showed that AND junctions are quite feasible. When excitatory and inhibitory inputs interact in a dendritic tree, the nonlinear threshold needed to generate an action potential would translate these interactions into a binary decision, e.g., an AND gate would result if two excitatory inputs are simultaneously active. Alternately, our AND junction could be implemented by inhibiting a summing neuron with the absolute output of a differencing interneuron. Our filters are local receptive fields, i.e., their parameters are not shared across different locations in the image. After an initial parallel filtering layer we make the information drastically sparser in a pooling layer using a winner-take-all rule, followed by a symmetry selectivity layer, and then another winner-take-all pruning. This relates our work to two recent modeling successes. Multiple alterations between filtering and maximum pooling have successfully modeled object recognition by the brain (DiCarlo, Zoccolan, & Rust, 2012; Serre, Wolf, Bileschi, Riesenhuber, & Poggio, 2007), and unshared receptive field weights coupled with a massively parallel architecture are critical components in unsupervised learning of invariances (Le et al., 2012).
The mathematics of symmetry in planar patterns is straightforward. Only 14 classes of patterns are possible, and all are sufficiently described in Thurston's orbifold notation by five signature features, mirrors, kaleidoscopes, gyrations, miracles, and wonders (Conway et al., 2008). While all of these features can be discerned with active inspection, only some are immediately perceived as symmetric, suggesting a difference between mathematics and perception. Our context-based model provides an explanation of why symmetry is not salient in some cases of perfect mathematical symmetry. For example, a horizontal grating is perfectly mirror-symmetric around some vertical axis, and cognitively observers can be convinced of that, but the symmetry is not salient. As estimated by our model, local symmetry-energy around many vertical axes is equal to that around the primary axis. In this case, the model will not find the correct axis, and it is not salient for human observers either. If, however, the horizontal grating is bent into a “V,” the symmetry is salient for observers, and the model easily identifies the correct axis because symmetry-energy is lower around every other axis. Similarly, the model explains that a perfectly symmetric square-lined pattern is only revealed as symmetric with conscious inspection because a number of vertical and horizontal axes give the same local symmetry-energy as the primary axis. Finally, the model explains that perceived symmetry is artificially robust when generated from random noise, because symmetry-energy is very low around other axes.
Rapid symmetry estimates are important in tasks ranging from judgments of facial attractiveness (Perrett et al., 1999) to inferring the shapes of three-dimensional solids (Pizlo, 2010). By using symmetric patterns generated from natural textures, this study reveals that salience of mirror symmetry varies systematically as a function of specific geometrical properties of the generating pattern. Our computational model demonstrates that pattern and contour mirror symmetry are detectable efficiently by extracting the energy present in mirror orientations. This model presents an elegant neural possibility of how mirror-symmetry could be extracted from retinal images. In addition, it shows that salience is affected more by the distracting effect of the approximate symmetry of the underlying pattern around other axes, than by the magnitude of symmetry-energy around the main axis. The analyses explain why published estimates of high efficiency are accurate only for symmetries generated from random noise, why symmetry is not salient in many natural patterns that consist of repeating regular, or semiregular, elements, and why some mathematically symmetric patterns don't appear symmetric unless actively scanned. Using images of natural structures thus provides new insights into symmetry perception.
Acknowledgments
We thank our observers for careful observations. This work was supported by NEI grants EY07556 and EY13312 to QZ.
Commercial relationships: none.
Corresponding author: Elias H. Cohen.
Email: elias.h.cohen@vanderbilt.edu.
Address: Psychology Department and Vanderbilt Vision Research Center, Vanderbilt University, Nashville, TN, USA.
Appendix Table 1
Table 1.
Duration thresholds (ms) for each of the four observers for each texture class. Each box corresponds to the symmetry class in Figure 3 at the same location.
Footnotes
While the term energy occurs in multiple scientific contexts, our use of the term symmetry-energy should be narrowly understood as a quantification of mirror symmetry.
Contributor Information
Elias H. Cohen, Email: elias.h.cohen@vanderbilt.edu.
Qasim Zaidi, Email: qz@sunyopt.edu.
References
- Barlow H. B., Reeves B. C. (1979). The versatility and absolute efficiency of detecting mirror symmetry in random dot displays. Vision Research , 19, 783–793. [DOI] [PubMed] [Google Scholar]
- Baylis G. C., Driver J. (1994). Parallel computation of symmetry but not repetition within single visual shapes. Visual Cognition , 1, 377–400. [Google Scholar]
- Blum H. (1973). Biological shape and visual science (Part I). Journal of Theoretical Biology , 38, 205–287. [DOI] [PubMed] [Google Scholar]
- Brodatz P. (1966). Textures: A photographic album for artists and designers. Mineola, NY: Dover Publications. [Google Scholar]
- Conway J. H., Burgiel H., Goodman-Strauss C. (2008). The symmetries of things. Wellesley, MA: A. K. Peters. [Google Scholar]
- Dakin S. C., Hess R. F. (1997). The spatial mechanisms mediating symmetry perception. Vision Research , 37, 2915–2930. [DOI] [PubMed] [Google Scholar]
- Dakin S. C., Watt R. J. (1994). Detection of bilateral symmetry using spatial filters. Spatial Vision , 8, 393–413. [DOI] [PubMed] [Google Scholar]
- Delius J. D., Nowak B. (1982). Visual symmetry recognition by pigeons. Psychological Research , 44, 199–212. [DOI] [PubMed] [Google Scholar]
- DiCarlo J. J., Zoccolan D., Rust N. C. (2012). How does the brain solve visual object recognition? Neuron , 73, 415–434. [DOI] [PMC free article] [PubMed] [Google Scholar]
- Giurfa M., Eichmann B., Menzel R. (1996). Symmetry perception in an insect. Nature , 382, 458–461. [DOI] [PubMed] [Google Scholar]
- Gurnsey R., Herbert A., Kenemy J. (1998). Bilateral symmetry embedded in noise is detected accurately only at fixation. Vision Research , 38, 3795–3803. [DOI] [PubMed] [Google Scholar]
- Hawken M. J., Parker A. J. (1987). Spatial properties of neurons in the monkey striate cortex. Proceedings of the Royal Society of London, Series B , 231 (1263), 251–288. [DOI] [PubMed] [Google Scholar]
- Hubel D. H., Wiesel T. N. (1968). Receptive fields and functional architecture of monkey striate cortex. The Journal of Physiology , 195, 215–243. [DOI] [PMC free article] [PubMed] [Google Scholar]
- Julesz B. (1971). Foundations of cyclopean perception. Chicago: University of Chicago Press. [Google Scholar]
- Le Q. V., Ranzato M. A., Monga R., Devin M., Chen K., Corrado G. S., et al. (2012, July). Building high-level features using large scale unsupervised learning. In Langford J., Pineau J. (Eds.), Proceedings of the 29th International Conference on Machine Learning, Edinburgh, Scotland, pp. 81–88. New York: Omnipress. [Google Scholar]
- Leyton M. (1992). Symmetry, causality, mind. Cambridge, MA: MIT Press. [Google Scholar]
- Lin S.-K. (1996). Correlation of entropy with similarity and symmetry. Journal of Chemical Information and Computer Sciences , 36, 367–376. [Google Scholar]
- Mach E. (1959). The analysis of sensations. Mineola, NY: Dover; Publications. (Original work published 1886). [Google Scholar]
- Marr D., Nishihara H. K. (1978). Representation and recognition of three-dimensional shapes. Proceedings of the Royal Society of London, Series B , 200, 269–294. [DOI] [PubMed] [Google Scholar]
- Møller A. P., Thornhill R. (1998). Bilateral symmetry and sexual selection: A meta-analysis. The American Naturalist , 151, 174–192. [DOI] [PubMed] [Google Scholar]
- Osorio D. (1996). Symmetry detection by categorization of spatial phase, a model. Proceedings of the Royal Society of London. Series B: Biological Sciences , 263(1366), 105–110. [Google Scholar]
- Perrett D. I., Burt D. M., Penton-Voak I. S., Lee K. J., Rowland D. A., Edwards R. (1999). Symmetry and human facial attractiveness. Evolution and Human Behavior , 20 (5), 295–307. [Google Scholar]
- Pizlo Z. (2010). 3D shape: Its unique place in visual perception. Cambridge, MA: MIT Press. [Google Scholar]
- Poirier F. J., Wilson H. R. (2010). A biologically plausible model of human shape symmetry perception. Journal of Vision , 10 (1): 22 1–16, http://www.journalofvision.org/content/10/1/9, doi:10.1167/10.1.9 [PubMed] [Article] [DOI] [PubMed] [Google Scholar]
- Rainville S. J. M., Kingdom F. A. A. (2000). The functional role of oriented spatial filters in the perception of mirror symmetry—Psychophysics and modeling. Vision Research , 40, 2621–2644. [DOI] [PubMed] [Google Scholar]
- Rhodes G., Proffitt F., Grady J. M., Sumich A. (1998). Facial symmetry and the perception of beauty. Psychonomic Bulletin and Review , 5 (4), 659–669. [Google Scholar]
- Saarinen J., Levi D. M. (2000). Perception of mirror symmetry reveals long-range interactions between orientation-selective cortical filters. NeuroReport , 11 (10), 2133–2138. [DOI] [PubMed] [Google Scholar]
- Serre T., Wolf L., Bileschi S., Riesenhuber M., Poggio T. (2007). Robust object recognition with cortex-like mechanisms. IEEE Transactions on Pattern Analysis and Machine Intelligence , 29 (3), 411–426. [DOI] [PubMed] [Google Scholar]
- Shepherd G. M., Brayton R. K. (1987). Logic operations are properties of computer-simulated interactions between excitable dendritic spines. Neuroscience , 21, 151–165. [DOI] [PubMed] [Google Scholar]
- Simoncelli E. P., Freeman W. T. (1995). The steerable pyramid: A flexible architecture for multi-scale derivative computation. IEEE Second International Conference on Image Processing. Washington, DC. [Google Scholar]
- Swaddle J. P., Cuthill I. C. (1994). Female zebra finches prefer males with symmetrical chest plumage. Proceedings of the Royal Society of London, Series B , 258, 267–271. [Google Scholar]
- Swaddle J. P., Pruett-Jones S. (2001). Starlings can categorize symmetry differences in dot displays. The American Naturalist , 158 (3), 300–307. [DOI] [PubMed] [Google Scholar]
- Thompson D. W. (1992). On growth and form. Mineola, NY: Dover; Publications. (Dover reprint of 1942 2nd ed. 1st ed., 1917). [Google Scholar]
- Treder M. S. (2010). Behind the looking-glass: A review on human symmetry perception. Symmetry , 2, 1510–1543. [Google Scholar]
- Tsao D. Y., Freiwald W. A., Tootell R. B., Livingstone M. S. (2006). A cortical region consisting entirely of face-selective cells. Science , 311, 670–674. [DOI] [PMC free article] [PubMed] [Google Scholar]
- Tyler C. W. (1996). Human symmetry perception and its computational analysis. Utrecht, The Netherlands: VSP. [Google Scholar]
- Washburn D. K., Crowe D. W. (1958). Symmetries of culture. Seattle, WA: University of Washington Press. [Google Scholar]
- Wertheimer M. (1958). Principles of perceptual organization. In Beardslee D. C., Wertheimer M. (Eds.), Readings in perception. (pp 115–135). Princeton, NJ: Van Nostrand. [Google Scholar]
- Wetherill G. B., Levitt H. (1965). Sequential estimation of points on a psychometric function. British Journal of Mathematical and Statistical Psychology , 18 (1), 1–10. [DOI] [PubMed] [Google Scholar]
- Wilson H. R., Wilkinson F. (2002). Symmetry perception: A novel approach for biological shapes. Vision Research , 42, 589–597. [DOI] [PubMed] [Google Scholar]


