Abstract
Adaptation to a blurred image causes a physically focused image to appear too sharp, and shifts the point of subjective focus toward the adapting blur, consistent with a renormalization of perceived focus. We examined whether and how this adaptation normalizes to differences in blur between the two eyes, which can routinely arise from differences in refractive errors. Observers adapted to images filtered to simulate optical defocus or different axes of astigmatism, as well as to images that were isotropically blurred or sharpened by varying the slope of the amplitude spectrum. Adaptation to the different types of blur produced strong aftereffects that showed strong transfer across the eyes, as assessed both in a monocular adaptation task and in a contingent adaptation task in which the two eyes were simultaneously exposed to different blur levels. Selectivity for the adapting eye was thus generally weak. When one eye was exposed to a sharper image than the other, the aftereffects also tended to be dominated by the sharper image. Our results suggest that while short-term adaptation can rapidly recalibrate the perception of blur, it cannot do so independently for the two eyes, and that the binocular adaptation of blur is biased by the sharper of the two eyes' retinal images.
Keywords: interocular transfer, adaptation, blur
Introduction
The retinal image formed by the eye's optics is inherently blurred, yet observers nonetheless tend to perceive the world as “correctly” focused. This percept is likely to occur in part because neural mechanisms in the visual pathway adapt—or adjust their sensitivity—in order to compensate spatial coding for the blur (Webster, 2011). Adaptation is demonstrated by the finding that a focused image looks too sharp after viewing a blurred image or vice versa (Elliott, Georgeson, & Webster, 2011; Vera-Diaz, Woods, & Peli, 2010; Webster, Georgeson, & Webster, 2002). Adjustments to blur have also been shown by improvements in visual acuity when observers are exposed to increased levels of blur induced by wearing defocusing or astigmatic lenses (George & Rosenfield, 2004; Mon-Williams, Tresilian, Strang, Kochhar, & Wann, 1998; Pesudovs & Brennan, 1993; Rajeev & Metha, 2010; Rosenfield & Gilmartin, 1999). These perceptual and performance changes may be driven by a variety of processes with different time courses, but together suggest that neural mechanisms mediating spatial vision are continuously regulated by the level of image blur. Specifically, adaptation might adjust spatial sensitivity in order to normalize and maintain the perception of image focus in spite of the ambient blur in the retinal image (Elliott et al., 2011).
Recently a number of studies have found that adaptation can selectively adjust to the actual patterns of blur introduced by an individual's optical aberrations. For example, blur perception shows selective aftereffects for different axes of astigmatism (Sawides et al., 2010; Yehezkel, Sagi, Sterkin, Belkin, & Polat, 2010). Moreover, when asked to judge subjective image quality or perceived focus, observers choose images blurred in the same way or at the same level as occur for their natural high-order aberrations (Artal et al., 2004; Sawides, de Gracia, Dorronsoro, Webster, & Marcos, 2011a; Sawides, de Gracia, Dorronsoro, Webster, & Marcos, 2011b), though with high order aberrations, perceived image quality depends more strongly on the magnitude than the pattern of the blur (Sawides et al., 2012) . These judgments are unlikely to simply reflect a learned criterion for image focus (i.e., so that what is rated as best focused or best quality is simply what the observer is used to seeing). Such criterion effects would predict that observers would show the same adaptation effects regardless of how they rated the images (e.g., both would show the same blur aftereffect to a stimulus whether they labeled that stimulus as blurred or sharp). Instead, the aftereffects are relative to each individual's native blur level, so that when adapted to another person's aberrations, stimuli appear sharper to an observer with weaker aberrations while blurrier to an observer with stronger aberrations (Sawides et al., 2011a; Sawides et al., 2011b). Such results suggest that spatial sensitivity in each observer might be adapted to the specific magnitude, and to a lesser extent to the specific pattern, of their own optical errors. And again, this may play an important role in compensating spatial vision so that the perception of focus is tied more directly to the characteristics of the physical world than to its image on the retina.
In the present study we examined how the visual system adapts to blur when the optical errors and thus the level or pattern of blur differs between the eyes. The spatial-frequency dependence and orientation selectivity of blur aftereffects implicate a cortical site of the adaptation (Blakemore & Campbell, 1969), at a level where inputs from the two eyes first converge. If these adjustments can only occur after signals from the eyes are combined, then they would not be able to normalize for differences in the amount or form of blur in the two eyes. Although aberrations, and specifically defocus and astigmatism, are correlated across the eyes (Almeder, Peck, & Howland, 1990; Lombardo, Lombardo, & Serrao, 2006; Porter, Guirao, Cox, & Williams, 2001; Statterfield, 1989), they can be asymmetric between the eyes (Howland & Howland, 1977; Marcos & Burns, 2000). For example, in many cases the axes of astigmatism in the left and right eyes do not clearly follow either mirror or direct symmetry (McKendrick & Brennan, 1997). Moreover, interocular differences in refractive errors, or anisometropia, occur for a significant proportion of the population (e.g., 2.3%, Blum, Peters, & Bettman, 1959; 3.4%, Flom &Bedell, 1985), and the prevalence tends to increase with age (Qin, Margrain, To, Bromham, & Guggenheim, 2005). When the interocular differences are large they are a likely causal factor in amblyopia (Donahue, 2005). Further, interocular differences in refraction are intentionally incorporated in some corrections, such as the “monovision” correction for presbyopia in which one eye is corrected for far and the other for near (Jain, Arora, & Azar, 1996).
Covering one eye and exposing the other to a defocused image revealed that some interocular transfer of blur adaptation does occur, so that the adjustments to a blurred image in one eye may affect the acuity as measured through the other eye (Mon-Williams et al., 1998). However, little is known about interocular transfer of blur adaptation on judgments of perceived focus, or under more natural contexts when both eyes are viewing stimuli. In this study, our aim was to explore how individuals adapt to interocular differences in blur, to answer 1) whether adaptation of perceived focus can independently compensate for the blur in each eye; and 2) whether the adaptation that occurs at a binocular level adjusts to the average blur from the two eyes or whether the sharper or blurrier component dominates. Answers to these questions are relevant for understanding the processes of adaptation to blur, and also have important clinical relevance for understanding how the visual system adapts to optimize coding for the weaker versus stronger eye.
Methods
Observers
Seven observers with functional stereopsis and corrected-to-normal acuity participated in different subsets of experiments. The observers included authors EK and MW and five students who were naïve to the purpose of the experiments. Participation was with informed consent and followed protocols approved by the university's Institutional Review Board.
Apparatus and stimuli
Stimuli were presented on a calibrated and gamma-corrected Sony 500 PS monitor controlled by a Cambridge Research Systems VSG graphics card (Cambridge Research System, Rochester, UK), with the images viewed dichoptically through a custom-built mirror stereoscope. Separate left and right images were shown in a fused 4° field. Black borders were added to each field and shown throughout the experiment to facilitate eye alignment, and head alignment was maintained with a chin and forehead rest. The images were displayed on a gray background on the monitor with the same chromaticity and mean luminance (∼37 cd/m2).
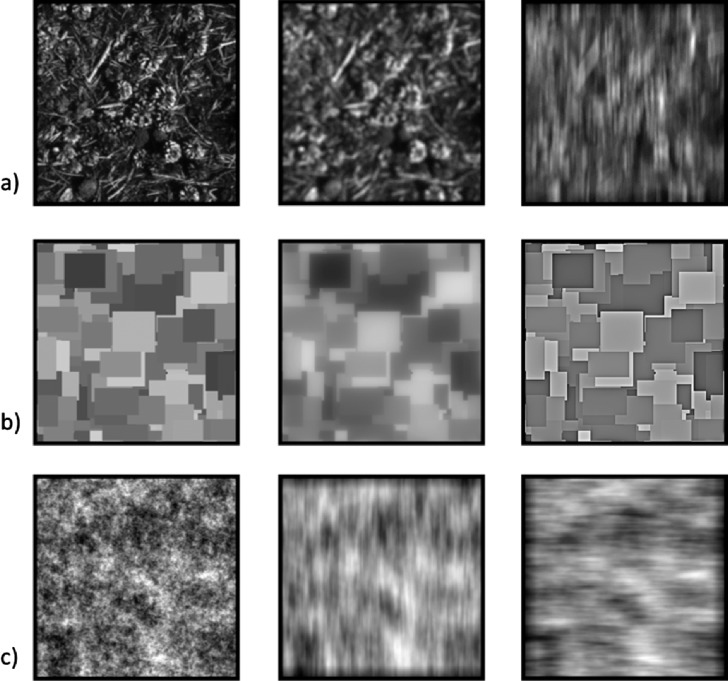
All images were 8-bit grayscale with a size of 256 × 256 pixels, and included four examples of natural textures (e.g., foliage), “Mondrian” patterns (random overlapping rectangles) or filtered noise. The natural textures were used to assess the adaptation effects for both defocus and astigmatism. Additional defocus settings were also collected for the Mondrians. The strong edges in these stimuli facilitated judging isotropic blur but provided poor sensitivity to oriented blur. Conversely, for the astigmatic blur we also tested with the noise images. These are relatively difficult for judging defocus but provide a sensitive stimulus for detecting changes in the orientation of the blur (Sawides et al., 2010).
For each image, we varied the level of blur in finely graded steps to produce an array of images that served as both the adapting and test stimuli. To simulate the effects of optical blur, the images were filtered using custom algorithms based on convolving the images with point spread functions corresponding to a wave aberration with all Zernike terms set to zero except for defocus ( ) (which varied from 0 to 0.6 μm); or by adding different levels of the astigmatism term ( ) (from −0.6 to +0.6 μm) but with defocus also varying to maintain a constant level of total blur (from 0.374 to 0.566 μm). Details of these procedures are given in Sawides et al. (2010). For the Mondrian images, we also examined adaptation to variations in the slope of the amplitude spectra, similar to the stimuli used by Webster et al. (2002). These images do not correspond to optical blur but have the advantage that the stimuli can range from too blurred to too sharp, and thus allowed images to be varied in either direction from the norm for blur at neural levels (Elliott et al., 2011). The images were created by multiplying the original amplitude at each frequency (f) by fα, with α varied from −0.5 to +0.5, and with contrast adjusted to maintain the same root-mean-square (RMS) contrast as the original (Figure 1).
Figure 1.
Examples of the adapting and test images. a) Focused grayscale natural texture images (left) were filtered using custom algorithms to simulate different levels of defocus with no astigmatism (0–0.6 μm) (middle), or different levels of negative (vertical) or positive (horizontal) astigmatism, with defocus added to maintain constant total blur (right). b) Mondrian patterns (left) were filtered by varying the slope of the amplitude spectra to either blur (middle) or sharpen (right) the image. c) Images of 1/f noise (left) were filtered to simulate blur from negative (vertical) or positive (horizontal) astigmatism with defocus added to maintain constant total blur.
Procedure
Observers initially adapted for 120 s to a blurred or sharpened image presented to one eye or to images with different blur in each eye. Baseline measurements were also taken following adaptation to a uniform field. The adapting stimuli filled the 4° displayed window (228 × 228 pixels), but their position within it was randomly jittered every 100 ms over a range of ±16 pixels to avoid local light adaptation. This local jitter does not preclude retinal afterimages at coarse spatial scales, though these were not visible with our stimuli and in any case cannot account for the changes in perceived focus, since the blur aftereffects show strong transfer across images (Elliott et al., 2011; Webster et al., 2002). Following adaptation, a test image drawn from the same original image but with a random level of blur was presented to the adapted eye or to the unadapted eye for 250 ms, preceded by a 100-ms gray field. The participants made a two-alternative response to estimate whether the image appeared “in focus” or “blurred” (defocus), “vertically blurred,” or “horizontally blurred” (astigmatism), or “too blurred” or “too sharp” (slope changes). The different experiments thus were similar in that each measured subjective judgments about the blur, but differed in the specific judgment, for example because the defocus settings measured the minimum noticeable blur while the astigmatism instead tested when the stimulus appeared “neutral.” Subsequent test stimuli were shown interleaved with 4-s periods of re-adaptation. For all conditions the blur level in the test was varied in a staircase (one-up, one-down), with the subjective focus or isotropic point estimated from the mean of the last 8 of 11 reversals. During each run two randomly interleaved staircases were used to measure the settings for test stimuli presented to the left or right eye. Reported results are based on the mean of four repeated measurements for each adapt and test condition, with the adapt eye and blur level counterbalanced across the sessions.
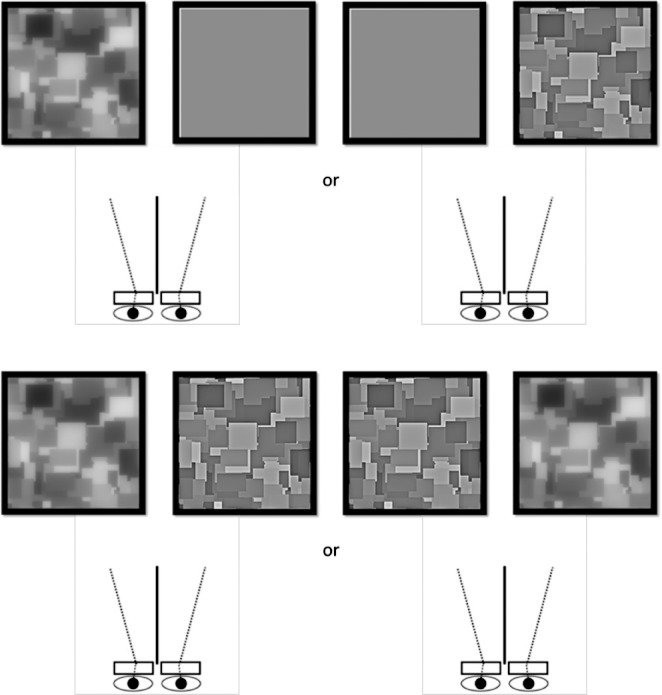
For both types of blur we assessed the effects of interocular differences in adaptation using two procedures (Figure 2):
Figure 2.
Schematic of the two experimental conditions. Top: in monocular adaptation the adapting image was shown to one eye while test images were presented to either eye. Bottom: in contingent adaptation the two eyes were shown different levels or axes of blur during adaptation, and test images were again presented to either eye.
Monocular adaptation
In the first case, an adapting image was presented to either the left or the right eye and the fellow eye was shown a uniform field. This condition was used to examine the degree of interocular transfer by comparing the strength of adaptation when the test was presented to the same eye or a different eye from the adapt. Differences between the eyes were statistically evaluated with two-way ANOVAs (blur level by same/different test eye), in order to test whether the aftereffects showed an interaction between the adapt and test eyes. Where individual results are shown the ANOVAs were conducted separately for each observer based on their four repeated settings per condition, while the mean results were instead based on the average settings across the observers. We also assessed the degree of interocular transfer (IOT) by expressing the strength of the between-eye aftereffects as a percentage of the same-eye aftereffect (Baker & Meese, 2012). For defocus this corresponded to
 |
where Fs and Bs correspond to the perceived focus settings after adapting to a focused or blurred image in the same eye, and Fd and Bd were the settings when the adapt and test images were instead presented to different eyes. (Note these differences are based on the average of the effects when the “same” eye corresponded to the left or right eye.) The expected value thus varies between 0 (representing no interocular transfer and thus complete selectivity) and 100 (complete transfer and thus no selectivity). Analogous indices were computed for the two adapting axes of astigmatism or for the sharpened or blurred slopes.
Contingent adaptation
In the second case, each eye was shown a single adapting image with a different level of blur in each eye. It is likely that stronger eye-specific aftereffects would occur if images drawn from different exemplars were presented to the two eyes, because this would reduce binocular correlations (e.g., May, Zhaoping, & Hibbard, 2012). However, in the present study we were specifically interested in probing conditions in which the two eyes are viewing the same scene (but with different blur levels), since this would be the stimulus under routine viewing conditions. We also used this procedure to test whether the overall aftereffect was consistent with the average blur the observer was exposed to or dominated by the blur level specific to one of the images, and specifically to the more focused or blurred of the two images. Contingent aftereffects were again assessed with a two-way ANOVA (adapting pair by test eye), and the degree of transfer was indexed by:
 |
Again in the case of defocus, this defined IOT as the difference in the settings (averaged across the two eyes) when each eye was adapted to a focused (F) or blurred (B) image during contingent adaptation (c), relative to the average aftereffect when each eye was instead tested after monocular adaptation in the same eye (s), as measured in the preceding case. Thus this metric measured whether or not the aftereffect magnitude through each eye changed when different adapting stimuli were presented to the fellow eye. The resulting index should thus again vary between 0 (aftereffects within each eye under contingent adaptation equal to the same-eye monocular aftereffects and thus no transfer) and 100 (no difference between the eyes under contingent adaptation and thus complete transfer). Note that for both the monocular and contingent adaptation we follow convention in using the term “transfer” to refer to the observed pattern of interactions in the aftereffects, and not to imply anything about the mechanism of those interactions.
Results
Isotropic blur
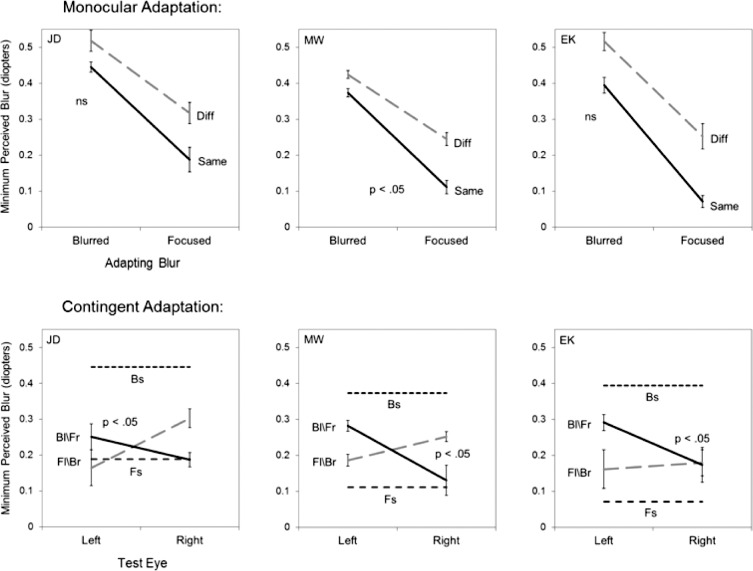
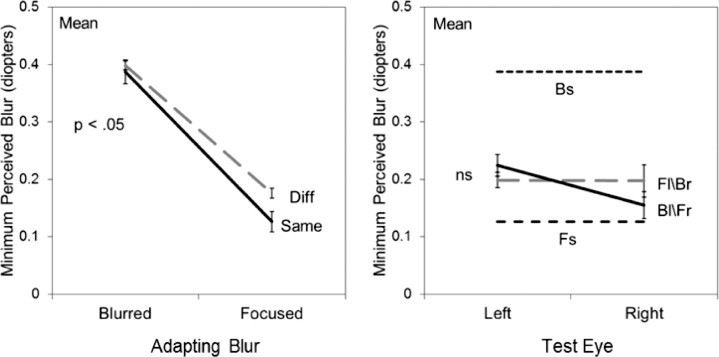
Figure 3 illustrates the aftereffects for three individual observers after adapting to the natural textures shown either in focus or with 0.5 diopters of simulated defocus. The top panels represent the monocular conditions in which the adapt image was shown to one eye while the test images were presented to either the same (solid line) or different eye (dashed line). Consistent with previous findings, adapting to the blurred image caused the test images to appear less blurred, and thus the physical blur levels at which the images first appear blurred are shifted toward the blurred adapt level. The present findings reveal that these blur aftereffects show strong transfer across the eyes. For two of the three observers (JD, EK) the strength of the aftereffect did not differ for the same or different eye, while for the third (MW) there is a weak but significant reduction in the other-eye aftereffect (i.e., the slopes of the two lines significantly differ). Notably, all three observers showed a consistent trend for greater blur tolerance in the nonadapted eye (i.e., the range of stimuli perceived as in focus is shifted toward greater levels of physical blur). This could reflect a difference in the perceived contrast of the images in the adapted (lower) and nonadapted eye (higher), such that lower contrast images were more likely to appear blurred, though in simple edges low contrasts instead appear sharper (May & Georgeson, 2007). Moreover, a similar difference was not found when the aftereffects were instead assessed with the Mondrian images (see Figure 7 below).
Figure 3.
Adaptation to simulated defocus. The three upper panels show the defocus levels at which the images first appeared blurred for three observers after adapting to a defocused (0.5 D) natural texture in one eye, and then testing with the same eye (Same, solid lines) or fellow eye (Different, dashed lines). Points plot the mean and standard error of the settings. P values give the significance level for the adapt condition X test eye interaction (NS: not significant). Lower panels instead show the settings for contingent adaptation to a focused image in the left eye and defocused in the right (Fl/Br, dashed line) or vice versa (Bl/Fr, solid lines), along with the aftereffects predicted by monocular adaptation to a focused (Fs) or blurred (Bs) image (horizontal dashed lines).
Figure 7.
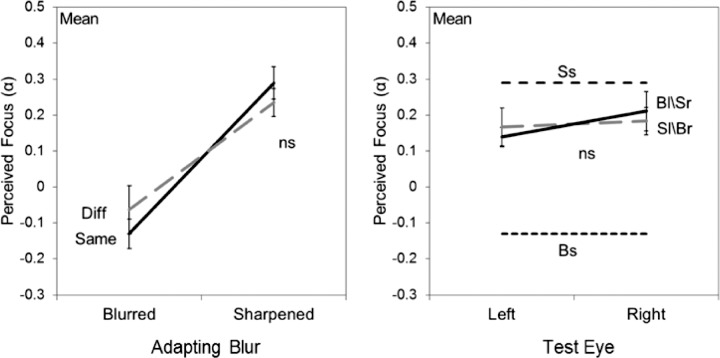
Average aftereffects for five observers following adaptation to Mondrian images sharpened or blurred by changing the slope of the amplitude spectra. Left panel: monocular adaptation; right panel: contingent adaptation. Symbols as in Figure 3. P values indicate whether aftereffects were selective for the adapting eye.
The lower panels of Figure 3 plot the results when the same observers were instead adapted to a focused image in one eye and an image simulating 0.5 diopters defocus in the fellow eye. In these graphs, the symbols with error bars connected by dotted gray lines represent the settings when the left eye was adapted to a focused image and the right eye was adapted to a blurred image. The solid black line shows the settings for the converse condition of blur in the left eye and focused in the right. Again this opposing-adaptation condition was designed to mimic the natural viewing conditions that would arise from interocular differences in defocus, and also provides a more sensitive test of the eye-selectivity of the aftereffects, because any adaptation common to both eyes should cancel. In this case some selectivity was revealed for all three observers (as confirmed by a significant eye by contingency interaction), though the strength of the aftereffects remains substantially weaker than for the monocular same-eye effects (shown by the horizontal dashed lines in the panels).
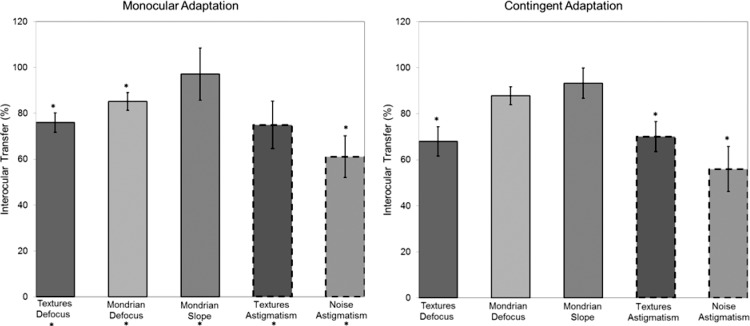
As noted, we quantified the degree of interocular transfer by using a standard index of the relative strength of the aftereffects when the adaption and test occurred in the same versus when adaptation and test occurred in different eyes. The average values for the observers are shown in Figure 4 for both the monocular and contingent conditions for each condition tested. The leftmost bar in the panels corresponds to the average IOT estimated from the adaptation to defocus in the natural images for the monocular condition in the observers in Figure 3, while the remaining bars correspond to the average IOT for different image sets or blur conditions. Across these the IOT values range from ∼60% to 90% implying strong transfer across the eyes. The estimates of transfer are similar for the two adapting paradigms (monocular adaptation or contingent adaption), with a correlation of r = 0.59 between the IOT values for monocular and contingent adaptation across all conditions. For the monocular condition we evaluated the degree of transfer in two ways. First, as before, we examined whether there was any interocular selectivity, by testing whether the different-eye aftereffects were weaker than the same-eye monocular effects. Significant effects, implying at least weak transfer, are indicated by the asterisks above the bars. Second, we also tested whether the aftereffects for the two blur levels were significantly different when the adapt and test eye were different. This revealed that all conditions showed significant aftereffects through the nonadapted eye, and thus a significant degree of transfer.
Figure 4.
Left panel: degree of interocular transfer of the aftereffects estimated from the monocular same versus different eye adaptation. Each bar represents the mean value (averaged across observers) of the index of transfer ±1 SEM for a given image set or blur condition. Asterisks above the bars indicate aftereffects that showed at least some selectivity for the stimulated eye (i.e., significantly smaller aftereffects when the adapt and test eye were different). Asterisks below the bars instead correspond to aftereffects that showed significant interocular transfer (i.e., significant aftereffects in the nonadapted eye). Right panel: degree of transfer estimated from the contingent blur adaptation. Each bar again represents the average value of the index ±1 SEM for a given image set or blur condition. Asterisks above the bars indicate aftereffects that were at least partly selective for the stimulated eye (i.e., significant differences between the aftereffects under contingent versus monocular same-eye adaptation).
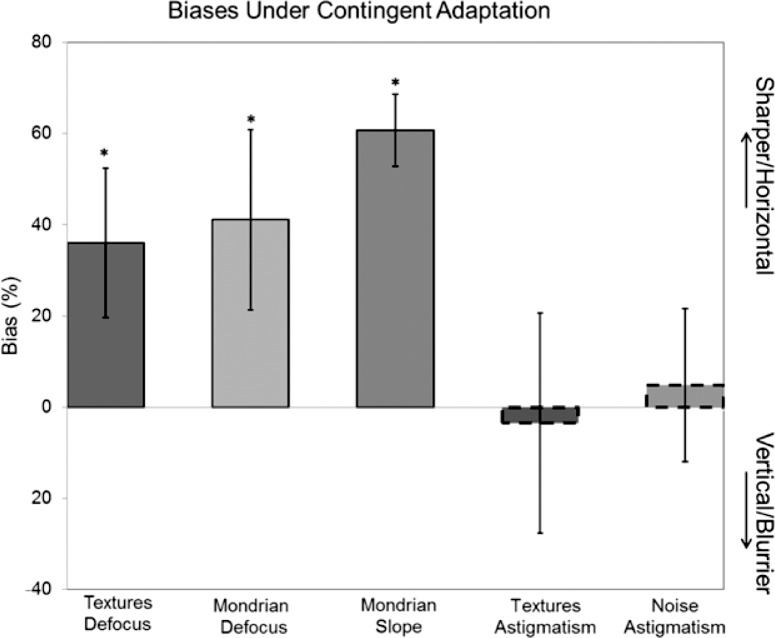
In Figure 3, the settings for perceived focus under contingent adaptation are not midway between the aftereffects predicted by the focused or blurred monocular adaptation, but instead appear shifted toward the settings for the focused predictions. This bias is most apparent in the results for observer JD, whose settings when one eye was adapted to focus and the other to blur, remained close to the levels predicted by focused adapt alone. However, smaller biases occur for the other observers, and suggest that the aftereffects are dominated by the sharper image. To characterize this, for each observer we averaged their four settings made under contingent adaptation, and compared this to the average of the focused and blurred monocular settings. The average contingent aftereffect was expressed as the percent change in the range between the two monocular aftereffects. A value of zero meant the mean contingent aftereffect equaled the mean of the monocular settings, while positive or negative values corresponded to a shift in the contingent aftereffects toward the settings for the monocular focused or blurred adaptor respectively. Significant shifts in the average bias across observers were evaluated with paired t-tests comparing the differences between the distances of the settings relative to the focused or blurred monocular settings. The results are shown in Figure 5, which again plots the average bias for the three observers in Figure 3 (defocus in natural textures) by the left-most bar. Again, this shows that when adapted to different levels of defocus in the two eyes, there was a bias in the direction of the focused adaptor.
Figure 5.
Biases in the contingent aftereffects. Each bar shows the average settings ±1 SEM for the contingent adaptation, relative to the average predicted by the two monocular aftereffects. The different bars correspond to the different image sets or blur conditions. Positive biases correspond to aftereffects shifted toward the sharper image or horizontal astigmatism, while negative biases represent shifts toward the blurrier image or vertical astigmatism. Asterisks indicate biases that were significantly different from the predicted average.
We next repeated the measurements of adaptation to defocus in a different set of images corresponding to the Mondrian patterns. These images contained well defined edges which again support good sensitivity to defocus, though they lack textural cues to blur (Field & Brady, 1997). The average aftereffects for these images are plotted in Figure 6, again for the monocular or contingent adapting conditions. For these stimuli, the degree of IOT tended to increase so that there was even less selectivity for the adapting eye. For monocular adapting conditions, the average aftereffect for the four observers tested showed a weak but significant reduction in the nonadapted eye, yet this difference was not significant for any of the individual observers. Moreover, none of the contingent aftereffects reached significance, either for the individual settings or the average. Finally, as Figures 5 and 6 illustrate, there was again a strong bias in the average settings under contingent adaptation toward the more focused adaptor. Thus these results reinforced the pattern of results with the natural images in suggesting that selectivity for interocular differences in defocus are weak, and that the adaptation to blur is dominated by the sharper retinal image.
Figure 6.
Mean aftereffects for four observers following adaptation to defocus in the Mondrian images. Left panel: monocular adaptation; right panel: contingent adaptation. Symbols as in Figure 3. P values indicate whether aftereffects were selective for the adapting eye.
As noted, we also extended the measurements to examine a different form of isotropic blur corresponding to changes in the slope of the log amplitude spectrum. This allowed us to probe the pattern of eye interactions in stimuli that were not only blurred but also oversharpened relative to the focus point. Observers adapted to the Mondrian patterns with the slopes adjusted to +0.5 (sharpened) or −0.5 (blurred), and then made settings to estimate the slope that appeared neither “too sharp” nor “too blurred.” Adapting to a blurred or sharpened image caused the original focused image to appear too sharp or blurred respectively (Webster et al., 2002). To null these aftereffects, the slopes of the test stimuli had to be shifted toward the adapt stimuli in order for the stimuli to appear correctly focused. The mean settings for these conditions are shown in Figure 7. As with the images adjusted for optical defocus, there is again strong interocular transfer of the adaptation and a strong dominance of the sharper image when the amplitude spectra differed between the two eyes (Figures 4 and 5).
Astigmatic blur
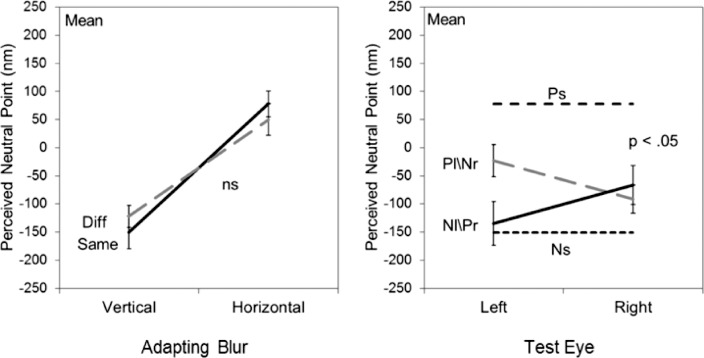
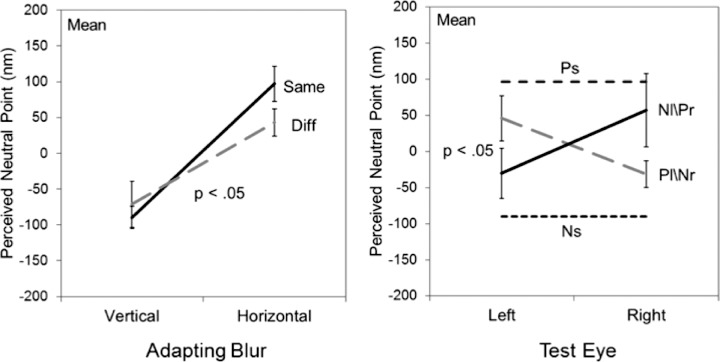
Figures 8 and 9 show the corresponding results when observers were instead adapted to different axes of astigmatic blur. For these images the total image blur remained constant, but varied between the two adapting levels of +0.6 μm (horizontal) and −0.6 μm (vertical) astigmatism. Observers responded whether blur in the test images appeared “vertical” or “horizontal” to estimate the point at which the blur appeared isotropic. Average results for the natural images are presented in Figure 8, and show a level of IOT comparable to the level obtained when observers were instead adapted to pure defocus in the same images. We also attempted to measure the adaptation to astigmatism in the Mondrians. However the strong vertical and horizontal structure of these images made it difficult to perceive changes in the orientation of the blur. We therefore instead explored the aftereffects for a different image set composed of filtered noise. This had the advantage that the image itself was largely isotropic (before blurring) and again provided a sensitive stimulus for the orientation judgments (Sawides et al., 2010). Mean results for these are plotted in Figure 9. The level of IOT tended to be lower for the noise, but was still substantial. Thus like the isotropic blur, the adaptation to astigmatism included a strong binocular component. Finally, there was little consistent bias in the adaptation toward one axis of the astigmatism over the other (Figure 5). This is not surprising, but further highlights the asymmetry in the aftereffects for different magnitudes of blur observed in the defocus and slope manipulations.
Figure 8.
Average aftereffects for three observers following adaptation to simulated astigmatism in the natural textures. Left panel: monocular adaptation; right panel: contingent adaptation. Symbols as in Figure 3. P values indicate whether aftereffects were selective for the adapting eye.
Figure 9.
Average aftereffects for five observers following adaptation to simulated astigmatism in the noise images. Left panel: monocular adaptation; right panel: contingent adaptation. Symbols as in Figure 3. P values indicate whether aftereffects were selective for the adapting eye.
Discussion
As noted in the Introduction, differences in refractive error between the eyes commonly occur. Moreover, small errors (e.g., of 0.25 diopters) are sufficient to induce a measureable change in the state of blur adaptation. Here we asked how the visual system is adapted to blur—and thus presumably calibrated for judgments of image focus—when the retinal image blur differs between the eyes. Foremost, our results suggest that at least for short timescales this calibration cannot occur independently for each eye. For the types of blur we examined, the adaptation showed strong interocular transfer. This is consistent with many pattern-selective aftereffects, which are thought to reflect sensitivity changes primarily at a cortical locus, and thus at a point where information from the two eyes is combined (Blake, Overton, & Lema-Stern, 1981). In fact, this interocular transfer is often used as a test for a cortical locus. However, the degree of transfer can vary markedly, from nearly complete for some motion aftereffects (Nishida, Ashida, & Sato, 1994; Raymond, 1993) to largely monocular for color contingent aftereffects (such as the McCollough effect), in which the adaptation to the color of a pattern is contingent on the orientation of the pattern (McCollough-Howard & Webster, 2011). Moreover, explanations of the McCollough effect continue to invoke the possibility that this might allow the visual system to correct for optical errors in the eyes (e.g., correlations between orientation and color arising from chromatic aberration and astigmatism [Vul, Krizay, & MacLeod, 2008]). However, for the processes driving short-term adaptation to the blur itself, our results suggest that the visual system must instead adopt a compromise between the eyes when adjusting to the blur.
A strong binocular component in adaptation to either defocus or astigmatic blur is not surprising given that both tilt and spatial frequency aftereffects show strong transfer (Blakemore & Campbell, 1969; Blakemore & Sutton, 1969; Campbell & Maffei, 1971; Gilinsky & Doherty, 1969; Mitchell & Ware, 1974). However, there are a number of ways in which blur adaptation differs from adaptation to the simple grating patterns that have been used to explore tilt and size aftereffects. First, compared to many pattern aftereffects, where the images in the two eyes are similar (e.g., with regard to tilt or motion), blur is a case where in many individuals the visual system might routinely encounter small but significant interocular differences in the retinal image. In theory this could have driven the development of mechanisms to calibrate each eye independently. Second, a recent study found that for gratings the degree of transfer itself varies with spatial frequency, being strongest for higher frequencies while nearly monocular for low (Baker & Meese, 2012). This makes it difficult to extrapolate from single frequencies to the distributed spectra characterizing blur in naturalistic images, especially since optical blur alters not only the amplitude spectrum but also the phase spectrum. Third, there are a number of ways in which blur adaptation differs from the simple predictions of spatial frequency adaptation. For example, the aftereffects cannot be predicted simply from the average amplitude spectrum, since physically focused images behave similarly with regard to the adaptation, even though their spectral slopes may differ markedly (Webster et al., 2002). Moreover, adapting to focused images does not alter the perceived blur of an image, but does lead to selective sensitivity losses at lower spatial frequencies (Bex, Solomon, & Dakin, 2009; Webster & Miyahara, 1997). Such results raise the possibility that blur may be encoded as an explicit feature rather than implicitly by the spatial frequency content. Further, for oriented blur the aftereffects may also include adaptation to the perceived shape changes induced in the images (Sawides et al., 2010). Thus it remains unclear what the underlying basis of blur adaptation may be. Yet regardless of this basis, the pattern of interocular aftereffects for blur is important to evaluate since blur represents an important natural and routine source of interocular variation in the retinal image.
With regard to the isotropic blur, we found that the visual system does not simply adapt to the average blur level, but is instead biased toward the sharper image between the two eyes. Interestingly, this is in the opposite direction of the interactions between different spatial frequency components in patterns such as square waves, where it is the lowest or fundamental frequency that dominates (Nachmias, Sansbury, Vassilev, & Weber, 1973; Tolhurst, 1972; Webster, Mizokami, Svec, & Elliott, 2006). It also represents an interesting exception to a number of results showing that the visual system encodes the summary statistics of images such as their mean level (Alvarez & Oliva, 2009; Ariely, 2001; Chong & Treisman, 2005; Haberman & Whitney, 2007; Parkes, Lund, Angelucci, Solomon, & Morgan, 2001), and can adapt to these summary statistics (Burr & Ross, 2008; Corbett, Wurnitsch, Schwartz, & Whitney, 2012; Durgin & Proffitt; 1996; Webster & Wilson, 2000). The bias in the case of blur magnitude may occur because the separate blur levels through the left and right eyes are not perceptually accessible. For example, higher frequency structure tends to mask the visibility of low frequency structure in images (Harmon & Julesz, 1973; Schyns & Oliva, 1999). Moreover, Georgeson and colleagues have shown that when a blurred and sharpened version of the same Gaussian edge is added with similar contrasts, the perceived blur is dominated by the sharper edge (Georgeson, May, Freeman, & Hesse, 2007). This effect is very similar and might underlie the biases we found when “adding” the different versions through the two eyes. Finally, Fahle (1982) and Arnold, Grove, and Wallis (2007) showed that focused images tend to dominate blurred images in binocular rivalry. This raises the possibility that the blurred image might be suppressed prior to the site of the blur adaptation. Regardless of its basis, our findings suggest that the adaptation may largely adjust to some forms of blur like defocus according to the better focused eye, and thus again does not calibrate separately or equally for the two eyes.
We examined only very brief exposures to a change in blur between the eyes. Under natural viewing many observers would instead be chronically exposed to interocular differences in blur. These could result in differential adjustments to the two eyes over longer timescales. For example, in unpublished results as part of a recent study of blur normalization, Elliott et al. (2011) tested a single amblyopic observer and found that she judged the same physical stimulus as focused through either eye, despite pronounced interocular differences in visual acuity. Moreover, blur aftereffects were found for either eye in response to the same physical blur, suggesting that perceived focus in each eye was normalized according to the native blur level. This suggests that forms of plasticity over longer timescales than those we measured might allow the visual system to normalize coding for each eye. A useful extension of the present study would be to compare both focus settings and their adaptation in observers with long-term exposure to uncorrected aberrations in their eyes. In a recent study, Sawides et al. (2012) in fact found that observers appear well adapted to the overall magnitude of blur from their habitually uncorrected high-order aberrations, but are largely insensitive to the specific pattern of the aberrations, and this could potentially occur because of a failure to adjust to interocular differences in the these aberrations. Thus the extent to which long-term adjustments might be calibrated for the specific characteristics of an individual's retinal image remains uncertain. Again, however, the present work suggests that interocular differences in blur are to a large extent not independently compensated through the rapid recalibration of perceived focus induced by short-term adaptation.
Acknowledgments
This study was supported by EY-10834 (MW), Spanish Government Formación de Personal Investigador (FPI) Predoctoral Fellowship (LS), FIS2008-02065 (SM) and FIS2011-25637 (SM), and European Research Council ERC-2011-AdG-294099 (SM).
Commercial relationships: none.
Corresponding author: Elysse J. Kompaniez.
Email: ekompaniez@unr.edu.
Address: Department of Psychology, University of Nevada, Reno, NV, USA.
Contributor Information
Elysse Kompaniez, Email: ekompaniez@unr.edu.
Lucie Sawides, Email: lucie@io.cfmac.csic.es.
Susana Marcos, Email: susana@io.cfmac.csic.es.
Michael A. Webster, Email: mwebster@unr.edu.
References
- Almeder L. M., Peck L. B., Howland H. C. (1990). Prevalence of anisometropia in volunteer laboratory and school screening populations. Investigative Ophthalmology & Visual Science , 31 (11), 2448–2455, http://www.iovs.org/content/31/11/2448. [PubMed] [Article] [PubMed] [Google Scholar]
- Alvarez G. A., Oliva A. (2009). Spatial ensemble statistics are efficient codes that can be represented with reduced attention. Proceedings of the National Academy of Sciences, USA , 106 (18), 7345–7350. [DOI] [PMC free article] [PubMed] [Google Scholar]
- Ariely D. (2001). Seeing sets: Representation by statistical properties. Psychological Science , 12 (2), 157–162. [DOI] [PubMed] [Google Scholar]
- Arnold D. H., Grove P. M., Wallis T. S. A. (2007). Staying focused: A functional account of perceptual suppression during binocular rivalry. Journal of Vision , 7 (7): 19 1–8, http://www.journalofvision.org/content/7/7/7, doi:10.1167/7.7.7. [PubMed] [Article] [DOI] [PubMed] [Google Scholar]
- Artal P., Chen L., Fernandez E. J., Singer B., Manzanera S., Williams D. R. (2004). Neural compensation for the eye's optical aberrations. Journal of Vision , 4 (4): 19 281–287, http://www.journalofvision.org/content/4/4/4, doi:10.1167/4.4.4. [PubMed] [Article] [DOI] [PubMed] [Google Scholar]
- Baker D. H., Meese T. S. (2012). Interocular transfer of spatial adaptation is weak at low spatial frequencies. Vision Research , 63, 81–87. [DOI] [PubMed] [Google Scholar]
- Bex P. J., Solomon S. G., Dakin S. C. (2009). Contrast sensitivity in natural scenes depends on edge as well as spatial frequency structure. Journal of Vision , 9 (10): 19 1–19, http://www.journalofvision.org/content/9/10/1, doi:10.1167/9.10.1. [PubMed] [Article] [DOI] [PMC free article] [PubMed] [Google Scholar]
- Blake R., Overton R., Lema-Stern S. (1981). Interocular transfer of visual aftereffects. Journal of Experimental Psychology: Human Perception and Performance , 7 (2), 367–381. [DOI] [PubMed] [Google Scholar]
- Blakemore C., Campbell F. W. (1969). On the existence of neurons in the human visual system selectively sensitive to the orientation and size of retinal images. Journal of Physiology , 203 (1), 237–260. [DOI] [PMC free article] [PubMed] [Google Scholar]
- Blakemore C., Sutton P. (1969). Size adaptation: A new aftereffect. Science , 166 (902), 245–247. [DOI] [PubMed] [Google Scholar]
- Blum H. L., Peters H. P., Bettman J. W. (1959). Vision screening for elementary schools: The Orinda study (pp 103–104). Berkeley, CA: University of California Press. [Google Scholar]
- Burr D., Ross J. (2008). A visual sense of number. Current Biology , 18 (6), 425–428. [DOI] [PubMed] [Google Scholar]
- Campbell F. W., Maffei L. (1971). The tilt after-effect: A fresh look. Vision Research , 11 (8), 833–840. [DOI] [PubMed] [Google Scholar]
- Chong S. C., Treisman A. (2005). Statistical processing: Computing the average size in perceptual groups. Vision Research , 45 (7), 891–900. [DOI] [PubMed] [Google Scholar]
- Corbett J., Wurnitsch N., Schwartz A., Whitney D. (2012). An aftereffect of adaptation to mean size. Visual Cognition , 20, 211–231. [DOI] [PMC free article] [PubMed] [Google Scholar]
- Donahue S. P. (2005). The relationship between anisometropia, patient age, and the development of amblyopia. Transactions of the American Ophthalmological Society , 103, 313–336. [PMC free article] [PubMed] [Google Scholar]
- Durgin F. H., Proffitt D. R. (1996). Visual learning in the perception of texture: Simple and contingent aftereffects of texture density. Spatial Vision , 9 (4), 423–474. [DOI] [PubMed] [Google Scholar]
- Elliott S. L., Georgeson M. A., Webster M. A. (2011). Response normalization and blur adaptation: Data and multi-scale model. Journal of Vision , 11 (2): 19 1–18, http://www.journalofvision.org/content/11/2/7, doi:10.1167/11.2.7. [PubMed] [Article] [DOI] [PMC free article] [PubMed] [Google Scholar]
- Fahle M. (1982). Binocular rivalry: Suppression depends on orientation and spatial frequency. Vision Research , 22, 787–800. [DOI] [PubMed] [Google Scholar]
- Field D. J., Brady N. (1997). Visual sensitivity, blur and the sources of variability in the amplitude spectra of natural scenes. Vision Research , 37 (23), 3367–3383. [DOI] [PubMed] [Google Scholar]
- Flom M. C., Bedell H. E. (1985). Identifying amblyopia using associated conditions, acuity, and nonacuity features. American Journal of Optometry and Physiological Optics , 62, 1543. [DOI] [PubMed] [Google Scholar]
- George S., Rosenfield M. (2004). Blur adaptation and myopia. Optometry & Vision Science , 81 (7), 543–547. [DOI] [PubMed] [Google Scholar]
- Georgeson M. A., May K. A., Freeman T. C., Hesse G. S. (2007). From filters to features: Scale-space analysis of edge and blur coding in human vision. Journal of Vision , 7 (13): 19 1–21, http://www.journalofvision.org/content/7/13/7, doi:10.1167/7.13.7. [PubMed] [Article] [DOI] [PubMed] [Google Scholar]
- Gilinsky A. S., Doherty R. S. (1969). Interocular transfer of orientational effects. Science , 164 (878), 454–455. [DOI] [PubMed] [Google Scholar]
- Haberman J., Whitney D. (2007). Rapid extraction of mean emotion and gender from sets of faces. Current Biology , 17 (17), R751–753. [DOI] [PMC free article] [PubMed] [Google Scholar]
- Harmon L. D., Julesz B. (1973). Masking in visual recognition: Effects of two-dimensional filtered noise. Science , 180 (91), 1194–1197. [DOI] [PubMed] [Google Scholar]
- Howland H. C., Howland B. (1977). A subjective method for the measurement of monochromatic aberrations of the eye. Journal of the Optical Society of America , 67 (11), 1508–1518. [DOI] [PubMed] [Google Scholar]
- Jain S., Arora I., Azar D. T. (1996). Success of monovision in presbyopes: Review of the literature and potential applications to refractive surgery. Survey of Ophthalmology , 40 (6), 491–499. [DOI] [PubMed] [Google Scholar]
- Lombardo M., Lombardo G., Serrao S. (2006). Interocular high-order corneal wavefront aberration symmetry. Journal of the Optical Society of America A: Optics, Image Science, & Vision , 23 (4), 777–787. [DOI] [PubMed] [Google Scholar]
- Marcos S., Burns S. A. (2000). On the symmetry between eyes of wavefront aberration and cone directionality. Vision Research , 40 (18), 2437–2447. [DOI] [PubMed] [Google Scholar]
- May K. A., Georgeson M. A. (2007). Blurred edges look faint, and faint edges look sharp: The effect of a gradient threshold in a multi-scale edge coding model. Vision Research , 47 (13), 1705–1720. [DOI] [PubMed] [Google Scholar]
- May K. A., Zhaoping L., Hibbard P. B. (2012). Perceived direction of motion determined by adaptation to static binocular images. Current Biology , 22 (1), 28–32. [DOI] [PubMed] [Google Scholar]
- McCollough-Howard C., Webster M. A. (2011). McCollough effect. Scholarpedia , 6 (2) 8175. [Google Scholar]
- McKendrick A. M., Brennan N. A. (1997). The axis of astigmatism in right and left eye pairs. Optometry & Vision Science , 74 (8), 668–675. [DOI] [PubMed] [Google Scholar]
- Mitchell D. E., Ware C. (1974). Interocular transfer of a visual after-effect in normal and stereoblind humans. Journal of Physiology , 236 (3), 707–721. [DOI] [PMC free article] [PubMed] [Google Scholar]
- Mon-Williams M., Tresilian J. R., Strang N. C., Kochhar P., Wann J. P. (1998). Improving vision: Neural compensation for optical defocus. Proceedings of the Royal Society B: Biological Sciences , 265 (1390), 71–77. [DOI] [PMC free article] [PubMed] [Google Scholar]
- Nachmias J., Sansbury R., Vassilev A., Weber A. (1973). Adaptation to square-wave gratings: In search of the illusive third-harmonic. Vision Research , 13 (7), 1335–1342. [DOI] [PubMed] [Google Scholar]
- Nishida S., Ashida H., Sato T. (1994). Complete interocular transfer of motion aftereffect with flickering test. Vision Research , 34 (20), 2707–2716. [DOI] [PubMed] [Google Scholar]
- Parkes L., Lund J., Angelucci A., Solomon J. A., Morgan M. (2001). Compulsory averaging of crowded orientation signals in human vision. Nature Neuroscience , 4 (7), 739–744. [DOI] [PubMed] [Google Scholar]
- Pesudovs K., Brennan N. A. (1993). Decreased uncorrected vision after a period of distance fixation with spectacle wear. Optometry & Vision Science , 70 (7), 528–531. [DOI] [PubMed] [Google Scholar]
- Porter J., Guirao A., Cox I. G., Williams D. R. (2001). Monochromatic aberrations of the human eye in a large population. Journal of the Optical Society of America A: Optics, Image Science, & Vision , 18 (8), 1793–1803. [DOI] [PubMed] [Google Scholar]
- Qin X. J., Margrain T. H., To C. H., Bromham N., Guggenheim J. A. (2005). Anisometropia is independently associated with both spherical and cylindrical ametropia. Investigative Ophthalmology & Visual Science , 46 (11), 4024–31, http://www.iovs.org/content/46/11/4024. [PubMed] [Article] [DOI] [PubMed] [Google Scholar]
- Rajeev N., Metha A. (2010). Enhanced contrast sensitivity confirms active compensation in blur adaptation. Investigative Ophthalmology & Visual Science , 51 (2), 1242–1246, http://www.iovs.org/content/51/2/1242. [PubMed] [Article] [DOI] [PubMed] [Google Scholar]
- Raymond J. E. (1993). Complete interocular transfer of motion adaptation effects on motion coherence thresholds. Vision Research , 33 (13), 1865–1870. [DOI] [PubMed] [Google Scholar]
- Rosenfield M., Gilmartin B. (1999). Accommodative error, adaptation and myopia. Ophthalmic & Physiological Optics , 19 (2), 159–164. [DOI] [PubMed] [Google Scholar]
- Sawides L., de Gracia P., Dorronsoro C., Webster M., Marcos S. (2011a). Adapting to blur produced by ocular high-order aberrations. Journal of Vision , 11 (7): 19 1–11, http://www.journalofvision.org/content/11/7/21, doi:10.1167/11.7.21. [PubMed] [Article] [DOI] [PMC free article] [PubMed] [Google Scholar]
- Sawides L., de Gracia P., Dorronsoro C., Webster M. A., Marcos S. (2011b). Vision is adapted to the natural level of blur present in the retinal image. PLoS One , 6 (11), e27031. [DOI] [PMC free article] [PubMed] [Google Scholar]
- Sawides L., Dorronsoro C., De Gracia P., Vinas M., Webster M., Marcos S. (2012). Dependence of subjective image focus on the magnitude and pattern of high order aberrations. Journal of Vision , 12 (8): 19 1–12, http://www.journalofvision.org/content/12/8/4, doi:10.1167/12.8.4. [PubMed] [Article] [DOI] [PubMed] [Google Scholar]
- Sawides L., Marcos S., Ravikumar S., Thibos L., Bradley A., Webster M. (2010). Adaptation to astigmatic blur. Journal of Vision , 10 (12): 19 1–15, http://www.journalofvision.org/content/10/12/22, doi:10.1167/10.12.22. [PubMed] [Article] [DOI] [PMC free article] [PubMed] [Google Scholar]
- Schyns P. G., Oliva A. (1999). Dr. Angry and Mr. Smile: when categorization flexibly modifies the perception of faces in rapid visual presentations. Cognition , 69 (3), 243–265. [DOI] [PubMed] [Google Scholar]
- Statterfield D. S. (1989). Prevalence and variation of astigmatism in a military population. Journal of the American Optometry Association , 60, 14–18. [PubMed] [Google Scholar]
- Tolhurst D. J. (1972). Adaptation to square-wave gratings: Inhibition between spatial frequency channels in the human visual system. Journal of Physiology , 226 (1), 231–248. [DOI] [PMC free article] [PubMed] [Google Scholar]
- Vera-Diaz F. A., Woods R. L., Peli E. (2010). Shape and individual variability of the blur adaptation curve. Vision Research , 50 (15), 1452–1461. [DOI] [PMC free article] [PubMed] [Google Scholar]
- Vul E., Krizay E., MacLeod D. I. (2008). The McCollough effect reflects permanent and transient adaptation in early visual cortex. Journal of Vision , 8 (12): 19 1–12, http://www.journalofvision.org/content/8/12/4, doi:10.1167/8.12.4. [PubMed] [Article] [DOI] [PubMed] [Google Scholar]
- Webster M. A. (2011). Adaptation and visual coding. Journal of Vision , 11 (5): 19 1–23, http://www.journalofvision.org/content/11/5/3, doi:10.1167/11.5.3. [PubMed] [Article] [DOI] [PMC free article] [PubMed] [Google Scholar]
- Webster M. A., Georgeson M. A., Webster S. M. (2002). Neural adjustments to image blur. Nature Neuroscience , 5 (9), 839–840. [DOI] [PubMed] [Google Scholar]
- Webster M. A., Miyahara E. (1997). Contrast adaptation and the spatial structure of natural images. Journal of the Optical Society of America A: Optics, Image Science, & Vision , 14 (9), 2355–2366. [DOI] [PubMed] [Google Scholar]
- Webster M. A., Mizokami Y., Svec L. A., Elliott S. L. (2006). Neural adjustments to chromatic blur. Spatial Vision , 19 (2-4), 111–132. [DOI] [PubMed] [Google Scholar]
- Webster M. A., Wilson J. A. (2000). Interactions between chromatic adaptation and contrast adaptation in color appearance. Vision Research , 40 (28), 3801–3816. [DOI] [PubMed] [Google Scholar]
- Yehezkel O., Sagi D., Sterkin A., Belkin M., Polat U. (2010). Learning to adapt: Dynamics of readaptation to geometrical distortions. Vision Research , 50 (16), 1550–1558. [DOI] [PubMed] [Google Scholar]


