Supplemental Digital Content is available in the text.
Abstract
Measuring and monitoring socioeconomic health inequalities are critical for understanding the impact of policy decisions. However, the measurement of health inequality is far from value neutral, and one can easily present the measure that best supports one’s chosen conclusion or selectively exclude measures. Improving people’s understanding of the often implicit value judgments is therefore important to reduce the risk that researchers mislead or policymakers are misled. While the choice between relative and absolute inequality is already value laden, further complexities arise when, as is often the case, health variables have both a lower and upper bound, and thus can be expressed in terms of either attainments or shortfalls, such as for mortality/survival.
We bring together the recent parallel discussions from epidemiology and health economics regarding health inequality measurement and provide a deeper understanding of the different value judgments within absolute and relative measures expressed both in attainments and shortfalls, by graphically illustrating both hypothetical and real examples. We show that relative measures in terms of attainments and shortfalls have distinct value judgments, highlighting that for health variables with two bounds the choice is no longer only between an absolute and a relative measure but between an absolute, an attainment- relative and a shortfall-relative one. We illustrate how these three value judgments can be combined onto a single graph which shows the rankings according to all three measures, and illustrates how the three measures provide ethical benchmarks against which to judge the difference in inequality between populations.
Health inequality may be defined as variations in health among individuals or between groups (e.g., by socioeconomic status, education, or race), within a population. To rank populations by the level of inequality within them, one needs a measure that summarizes health differences into a single value; however, there are many different ways to summarize such dispersion. As with many statistical representations, one can choose a health inequality measure that supports pre-existing conclusions, or selectively leave out measures. This is because the measurement of health inequality is far from value neutral. Therefore, it is critical that both those applying health inequality measures and those basing policy decisions on these applications understand the often implicit value judgments.
One example of a value-laden decision is the choice of an inequality equivalence criterion, which specifies the manner in which additional health/resources are to be distributed to preserve the current level of inequality. Often in the epidemiological literature, this choice is presented as one between either distributing a constant increase to everyone or distributing an increase proportional to everyone’s initial level. That is, a choice between an absolute or relative health inequality measure. This article sheds light on the complexity of this choice for health variables with both a lower and upper bound.
Many applications analyzing health inequality use bounded health variables such as mortality, self-assessed health, smoking (smoker/nonsmoker), and the prevalence of a health state or condition.1–3 Having two bounds means that the health variable can be represented as either attainments (e.g., survival) or shortfalls (e.g., mortality), and choosing one representation over the other completely changes the value judgments contained within relative measures (i.e., a proportional increase in attainments is very different to a proportional decrease in shortfalls). Although there are also other features of inequality measures, such as the importance (weights) we place on different people in society,4–7 this article focuses on the inequality equivalence criterion, which is a value judgment that commonly changes among the inequality measures used in studies.
While health inequality measurement is of interest across many academic fields, the contributions generally originate from epidemiologists and economists. Lately, there have been parallel discussions in both disciplines about the implicit value judgments behind these indices (and whether an absolute or a relative judgment is preferable).6–22 As the main methods and measures used in epidemiology and economics are very much related, these discussions are relevant for both disciplines. Therefore, this article synthesizes these discussions in regard to recent advancements, illuminating the issues of how to measure health inequalities for variables with a lower and an upper bound. The article highlights that the additional dimension added by the two bounds of health variables further stresses the importance of actively considering and explaining the indices’ value judgments.
With this objective in mind, we review the common health inequality measures in the two disciplines—and how they relate—before elaborating on the additional issues that arise when the variable has two bounds. To explain and illustrate the implications of the underlying value judgments, we use both hypothetical and empirical examples. We further contribute to this literature by suggesting a novel way to present the level of inequality in a set of populations, combining several value judgments onto a single graph, which informs the reader about the nature of inequality differences between populations and facilitates a deeper understanding of how and why the choice of index affects the ranking of populations.
RELATIVE VERSUS ABSOLUTE
To compare inequality between populations with different mean health, one must decide what distribution of health changes would preserve a population’s level of inequality. Asada8 pedagogically describes the value judgment behind absolute and relative inequality equivalence criteria using a population consisting of two equal sized groups, here denoted A and B, with an initial life expectancy of 20 and 30 years, respectively (Figure 1). She presents the reader with a hypothetical experiment where all individuals take either a red pill or a blue pill. Both pills increase the average life expectancy in the population by the same amount (25 years), but they distribute the improvements differently. If everyone in the population takes a red pill, life expectancy in each group increases uniformly by 25 years (an absolute increase). If everyone in the population takes a blue pill, life expectancy in the two groups doubles to 40 and 60 years, respectively (a proportional increase).
FIGURE 1.
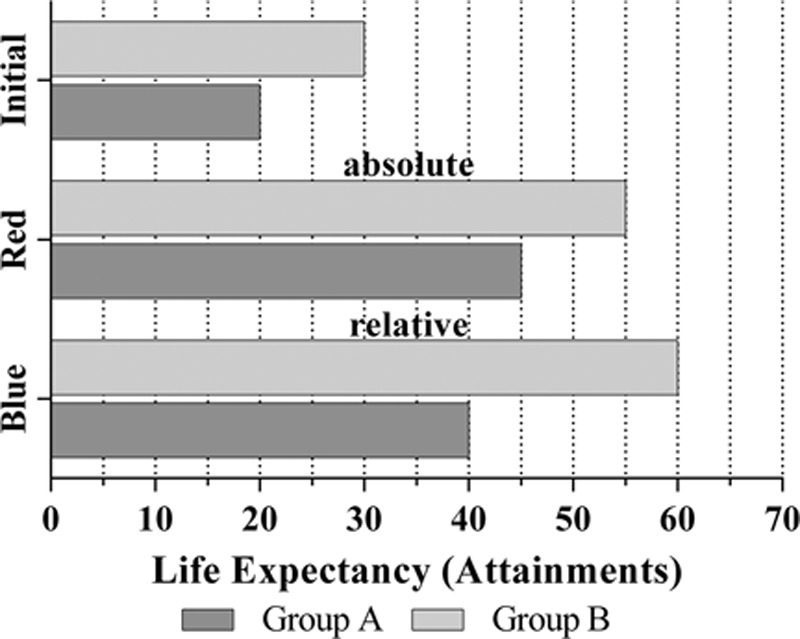
Asada’s hypothetical experiment. This figure illustrates Asada’s hypothetical experiment and pedagogical example.8 The bars represent the initial distribution and the distribution after each individual in the population has received a red or a blue pill. The red pill increases life expectancy by equal amounts in the two groups, whereas the blue pill increases life expectancy proportionally. For the red pill, the absolute difference between the two groups is constant at 10, while the ratio decreases from 1.5 to 1.22. For the blue pill, the absolute difference increases to 20, whereas the ratio is constant at 1.5.
The arithmetic difference between the two groups (i.e., the rate difference),23 or any other absolute inequality measure, would be invariant to the change induced by the red pill but increase in response to the blue. The ratio between the two groups (i.e., the rate ratio)23—or any other relative inequality measure including the rate difference divided by the mean health—would be invariant to the change induced by the blue pill but decrease in response to the red. Although we are unlikely to all agree upon one measure (as shown in Gakidou et al.24), most might agree that inequality would not decrease if everyone took the blue pill (i.e., a proportional increase); if anything one may perceive an increase since absolute inequality will increase; and inequality would not increase if everyone took the red pill (i.e., a uniform increase); if anything one may perceive a decrease because relative inequality will decrease. The example illustrates that, in line with the conclusion in Harper et al.,6 it is generally a sensible idea to present the reader with both relative and absolute versions of inequality measures to compare inequality between populations.
COMMON HEALTH INEQUALITY MEASURES
Although economists and epidemiologists traditionally use different toolboxes to measure socioeconomic health inequality, there are more similarities than differences. The rate ratio, which simply compares the ratio of the extremes—the least and the most well-off groups—of the population, is the most frequently used measure among epidemiologists.23 A more sophisticated measure that accounts for the full distribution is the relative index of inequality. The relative index of inequality is based on a regression of an individual’s health and its fractional rank according to income (or some other socioeconomic variable), and tells us the difference in (predicted) health between the lowest and the highest rank relative to the mean.25 It may also be presented as a (odds) ratio between the (predicted) health of the lowest and highest ranked.26 The measure resemblances, and has a specific mathematic relation with, the common inequality measure in health economics, the concentration index, but the interpretation varies slightly.27 Just as for the rate ratio the level of inequality according to the concentration index, and the relative index of inequality, is preserved if health changes proportionally.
To obtain absolute counterparts of the relative index of inequality and the concentration index, these measures are multiplied by the population’s mean health, which yields the slope index of inequality, and what is called in the economics literature the “generalized” concentration index.25,27 For these indices, the level of inequality is preserved if health changes uniformly.
ISSUES WITH INEQUALITY MEASURES WHEN THE VARIABLE HAS TWO BOUNDS
Health inequality measures within economics generally originate from the income inequality literature. The concentration index, for example, is an adaption of the often-used Gini-coefficient.27 As long as we consider a health variable that like income has a lower bound equal to zero, but is unbounded from above the analogy to income is unproblematic. Without a fixed and intuitive “zero-point” (e.g., zero life expectancy) the concept of a proportional change, such as that in Asada’s experiment, is unclear (and population rankings may depend on our choice of this zero point). One common example is self-assessed health where the choice of a zero-point can be somewhat arbitrary, even when using the lowest level of health (poor health) as zero.
Life expectancy, which is used in the example above, has a clear lower bound of zero, but is also, at least to some extent, bounded from above—we are yet to find a cure for ageing. Although there is no formal upper bound of an individual’s length of life, both the burden of disease literature and to some extent the health inequality literature also regard life expectancy as a bounded variable from which one may define shortfalls, labeled as years of life lost.28,29 For any variable with two bounds the data can be represented in terms of attainments from the lower bound or shortfalls from the upper bound (the maximum). This means that there are two possible intuitive “zero points”—one where attainment is zero and one where shortfall is zero. In addition, for a health condition or a binary health risk factor, we may define either the existence or absence as zero or one and again have two possible intuitive “zero points.” The issue is that how one chooses to represent the data, as shortfalls or attainments (or defining existence or absence as a zero or one), may affect the ranking of inequality in populations when particular health inequality measures are used.15,30 These concerns have sparked an ongoing discussion of how to deal with inequalities of binary and bounded health variables, and economists have suggested versions of the concentration index that try to bypass these issues.15,31 Harper et al.6 briefly mention this dimension in their discussion of reference points. More generally, analyzing data as attainments or shortfalls may also change the conclusions from regressions when the assumed functional form is not symmetric about the midpoint of the double bounded dependent variable (e.g., Poisson).
RELATIVE VERSUS ABSOLUTE REVISITED
Extending Asada’s Experiment
To illustrate that the possible representation of the data as shortfalls or attainments complicates the choice of inequality measure that an applied researcher may need to consider, we extend Asada’s example to a double bounded variable by assuming that life expectancy is bounded from above at 100 years. For the two groups in our hypothetical experiments with initial life expectancy of 20 and 30 years, shortfalls from the assumed maximum are 80 and 70 years, respectively. Figure 2 introduces a new hypothetical experiment in which everyone in the population either takes a yellow pill, which decreases shortfall uniformly by 25 years, or a green pill, which decreases shortfalls proportionally from 80 and 70 years to 531/3 and 462/3 years, respectively. The initial distribution and the total increase in life expectancy are the same as in Asada’s original experiment, but for the relative measure the increase in life expectancy is distributed in proportion to each group’s shortfall rather than their attainment. If our concern lies with absolute differences, the yellow pill preserves, whereas the green decreases the level of inequality. If our concern lies with “relative” differences in shortfalls, the yellow pill increases, whereas the green preserves the level of inequality.
FIGURE 2.
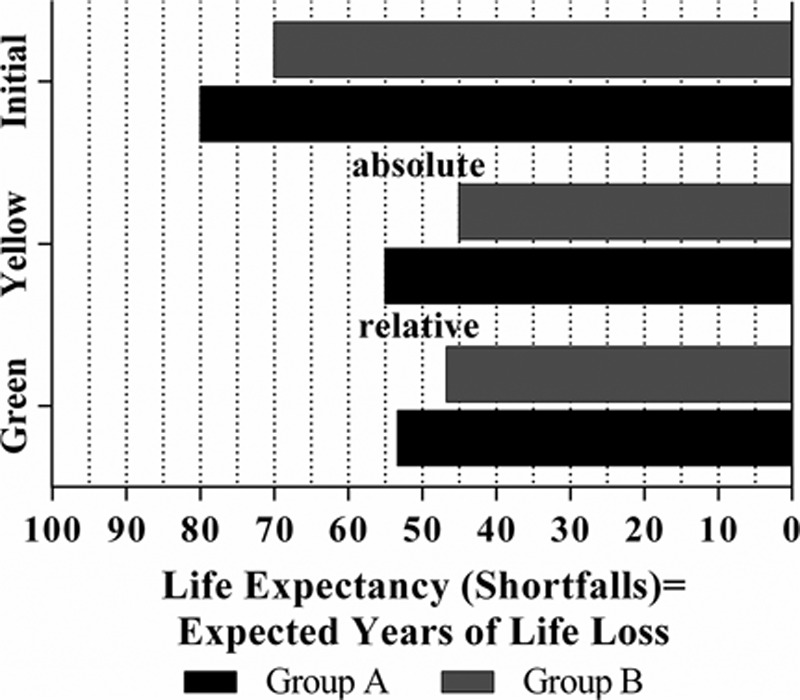
A shortfall version of Asada’s hypothetical experiment. This figure illustrates an extension of Asada’s original experiments from Figure 1. The bars represent the initial distribution, and the outcomes of the yellow and green pills in terms of shortfalls of life expectancy (instead of attainments), assuming that life expectancy is bounded at 100. The yellow pill increases life expectancy uniformly, whereas the green pill increases life expectancy by proportionally decreasing the shortfall of life expectancy (or years of life lost). For the yellow pill, the absolute difference between the two groups is constant at 10, whereas the shortfall ratio increases from 1.14 to 1.22. For the green pill, the absolute difference decreases to 6.67, whereas the shortfall ratio is constant at 1.14.
To demonstrate the problem with bounded variables, we graph Asada’s original experiment and the extension jointly by merging Figure 1 and Figure 2 into Figure 3. The initial distribution and the outcome of the four pills are graphed in terms of both attainments and their matching shortfalls in life years. Essentially the bars representing the outcomes are stacked so that the distribution of attainments is measured from left to right (on the lower horizontal axis) and the matching distribution of shortfalls is by definition represented by the remainder of the bars (measured from right to left on the upper horizontal axis). While all four pills increase the average life expectancy by 25 years, the outcome distributions are different for three pills; only the yellow and the red pill yield the same distributions and therefore are represented by the same bars. The absolute inequality equivalence criterion is equivalent for the two perspectives—any absolute index yields the same level of inequality (and obtains consistent rankings) for shortfalls and attainments. On the contrary, the inequality-preserving changes of the two relative inequality equivalence criteria—represented by the green and the blue pills—are completely different. The changes induced by the yellow/red pill would decrease inequality if our concern lies with relative differences in attained life years, while the same change would increase inequality if our concern lies with relative differences in shortfalls: Relative inequality measures in attainments and shortfalls do not necessarily rank populations consistently.
FIGURE 3.
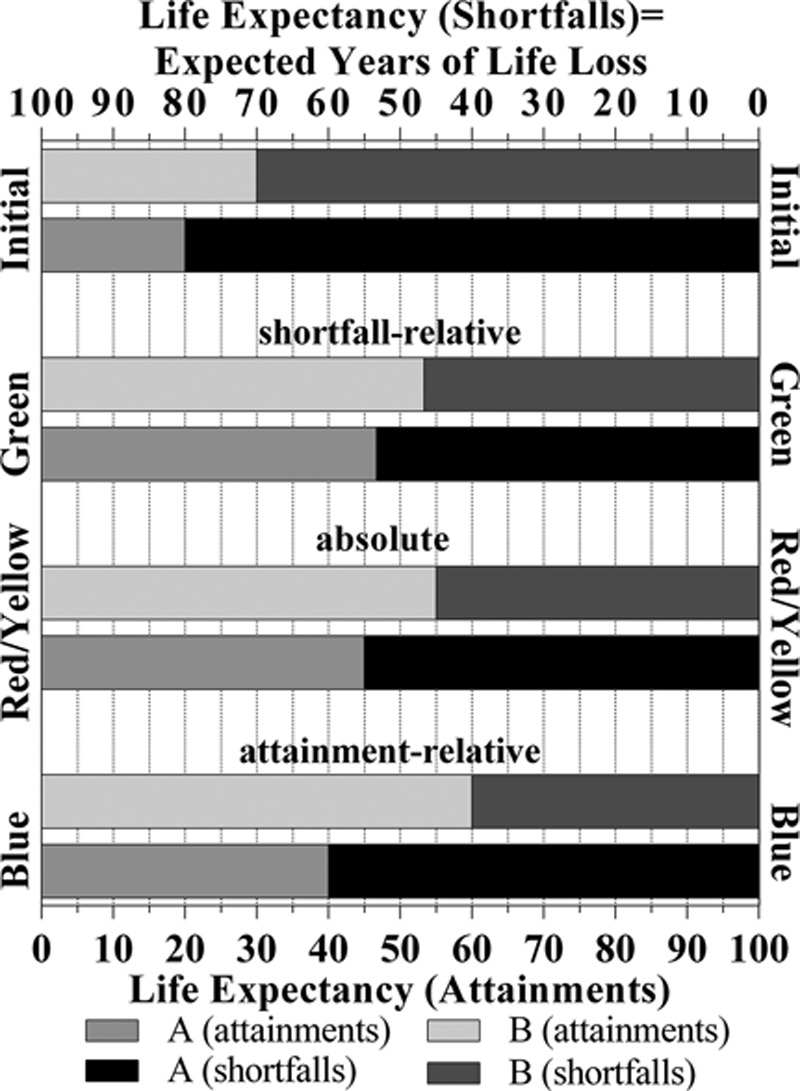
The hypothetical experiments represented as shortfalls and attainments. This figure illustrates both Asada’s original experiments from Figure 1 and the extended experiment from Figure 2 in the same graph. The bars represent the initial distribution and the outcomes of each of the pills in attainments and matching shortfalls. Any pill induces the same increase in average life expectancy, but the increase is distributed differently in the population. The different ways to distribute the total increase may be interpreted as the inequality equivalence criteria of the different indices.
In the epidemiologic literature, the difference between the green and the blue pill has mostly passed unnoticed. The choice is instead often only presented as one between either an absolute or a relative health inequality measure: King et al.32 review the frequency with which absolute and relative measures are used, without mentioning this dimension. The health-economic literature has acknowledged that a relative measure may rank populations differently depending on whether attainments or shortfalls are used and have shown that an index cannot, at the same time, measure relative inequality and guarantee consistent rankings of attainments and shortfalls.17,30 But health economists are divided on how to approach this issue. One strand of the literature uses this result to stress that for bounded variables it is important to only use a measure that ranks populations consistently for shortfalls and attainments as the representation of data should not affect the outcome of the analysis. Consequently, this strand advocates an absolute measure over a relative one, due to the latter’s inconsistency.15,17,33
Another strand of the literature highlights that the inconsistent ranking of relative inequality measures in attainments and shortfalls is because they each embody different value judgments about what constitutes an inequality preserving change in health.13,14,34 To explicitly distinguish the two relative value judgments, we may refer to them as attainment-relative and shortfall-relative. By presenting the two hypothetical experiments jointly with respect to both shortfalls and attainment, Figure 3 illustrates the difference in the inequality-preserving changes of the two. A shortfall-relative inequality equivalence criterion may be compatible with universal proportionalism as presented by Marmot,35 where the sick are treated in proportion to their level of disadvantage or severity of illness. An attainment-relative inequality equivalence criterion is closer to the standard relative one generally found in the income inequality literature: increasing life expectancy (i.e., growth) is distributed in proportion to how healthy individuals are, or health deteriorates over time (potentially due to aging) in proportion to how healthy individuals are.36,37 Absolute, attainment-relative, and shortfall-relative all represent plausible positions on what one could consider as being an inequality preserving change in health—one need not hold that view oneself, merely acknowledge that someone else could.
Accepting all these as possible viewpoints implies that for a bounded variable the researcher not only has to choose between a relative and an absolute value judgment but must also choose between analyzing relative inequality in either attainments or shortfalls (i.e., choose between an attainment-relative, absolute, or shortfall-relative measure). The most appropriate choice is not clear as this requires a value judgment which may vary between individuals and contexts.
Illustrative Empirical Examples of the Three Measures
To further illustrate the relation among the attainment-relative, absolute, and shortfall-relative inequality measures, and how the choice of index may influence the conclusions, we present an epidemiologic2 and a health economic3 example. The former uses slope index of inequality and relative index of inequality (presented as odds ratios) to compare socioeconomic inequalities in mortality (shortfalls) among males in a country, Russia, with comparably high levels of average (age-standardized) mortality rates, with other Eastern European countries with more moderate mortality rates. Table reports attainment-relative, absolute, and a shortfall-relative inequality measures for age-standardized mortality rates per 1,000 person-years, demonstrating that the choice of measure influences the comparison: Russia is the most unequal according to the attainment-relative and absolute measure, while it is the least unequal according to the shortfall-relative measure.
TABLE.
Socioeconomic Inequality in Mortality/Survival in Eastern Europe
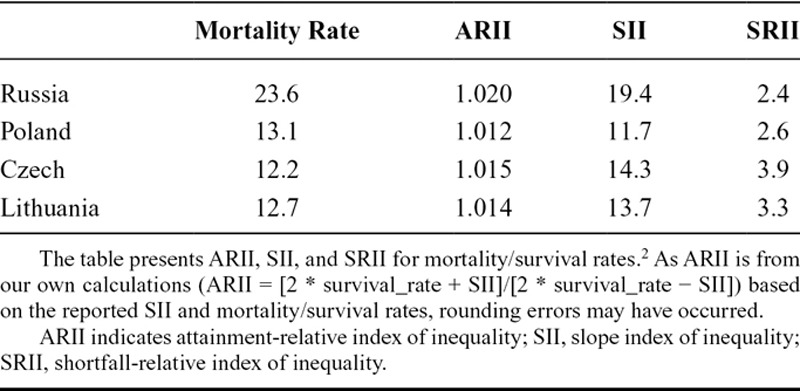
To demonstrate how these differences relates to mean population health (average mortality/survival rates), we graph, in Figure 4, the absolute inequality against mean health (i.e., survival and mortality rates) for Russia and Poland. To explicitly show the relation between average shortfalls and attainments, we let the x-axis be measured in attainments (e.g., survival rates) from left to right and in matching shortfalls (e.g., mortality rates) from right to left. To further highlight the inequality equivalence criteria we draw three lines, each representing any population with the same level of attainment-relative, absolute, or shortfall-relative inequality as Russia. Suppose one could reduce Russia’s high mortality rate (23.6) to that in Poland (13.1) by either proportionally reducing the mortality rates (relative to shortfalls) or uniformly reducing the mortality rates (absolute) or increasing the survival rates proportionally (relative to attainments) over the socioeconomic groups. The three lines correspond to how the absolute level of inequality would change as we change the mean for each of these three options.
FIGURE 4.
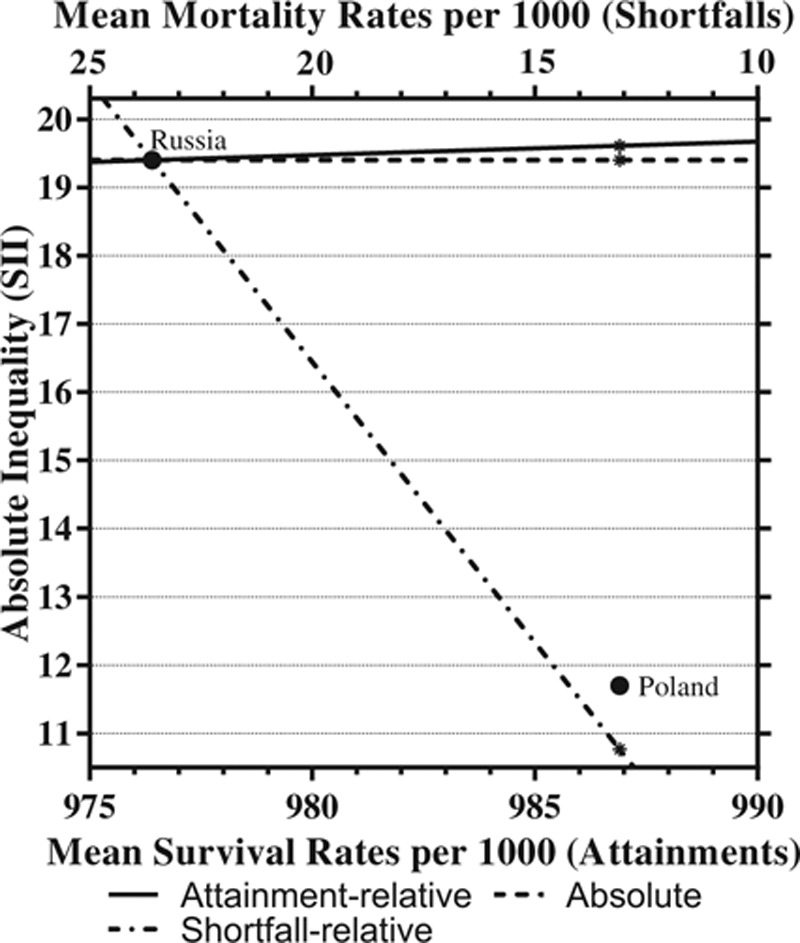
Socioeconomic inequality in mortality/survival in Russia and Poland. This figure plots the absolute inequality as measured by the SII against the (weighted) mean survival/mortality rates for Russia and Poland. The three lines represent populations with the same level of inequality as Russia according to each measure, but with different mean health. The three dots illustrate how Russia would compare with Poland (in terms of absolute inequality) if mortality rates were reduced by proportionally reducing the mortality rates (relative to shortfalls), uniformly reducing the mortality rates (absolute), or increasing the survival rates proportionally (relative to attainments) over the socioeconomic groups. The lines are plotted using the relation among SII, the mean, and ARII (or SRII). As relative index of inequality (RII) is presented as a (odds) ratio, the attainment-relative lines may be expressed as SII = 2 * mean_attainment * (ARII − 1)/(ARII + 1), and the shortfall-relative as SII = 2 *(1,000 − mean_shortfall) * (SRII − 1)/(SRII + 1), where ARII and SRII are constants representing the level of inequality in Russia according to each measure. ARII indicates attainment-relative index of inequality; SII, slope index of inequality; SRII, shortfall- relative index of inequality.
(1) The downward sloping line corresponds to proportionally reducing the mortality rates (shortfall-relative).
(2) The horizontal line corresponds to the uniform reduction (absolute).
(3) The upward sloping line corresponds to the proportional increase in survival rates (attainment-relative).
Any point above a line represents a higher level of inequality according to that measure, and any point below a line represents a lower level of inequality.
By considering these lines, we can see how the choice of inequality measure affects the comparison of the two countries. While the upward sloping line representing the level of attainment-relative inequality in Russia, as well as the horizontal line representing the absolute inequality level, goes above Poland, the downwards sloping line representing the level of shortfall-relative inequality goes below. Thus, whereas both the uniform and proportional increase of the survival rates would make Russia more unequal than Poland, proportionally decreasing the mortality rates would make it less unequal. Or considered in an alternative manner, Russia would need to decrease mortality in proportion to existing mortality rates (shortfalls) to have less inequality than Poland when it reaches their mean level of mortality. Thus, the inequality measures can also be seen as ethical benchmarks about the distribution of health improvements needed for a population to “catch up” to another.
To clarify how the value judgments affects the ranking of populations in general, we present, in Figure 5, a second example using a larger subsample of the countries from a European comparison of socioeconomic inequality in a self-assessed health variable (the health variable is calibrated such that zero is equivalent to being dead and one is full health). The graph plots absolute inequality (as measured by the generalized concentration index) against the mean attainment/shortfall of self-assessed health. For a specific point such as the one representing France, then among all populations with higher average attainment (i.e., populations to the right), we know that: any populations represented by a point above the attainment-relative line (such as Denmark) will be more unequal than France irrespective of the measure used; any population represented by a point between the attainment-relative and absolute line (such as Austria) will be less unequal than France according to an attainment-relative measure but more unequal according to both an absolute and a shortfall-relative measure; any population represented by a point below the absolute line and above the shortfall-relative line (such as Belgium) will be more unequal than France according to an attainment-relative or an absolute measure, but less unequal according to a shortfall-relative; and any populations represented by a point below the shortfall-relative line (such as Spain) will be less unequal than France irrespective of the measure used. (The reverse order applies to points to the left of France.) Thus, we know that if one population is more unequal than another according to a shortfall-relative AND attainment-relative measure, it is also more unequal according to an absolute measure.
FIGURE 5.
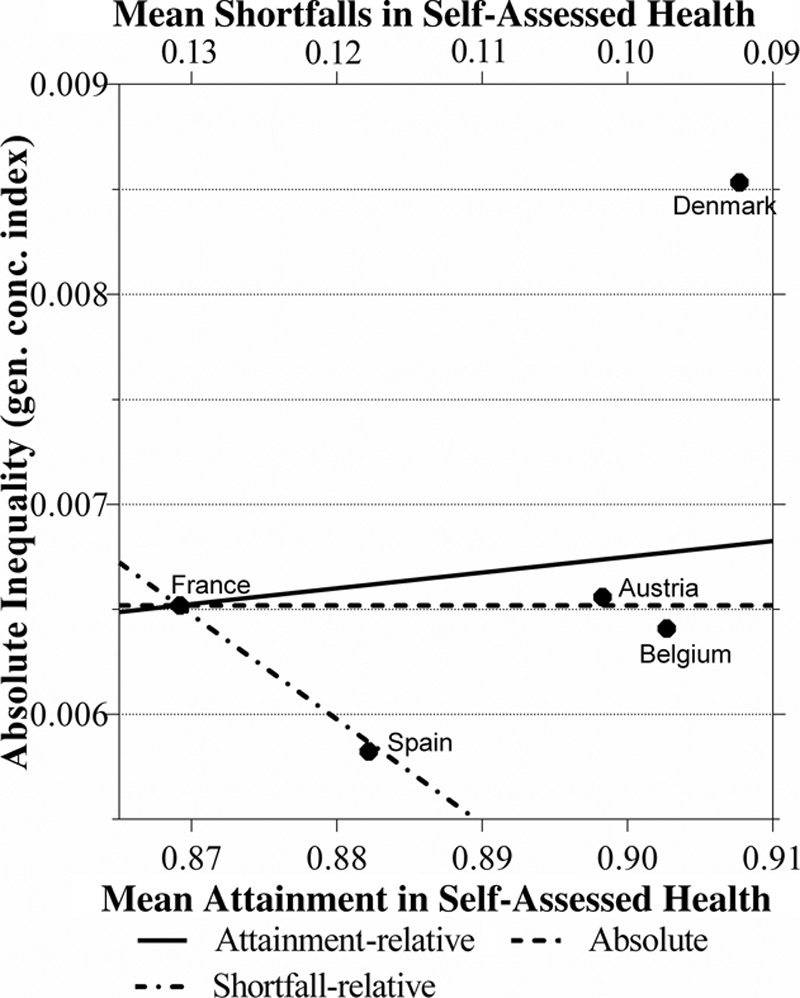
Socioeconomic inequality in self-assessed health in five European countries. This figure plots the absolute inequality (as measured by the generalized concentration index) against self-assessed health (in attainments and matching shortfalls) for a subsample of countries from a European comparison.3 eFigure 1 in the online material (http://links.lww.com/EDE/A925) presents a graph with all countries. The three lines represent populations with the same level of inequality as France according to each measure, but with different mean health. The lines are plotted using the relation among the generalized concentration index, the mean, and (shortfall-relative/attainment-relative) concentration index (see supplementary material; http://links.lww.com/EDE/A925). As it is of semantic importance for interpretation, we ignore that the sign of the generalized concentration index differs if data is represented as shortfall or attainments.
The three lines further show that to increase the average level of attainment without impacting inequality, the shortfall-relative inequality equivalence criterion is the most demanding in an egalitarian sense: it requires the absolute differences (between the two groups) to decrease (this is also apparent when comparing the two groups in Figure 3). However, for a reduction in the average attainment the attainment-relative inequality equivalence criterion would be the most egalitarian in the sense that absolute differences must decrease to preserve inequality.
Knowing, and reflecting upon, this “ordering” allows one to consider whether the conclusions presented in any analysis could have changed if another perspective had been chosen instead. It is therefore important to present a more informative view of the differences in inequality by presenting all three measures, preferably along with the average attainment/shortfalls and a discussion of how the measures relate. One way to facilitate this communication is a graphical illustration such as in Figures 4 and 5.
To avoid over complicating the picture when comparing a larger set of countries on a graph such as Figures 4 and 5 one may prefer to draw generic lines representing particular levels of attainment-relative and shortfall-relative inequality instead of lines representing the levels of inequality for particular populations. Figure 6 presents such a graph, plotting the absolute inequality against mean health, measured as shortfalls (e.g., mortality rates) from right to left and as their matching attainments (e.g., survival rates) from left to right. The levels of attainment-relative inequality will be the same along upward sloping straight lines starting at the attainment origin as proportionally reducing the level of attainment to zero will gradually reduce both absolute inequality and the average level of attainment to zero. Any point above a line represents a higher level of inequality, and any point below represents a lower level of inequality. Thus, the steeper the ray, the higher the level of inequality. To consider the shortfall-relative inequality, we draw similar downward sloping lines ending at the shortfall origin.
FIGURE 6.
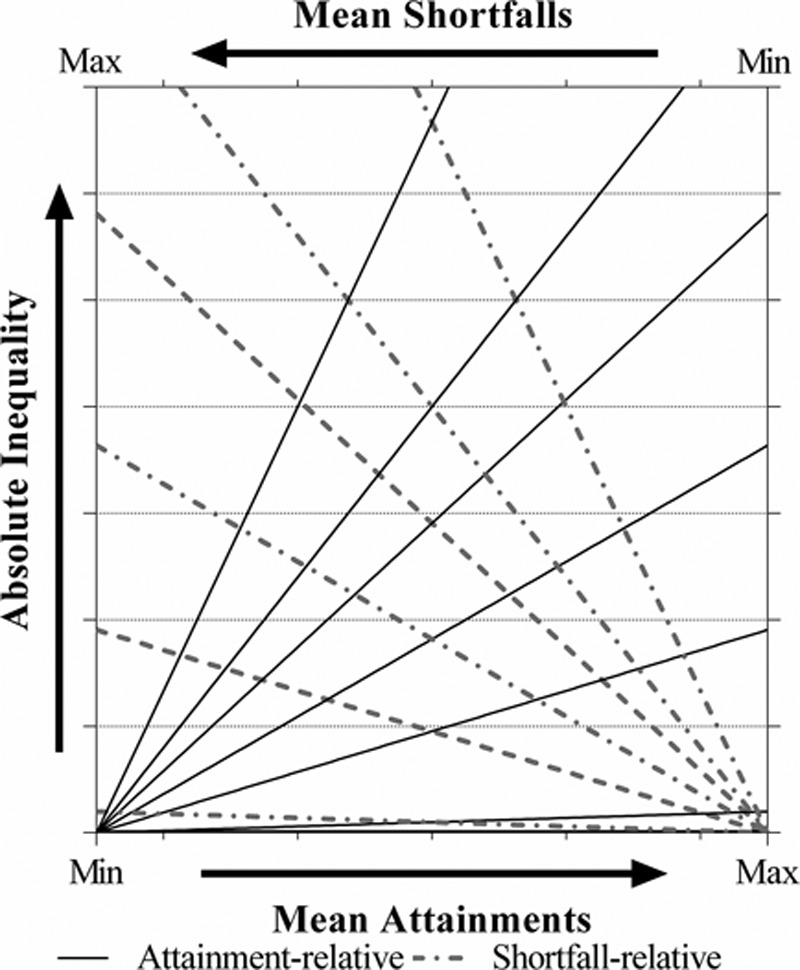
A generalized graph for simultaneously presenting shortfall-relative, absolute, and attainment-relative inequality. This figure is a generalized graph plotting the absolute inequality against the mean health, measured as shortfalls from the right to the left and as attainments from the left to the right. The straight lines starting at the left origin represent different level of attainment-relative inequality and the straight lines starting at the right origin represent different levels of shortfall-relative inequality: the steeper the ray, the higher the level of inequality. For applications using this structure see eFigures 1 and 2 in the online material (http://links.lww.com/EDE/A925).
When plotting the populations onto this general graph, most applications will “zoom in” on a relevant area, which will vary depending on the populations’ average health levels. (eFigures 1 and 2 in the online material present two examples; http://links.lww.com/EDE/A925). Clearly, the location on the general graph affects the slope of the lines representing the shortfall-relative and attainment-relative inequality. For example, the comparably flat attainment-relative line in Figure 4 is due its location in the very bottom right corner.
Graphs such as Figures 4, 5, and 6 simultaneously present the reader with the shortfall-relative, absolute, and attainment-relative inequality, along with an improved understanding of how these measures relate by illustrating their ordering. Consequently, the graphs help inform readers about the nature of the differences in inequality between these countries and provide an intuition about how the two bounds of the health variable complicates relative inequality measures. One could also consider possible value judgments, other than the absolute, in between the attainments-relative and the shortfalls-relative IEC.31,34,38–40 We briefly discuss these more complicated measures in eAppendix B (http://links.lww.com/EDE/A925).
GENERAL ADVICE TO APPLIED RESEARCHERS
Applied researchers and policymakers will always ask which inequality measure is the most appropriate. Disappointingly, we do not point to one specific superior measure as different people will hold different viewpoints and there is limited understanding about the public’s preferences regarding inequality.24 The recent economic literature strengthens the conclusion from the epidemiologic literature: Researchers must not hide their head in the sand, but seriously consider the implicit value judgments behind these measures. This article further illustrates how this is even more important for health variables with two bounds.
In the previous debate, King et al.9 and Asada8 essentially agree on the sensibility of using both relative and absolute measures to present a fuller picture. For variables with two bounds, however, to avoid the risk, or suspicion, that a perspective—shortfalls or attainment—is chosen because the results are more favorable (in some dimension), we suggest that researchers present all three; attainment-relative, absolute, and shortfall-relative measures. We have shown how combining the three different value judgments onto a single graph may help facilitate our understanding of how they relate to each other. Such a graph also shows how these measures provide ethical benchmarks against which to judge the difference in inequality between populations. In particular it allows us to consider the distribution of health improvements that would be needed to make one population less unequal than another. Improving people’s understanding of the value judgments embedded within measures will minimize the chance that researchers mislead or policymakers are misled.
ACKNOWLEDGMENTS
We thank Gawain Heckley and three anonymous referees for useful comments on previous versions of this article.
Supplementary Material
Footnotes
Editors’ note: a commentary on this article appears on page 670.
Kjellsson and Gerdtham received funding from the Swedish Council for Working Life and Social Research (FAS; dnr 2012-0419), and Kjellsson also gratefully acknowledges funding from the Foundation in memory of Pontus Roos.
This research was supported under Australian Research Council’s Discovery Early Career Awards funding scheme (Project DE150100309). The views expressed herein are those of the authors and are not necessarily those of the Australian Research Council.
The authors report no conflicts of interest.
Supplemental digital content is available through direct URL citations in the HTML and PDF versions of this article (www.epidem.com). This content is not peer-reviewed or copy-edited; it is the sole responsibility of the authors.
REFERENCES
- 1.Mackenbach JP, Stirbu I, Roskam AJ, et al. European Union Working Group on Socioeconomic Inequalities in Health. Socioeconomic inequalities in health in 22 European countries. N Engl J Med. 2008;358:2468–2481. doi: 10.1056/NEJMsa0707519. [DOI] [PubMed] [Google Scholar]
- 2.Vandenheede H, Vikhireva O, Pikhart H, et al. Socioeconomic inequalities in all-cause mortality in the Czech Republic, Russia, Poland and Lithuania in the 2000s: findings from the HAPIEE Study. J Epidemiol Community Health. 2014;68:297–303. doi: 10.1136/jech-2013-203057. [DOI] [PMC free article] [PubMed] [Google Scholar]
- 3.van Doorslaer E, Koolman X. Explaining the differences in income-related health inequalities across European countries. Health Econ. 2004;13:609–628. doi: 10.1002/hec.918. [DOI] [PubMed] [Google Scholar]
- 4.Wagstaff A. Inequality aversion, health inequalities and health achievement. J Health Econ. 2002;21:627–641. doi: 10.1016/s0167-6296(02)00006-1. [DOI] [PubMed] [Google Scholar]
- 5.Harper S, Lynch J. Measuring health inequalities. Methods Soc Epidemiol. 2006;1:134. [Google Scholar]
- 6.Harper S, King NB, Meersman SC, Reichman ME, Breen N, Lynch J. Implicit value judgments in the measurement of health inequalities. Milbank Q. 2010;88:4–29. doi: 10.1111/j.1468-0009.2010.00587.x. [DOI] [PMC free article] [PubMed] [Google Scholar]
- 7.Speybroeck N, Harper S, de Savigny D, Victora C. Inequalities of health indicators for policy makers: six hints. Int J Public Health. 2012;57:855–858. doi: 10.1007/s00038-012-0386-5. [DOI] [PubMed] [Google Scholar]
- 8.Asada Y. On the choice of absolute or relative inequality measures. Milbank Q. 2010;88:616–622. doi: 10.1111/j.1468-0009.2010.00614.x. discussion 623. [DOI] [PMC free article] [PubMed] [Google Scholar]
- 9.King NB, Harper S, Meersman SC, Reichman ME, Breen N, Lynch J. We’ll take the red pill: a reply to Asada. Milbank Q. 2010;88:623–627. doi: 10.1111/j.1468-0009.2010.00587.x. [DOI] [PMC free article] [PubMed] [Google Scholar]
- 10.Frank J, Haw S. Best practice guidelines for monitoring socioeconomic inequalities in health status: lessons from Scotland: monitoring socioeconomic inequalities in health status. Milbank Q. 2011;89:658–693. doi: 10.1111/j.1468-0009.2011.00646.x. [DOI] [PMC free article] [PubMed] [Google Scholar]
- 11.Harper S, King NB. Commentary: best practice for what? Milbank Q. 2013;91:205–209. doi: 10.1111/milq.12009. [DOI] [PMC free article] [PubMed] [Google Scholar]
- 12.McCartney G, Leyland AH, Fischbacher CM, Whyte B, Walsh D, Stockton DL. Commentary: long-term monitoring of health inequalities in Scotland–a response to Frank and Haw. Milbank Q. 2013;91:186–191. doi: 10.1111/milq.12006. [DOI] [PMC free article] [PubMed] [Google Scholar]
- 13.Allanson P, Petrie D. On the choice of health inequality measure for the longitudinal analysis of income-related health inequalities. Health Econ. 2013;22:353–365. doi: 10.1002/hec.2803. [DOI] [PMC free article] [PubMed] [Google Scholar]
- 14.Allanson P, Petrie D. Understanding the vertical value equity judgements underpinning health inequality measures. Health Econ. 2014;23:1390–1396. doi: 10.1002/hec.2984. [DOI] [PubMed] [Google Scholar]
- 15.Erreygers G. Correcting the concentration index. J Health Econ. 2009;28:504–515. doi: 10.1016/j.jhealeco.2008.02.003. [DOI] [PubMed] [Google Scholar]
- 16.Erreygers G. Correcting the concentration index: a reply to Wagstaff. J Health Econ. 2009;28:521–524. doi: 10.1016/j.jhealeco.2008.02.003. [DOI] [PubMed] [Google Scholar]
- 17.Erreygers G, Van Ourti T. Measuring socioeconomic inequality in health, health care and health financing by means of rank-dependent indices: a recipe for good practice. J Health Econ. 2011;30:685–694. doi: 10.1016/j.jhealeco.2011.04.004. [DOI] [PMC free article] [PubMed] [Google Scholar]
- 18.Erreygers G, Van Ourti T. Putting the cart before the horse. A comment on Wagstaff on inequality measurement in the presence of binary variables. Health Econ. 2011;20:1161–1165. doi: 10.1002/hec.1754. [DOI] [PMC free article] [PubMed] [Google Scholar]
- 19.Wagstaff A. Correcting the concentration index: a comment. J Health Econ. 2009;28:516–520. doi: 10.1016/j.jhealeco.2008.12.003. author reply 521. [DOI] [PubMed] [Google Scholar]
- 20.Wagstaff A. The concentration index of a binary outcome revisited. Health Econ. 2011;20:1155–1160. doi: 10.1002/hec.1752. [DOI] [PubMed] [Google Scholar]
- 21.Wagstaff A. Reply to Guido Erreygers and Tom Van Ourti’s comment on “The concentration index of a binary outcome revisited.”. Health Econ. 2011;20:1166–1168. doi: 10.1002/hec.1753. [DOI] [PubMed] [Google Scholar]
- 22.Kjellsson G, Gerdtham UG. On correcting the concentration index for binary variables. J Health Econ. 2013;32:659–670. doi: 10.1016/j.jhealeco.2012.10.012. [DOI] [PubMed] [Google Scholar]
- 23.Harper S, Lynch J, Meersman SC, Breen N, Davis WW, Reichman ME. An overview of methods for monitoring social disparities in cancer with an example using trends in lung cancer incidence by area-socioeconomic position and race-ethnicity, 1992–2004. Am J Epidemiol. 2008;167:889–899. doi: 10.1093/aje/kwn016. [DOI] [PMC free article] [PubMed] [Google Scholar]
- 24.Gakidou E, Murray CJL, Frenk J, Gakidou E, Murray CJL, Frenk J. 2000. Measuring Preferences on Health System Performance Assessment. Available at: http://www.who.int/healthinfo/paper20.pdf. Accessed September 9, 2010. Global Programme on Evidence for Health Policy Discussion Paper (20). Available at: http://www.who.int/healthinfo/paper20.pdf. Accessed September 25, 2013.
- 25.Pamuk ER. Social class inequality in mortality from 1921 to 1972 in England and Wales. Popul Stud. 1985;39:17–31. doi: 10.1080/0032472031000141256. [DOI] [PubMed] [Google Scholar]
- 26.Mackenbach JP, Kunst AE. Measuring the magnitude of socio-economic inequalities in health: an overview of available measures illustrated with two examples from Europe. Soc Sci Med. 1997;44:757–771. doi: 10.1016/s0277-9536(96)00073-1. [DOI] [PubMed] [Google Scholar]
- 27.Wagstaff A, Paci P, van Doorslaer E. On the measurement of inequalities in health. Soc Sci Med. 1991;33:545–557. doi: 10.1016/0277-9536(91)90212-u. [DOI] [PubMed] [Google Scholar]
- 28.Murray CJ, Vos T, Lozano R, et al. Disability-adjusted life years (DALYs) for 291 diseases and injuries in 21 regions, 1990-2010: a systematic analysis for the Global Burden of Disease Study 2010. Lancet. 2012;380:2197–2223. doi: 10.1016/S0140-6736(12)61689-4. [DOI] [PubMed] [Google Scholar]
- 29.Hosseinpoor AR, Harper S, Lee JH, Lynch J, Mathers C, Abou-Zahr C. International shortfall inequality in life expectancy in women and in men, 1950-2010. Bull World Health Organ. 2012;90:588–594. doi: 10.2471/BLT.11.097378. [DOI] [PMC free article] [PubMed] [Google Scholar]
- 30.Clarke PM, Gerdtham UG, Johannesson M, Bingefors K, Smith L. On the measurement of relative and absolute income-related health inequality. Soc Sci Med. 2002;55:1923–1928. doi: 10.1016/s0277-9536(01)00321-5. [DOI] [PubMed] [Google Scholar]
- 31.Wagstaff A. The bounds of the concentration index when the variable of interest is binary, with an application to immunization inequality. Health Econ. 2005;14:429–432. doi: 10.1002/hec.953. [DOI] [PubMed] [Google Scholar]
- 32.King NB, Harper S, Young ME. Use of relative and absolute effect measures in reporting health inequalities: structured review. BMJ. 2012;345:e5774. doi: 10.1136/bmj.e5774. [DOI] [PMC free article] [PubMed] [Google Scholar]
- 33.Lambert P, Zheng B. On the consistent measurement of attainment and shortfall inequality. J Health Econ. 2011;30:214–219. doi: 10.1016/j.jhealeco.2010.10.008. [DOI] [PubMed] [Google Scholar]
- 34.Kjellsson G, Gerdtham U-G. Research on Economic Inequality. Vol 21. Bingley, England: Emerald Group Publishing; 2013. Lost in translation: rethinking the inequality equivalence criteria for bounded health variables. pp. 3–32. Available at: http://www.emeraldinsight.com/10.1108/S1049-2585(2013)0000021002. Accessed May 21, 2014. [Google Scholar]
- 35.Marmot M, Allen J, Goldblatt P, et al. Fair society, healthy lives: strategic review of health inequalities in England post-2010. 2010. Available at: http://www.marmotreview.org. Accessed December 4, 2014. [Google Scholar]
- 36.Allanson P, Gerdtham UG, Petrie D. Longitudinal analysis of income-related health inequality. J Health Econ. 2010;29:78–86. doi: 10.1016/j.jhealeco.2009.10.005. [DOI] [PubMed] [Google Scholar]
- 37.Petrie D, Allanson P, Gerdtham UG. Accounting for the dead in the longitudinal analysis of income-related health inequalities. J Health Econ. 2011;30:1113–1123. doi: 10.1016/j.jhealeco.2011.07.004. [DOI] [PMC free article] [PubMed] [Google Scholar]
- 38.Kolm S.-C. Unequal inequalities. IJ Econ Theory. 1976;12:416–442. [Google Scholar]
- 39.Lasso de la Vega C, Aristondo O. Proposing indicators to measure achievement and shortfall inequality consistently. J Health Econ. 2012;31:578–583. doi: 10.1016/j.jhealeco.2012.02.006. [DOI] [PubMed] [Google Scholar]
- 40.Zheng B. Unit-consistent decomposable inequality measures. Economica. 2007;74:97–111. [Google Scholar]


