

Abstract
Proximal spinal muscular atrophy (SMA) is an early-onset motor neuron disease characterized by loss of α-motor neurons and associated muscle atrophy. SMA is caused by deletion or other disabling mutation of survival motor neuron 1 (SMN1). In the human genome, a large duplication of the SMN-containing region gives rise to a second copy of this gene (SMN2) that is distinguishable by a single nucleotide change in exon 7. Within the SMA population, there is substantial variation in SMN2 copy number; in general, those individuals with SMA who have a high SMN2 copy number have a milder disease. Because SMN2 functions as a disease modifier, its accurate copy number determination may have clinical relevance. In this study, we describe the development of an assay to assess SMN1 and SMN2 copy numbers in DNA samples using an array-based digital PCR (dPCR) system. This dPCR assay can accurately and reliably measure the number of SMN1 and SMN2 copies in DNA samples. In a cohort of SMA patient-derived cell lines, the assay confirmed a strong inverse correlation between SMN2 copy number and disease severity. Array dPCR is a practical technique to determine, accurately and reliably, SMN1 and SMN2 copy numbers from SMA samples.
Keywords: Array digital PCR, copy number, copy number variation, SMN1, SMN2, spinal muscular atrophy
Introduction
Spinal muscular atrophy (SMA; OMIM #253300) is an early-onset neurodegenerative disease characterized by the loss of α-motor neurons (MNs) in the anterior horn of the spinal cord (Crawford and Pardo, 1996). This loss of α-MNs is associated with muscle weakness and atrophy. SMA is an autosomal recessive disease and is a leading genetic cause of infant death worldwide with an incidence of 1 in 6000–10,000 births (Pearn, 1978; Cuscó et al., 2002). The carrier frequency for SMA is 1:25–50 in most populations (Ben-Shachar et al., 2011; Su et al., 2011; Sugarman et al., 2012; Lyahyai et al., 2012) though it is lower for some ethnicities (Zaldívar et al., 2005; Labrum et al., 2007; Hendrickson et al., 2009; Sangaré et al., 2014). SMA results from the loss or mutation of SMN1 (survival motor neuron 1; OMIM #600354) on chromosome 5q13 (Lefebvre et al., 1995). In humans, a large tandem chromosomal duplication has lead to a second SMN2 copy of the gene (OMIM #601627). SMN2 can be distinguished from SMN1 by a single-nucleotide difference (c.850C>T) at the outset of exon 7 that disrupts an exonic splice enhancer (Lorson et al., 1999; Monani et al., 1999). As a result, most of SMN2 mRNAs (about 80–90%) lack exon 7 (SMNΔ7) and produce a protein that is both unstable and less than fully functional (Lorson and Androphy, 2000; Burnett et al., 2009). With just 10–20% of the SMN2 gene product full length and functional, increasing number of SMN2 partially complements loss of SMN1 with diminished severity of the phenotype (Coovert et al., 1997; Lefebvre et al., 1997; McAndrew et al., 1997; Prior et al., 2005; Swoboda et al., 2005; Wirth et al., 2006; Tiziano et al., 2007; Elsheikh et al., 2009). The capacity of SMN2 copy number to modulate phenotype has been extended to transgenic mouse models (Monani et al., 2000; Hsieh-Li et al., 2000; Michaud et al., 2010).
Because SMN2 copy number influences disease severity in SMA, there is prognostic value in accurate measurement of SMN2 copy number from patients being evaluated for SMA. Molecular diagnosis of SMA—that is, loss of SMN1—has historically been made using a polymerase chain reaction (PCR)-based assay followed by digestion of the PCR product with specific restriction endonucleases (Lefebvre et al., 1995; van der Steege et al., 1995). Numerous assays have been developed to quantify SMN2 copy number in DNA samples from SMA patients. These assays include radioactive PCR (Coovert et al., 1997), quantitative—or real-time PCR (qPCR)––(Feldkötter et al., 2002; Anhuf et al., 2003; Gómez-Curet et al., 2007), competitive PCR/primer extension (Gérard et al., 2004), denaturing high-performance liquid chromatography (Su et al., 2005), multiplex ligation-dependent probe amplification (Huang et al., 2007), quantitative capillary electrophoresis fragment analysis (QCEFA, Kirwin et al., 2013) and short-amplicon melt profiling (Dobrowolski et al., 2012). An important limitation of these established PCR-based copy number assays is the requirement for a parallel-run calibration curve to assign a breakpoint necessary that identifies placement of an ordinal SMN2 value.
Digital PCR (dPCR) offers a means of measuring the abundance of a target molecule quantitatively without the need for a calibration curve. In dPCR, the template DNA is distributed across a large number of partitions by limited dilution (Sykes et al., 1992; Vogelstein and Kinzler, 1999). As a result, some of the partitions will lack the template DNA and, as such, will not amplify the target molecule during PCR. By counting the number of partitions containing the amplified target PCR product (positive partitions) and the number of negative partitions, the absolute abundance of the target molecule can be measured in a sample. There are currently two platforms for dPCR—microfluidics and microdroplet emulsion (Day et al., 2013). Zhong et al. (2011) show in a pilot study that droplet dPCR can be used to measure SMN2 copy number in a small number (n = 4) of SMA samples. We demonstrate here the feasibility of using an array dPCR system containing 20,000 partitions in determining the number of copies of SMN1 and SMN2 in DNA samples and show that there is a strong correlation between SMN2 copy number and SMA disease severity.
Materials and Methods
Ethics statement
Fibroblast lines generated at the Nemours/Alfred I. duPont Hospital for Children (N/AIDHC) were established following a protocol approved by the N/AIDHC Institutional Review Board, obtained following written informed consent or assent. The cell lines were de-identified so that no protected health information related to these cell lines is known.
Cell lines
Fibroblast and lymphoblastoid cell lines (LCLs) were either established at N/AIDHC using standard procedures (Villegas and McPhaul, 2005) or obtained from Johns Hopkins University (T. O. C.; Baltimore, MD), the University of Utah (K. J. S.; Salt Lake City, UT) or a cell line repository. Some of the fibroblast lines established at N/AIDHC were obtained from the Molecular Diagnostics Laboratory, while others were established in the Motor Neuron Diseases Research Laboratory from skin samples obtained from the MDA Neuromuscular Clinic or the Nemours Biobank. The following cell lines were obtained from Coriell Cell Repositories (Camden, NJ): GM00232, GM00409, GM00489, GM03813, GM03814, GM03815, GM09677, GM10684, GM22592, GM23255, GM23603, GM23686, GM23687, GM23688 and GM23689. Fibroblast lines UMB-1897, UMB-4648 and UMB-4994 were obtained from the NICHD Brain and Tissue Bank for Developmental Disorders at the University of Maryland (Baltimore, MD). The number of cell lines obtained from non-SMA and SMA patients with varying degrees of disease severity is shown in Table1.
Table 1.
Clinical information related to the cell lines used in this study
| SMA I | SMA II | SMA III | Unknown SMA | Non-SMA | |
|---|---|---|---|---|---|
| Cell lines | |||||
| Fibroblasts | 24 | 25 | 10 | 0 | 34 |
| LCLs | 0 | 0 | 1 | 3 | 3 |
| Total | 24 | 25 | 11 | 3 | 37 |
| Sex | |||||
| Male | 14 | 16 | 9 | 2 | 19 |
| Female | 10 | 9 | 2 | 1 | 18 |
All fibroblast lines were maintained in Dulbecco’s modified essential medium (DMEM; Life Technologies, Grand Island, NY) containing 10% fetal bovine serum (FBS; Atlas Biologicals, Fort Collins, CO), 2 mmol/L l-glutamine (Life Technologies) and 1% penicillin/streptomycin (Life Technologies). All LCLs were maintained in RPMI-1640 (Life Technologies) containing 15% FBS, 2 mmol/L l-glutamine and 1% penicillin/streptomycin.
Genomic DNA isolation
Genomic DNA (gDNA) was isolated from fibroblast and LCL cell pellets, using the Gentra Puregene Cell Kit (QIAGEN, Germantown, MD). The pellets were disrupted in 500–1500 μL cell lysis solution depending on the pellet size. The cells were lysed overnight at room temperature in a 15-mL conical tube and then divided in 500-μL aliquots. RNase A Solution (2.5 μL) was added to each aliquot and incubated for 5–60 min at 37°C water bath for five minutes. After chilling the digested aliquots on ice, 165 μL Protein Precipitation Solution was added to each aliquot, vortexed vigorously for 20 sec and then centrifuged for 1 min at 16,000 g. The supernatant was then transferred to a clean microcentrifuge tube containing 500 μL 2-propanol. The samples were inverted 50 times to facilitate precipitation of DNA and then centrifuged for 1 min at 16,000 g. After the supernatant was discarded, the DNA pellet was washed with 500 μL 70% ethanol and centrifuged for 1 min at 16,000 g. The DNA pellets were allowed to air dry for 10 min. After drying, they were re-suspended in 25 μL DNA Hydration Solution and incubated for 60 min at 65°C overnight at room temperature on an orbital shaker. The concentration of the purified gDNA was determined by an ND-2000C NanoDrop spectrophotometer (Thermo Fisher Scientific, Waltham, MA). The integrity of the gDNA was verified by agarose gel electrophoresis.
Primers and probes
For SMN1 and SMN2 copy number determination, the following primers were used (Anhuf et al., 2003): SMN1-Ex7-261R (5′-CCTTAATTTAAGGAATGTGAGCACC-3′) and SMN1-Ex7-116F (5′-AATGCTTTTTAACATCCATATAAAGCT-3′). 6-Carboxyfluorescein (6FAM)-labeled probe oligonucleotides with minor groove binder non-fluorescent quenchers (MGBNFQ) were used to measure SMN1 [SMN1-Ex7-206T (5′-6FAM-CAGGGTTTCAGACAAA-MGBNFQ-3′)] or SMN2 [SMN2-Ex7-anti (5′-6FAM-TGATTTTGTCTAAAACCC-MGBNFQ-3′)] signals (the underlined nucleotides are specific for SMN1 or SMN2) (Anhuf et al., 2003). These primers were synthesized by Life Technologies. The primers and 4,7,2′-trichloro-7′-phenyl-6-carboxyfluorescein (VIC)-labeled probe for RNase P (RPPH1; OMIM #608513) were obtained from the TaqMan™ Copy Number Reference Assay RNase P (Life Technologies). [Corrections added on 13 April 2015, after first online publication: ‘6-Carboxyfluorescein (6FAM)-labeled probe oligonucleotides were used to measure SMN1 [SMN1-Ex7-206T (5′-6FAM-CAGGGTTTCAGACAAA-3′)] or SMN2 [SMN2-Ex7-anti (5′-6FAM-TGATTTTGTCTAAAACCC-3′)] signals (the underlined nucleotides are specific for SMN1 or SMN2) (Anhuf et al., 2003)’ has been corrected to ‘6-Carboxyfluorescein (6FAM)-labeled probe oligonucleotides with minor groove binder non-fluorescent quenchers (MGBNFQ) were used to measure SMN1 [SMN1-Ex7-206T (5′-6FAM-CAGGGTTTCAGACAAA-MGBNFQ-3′)] or SMN2 [SMN2-Ex7-anti (5′-6FAMTGATTTTGTCTAAAACCC-MGBNFQ-3′)] signals (the underlined nucleotides are specific for SMN1 or SMN2) (Anhuf et al., 2003)’.]
For Sanger sequencing of SMN, the following primers were used: SMN-SEQ7F (5′-CAAAATGCTTTTTAACATCCATATAA-3′) (Vezain et al., 2010), SMN-SEQ7R (5′-AAACATTTGTTTTCCACAAACC-3′) (Vezain et al., 2010), SMNaf (5′-TGCGCATCCGCGGGTTTGCT-3′) (Parsons et al., 1998) and SMNcr (5′-TCATTTAGTGCTGCTCTATGCCA-3′) (Parsons et al., 1998). These sequencing primers were synthesized by Integrated DNA Technologies, Inc. (Coralville, IA).
SMN sequencing
To determine if each sample contained SMN1 and/or SMN2, exon 7 of SMN was amplified by PCR, using SMN-SEQ7F and SMN-SEQ7R as primers (Vezain et al., 2010). The PCR conditions were as follows: 5 min 96°C followed by 40 cycles of 30 sec 96°C, 30 sec 56°C and 1 min 72°C followed by a final extension step for 7 min at 72°C. The PCR product was purified using the Wizard SV Gel and PCR Cleanup System (Promega, Madison, WI) according to manufacturer’s directions. The purified PCR product was sequenced with the ABI 3130xl Genetic Analyzer (Life Technologies) automated sequencer, using the BigDye Terminator v3.1 Cycle Sequencing kit (Life Technologies).
SMN1 and SMN2 copy number assays
The copy numbers of SMN1 and SMN2 were measured in each gDNA sample using the QuantStudio™ 3D Digital PCR System (Life Technologies). Figure1 shows the workflow of the SMN1/SMN2 copy number assays. The concentration of double-stranded DNA (dsDNA) was measured from each sample using the Qubit™ dsDNA Broad Range Assay kit (Life Technologies). 400 ng dsDNA was digested with 20 U EcoRI (New England Biolabs, Inc., Ipswitch, MA) for 60 min at 37°C. After thermal denaturation (20 min at 65°C), the digest DNA was diluted fourfold with nuclease-free ddH2O.
Figure 1.
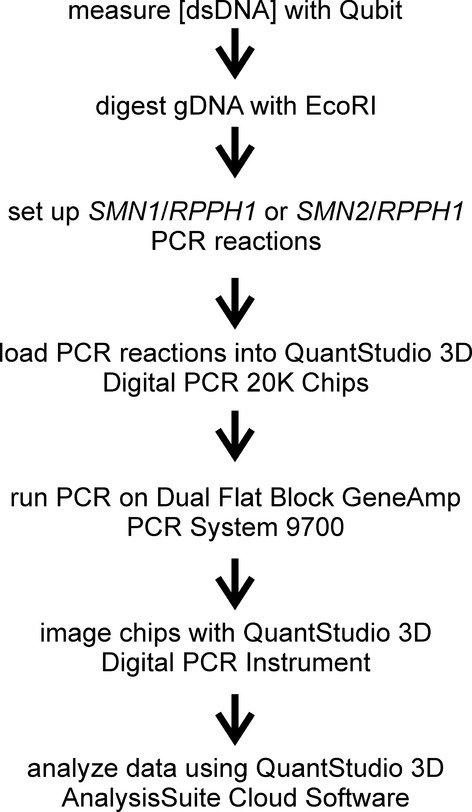
Workflow for SMN1/SMN2 copy number assays, using the QuantStudio 3D array dPCR system.
RPPH1 and either SMN1 or SMN2 signals were amplified in each PCR reaction. Each PCR reaction contains 30–60 ng EcoRI-digested gDNA, RPPH1 primer/probe mix (1×), SMN1/SMN2 primer probe mix (900 nmol/L SMN1-Ex7-116F, 900 nmol/L SMN1-Ex7-261R, 200 nmol/L either SMN1-Ex7-206T or SMN2-Ex7-anti) and QuantStudio™ 3D Digital PCR Master Mix. Each PCR reaction was then loaded into a QuantStudio™ 3D Digital PCR 20K chip according to manufacturer’s directions. The chips were then loaded onto the Dual Flat Block GeneAmp™ PCR System 7900 and PCR was performed using the following conditions: 10 min at 96°C followed by 39 cycles of 2 min at 60°C, and 30 sec at 98°C followed by 2 min at 60°C. 6FAM and VIC images from each chip were then taken with the QuantStudio™ 3D Instrument which provided the copies of SMN1 (or SMN2)/μL (6FAM) and of RPPH1/μL (VIC). The raw data were subsequently analyzed using the QuantStudio™ 3D AnalysisSuite Cloud Software. The copy number of SMN1 or SMN2 was calculated with the following equation:
Statistical analysis
The coefficient of variation (CV) was used to measure the reliability of the QuantStudio™ 3D dPCR assay (Gómez-Curet et al., 2007). The CV is defined as the standard deviation (SD) of the copy number divided by the mean copy number for all subjects with the same copy number. Spearman’s correlation analysis (r) was used to determine the relationship between SMN2 copy number and disease severity in the SMA samples. All statistical analyses were performed with SPSS v.22.0 (IBM, Armonk, NY).
Results
We measured the number of SMN1 and SMN2 copies in gDNAs isolated from cell lines derived from SMA patients as well as from healthy non-SMA subjects using array dPCR (Fig.1). SMN1 or SMN2 dPCR was multiplexed with RPPH1 because the copy number of RPPH1 does not vary amongst the human population (Baer et al., 1990). The gDNA templates were digested with EcoRI prior to PCR amplification as there are no EcoRI restriction sites within the SMN1, SMN2 or RPPH1 regions of amplification. The array dPCR assay detected accurately and reproducibly from 0 to 3 copies of SMN1 and 0 to 5 copies of SMN2 in the analyzed samples.
The assay conditions were first tested on SMN1 and SMN2 reference standards (n = 7) obtained from the Clinical Laboratory Improvement Amendments (CLIA)-certified Molecular Diagnostics Laboratory at N/AIDHC. These standards were generated from genomic DNA extracted from blood specimens, with copy numbers assessed by QCEFA (Kirwin et al., 2013). One of these reference samples (SDC1) could not be accurately accessed for SMN2 copy number using QCEFA. Blinded array dPCR determination of SMN1 and SMN2 copy numbers in the reference samples matched that obtained by QCEFA (Table2). Of interest, sample SDC1 measurements fell well within the detection capability of array dPCR and this sample carried 4 copies of SMN2.
Table 2.
Comparison of SMN1 and SMN2 copy numbers measured by quantitative capillary electrophoresis fragment analysis (QCEFA) and by array dPCR
| Sample | QCEFA | Array dPCR | ||
|---|---|---|---|---|
| SMN1 | SMN2 | SMN1 | SMN2 | |
| SDC1 | 0 | ≥4 | 0 | 4 |
| SDC2 | 1 | 3 | 1 | 3 |
| SDC3 | 2 | 1 | 2 | 1 |
| SDC4 | 2 | 2 | 2 | 2 |
| SDC5 | 1 | 1 | 1 | 1 |
| SDC6 | 0 | 3 | 0 | 3 |
| SDC7 | 1 | 1 | 1 | 1 |
This validation phase also included a comparison between array dPCR and real-time TaqMan™ qPCR (qPCR). The SMN2 copy numbers for a subset of our SMA samples (n = 30) were determined previously (Gómez-Curet et al., 2007). We saw good concordance between the 2 techniques for samples carrying low SMN2 copy number (i.e., ≤2 copies); however, the concordance dropped to 80% (12/15) for samples carrying higher SMN2 copy numbers (Fig.2). This result highlights the inability of TaqMan™ qPCR to accurately measure copy numbers greated than 3 (Gómez-Curet et al., 2007; Prior et al., 2011). To test the upper limit of detection for this new assay, we used gDNA from a set of 4 SMA (GM00232, GM03813, GM09677, and GM10684) and 1 carrier (GM03814) Coriell Cell Repositories cell lines that were shown to contain 2, 3, 3, 2, and 5 SMN2 copies, respectively, using droplet dPCR (Zhong et al., 2011). Our copy number measurements were in complete concordance with the published droplet dPCR results, most notably for GM03814 which carried a high copy number of SMN2.
Figure 2.
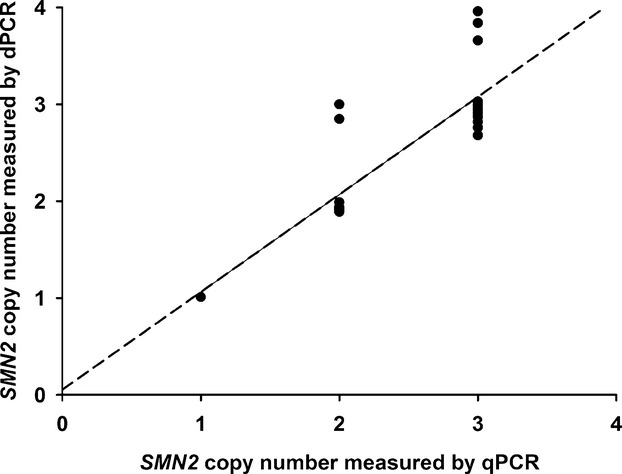
Comparison of SMN2 copy number in SMA samples determined by qPCR to that by array dPCR. The dashed line represents the linear relationship between SMN2 copy number determined by TaqMan™ qPCR (Gómez-Curet et al., 2007) and that determined by array dPCR.
To determine the reliability of the array dPCR copy number assays, the mean CV was calculated for each SMN1 and SMN2 copy number measurement for both the SMA (Table3) and non-SMA (Table4) samples derived from cell lines (Gómez-Curet et al., 2007). In both SMA and non-SMA samples, the CVs for each SMN1 and SMN2 copy numbers were below 4% demonstrating that our array dPCR copy number assays were reliable.
Table 3.
Coefficient of variation (CV) measurements for SMN2 copy numbers in SMA patient samples
| SMA phenotypic grade | Expected copy number | Measured copy number (mean ± SD) | CV |
|---|---|---|---|
| Type I | 2 | 1.939 ± 0.046 | 0.024 |
| 3 | 2.925 ± 0.106 | 0.036 | |
| Type II | 1 | 1.180 | – |
| 2 | 1.930 | 0.000 | |
| 3 | 2.891 ± 0.106 | 0.037 | |
| 4 | 3.860 | – | |
| Type III | 1 | 1.010 | – |
| 3 | 2.923 ± 0.061 | 0.021 | |
| 4 | 3.884 ± 0.102 | 0.026 | |
| Unknown | 2 | 1.900 ± 0.071 | 0.037 |
| 3 | 2.820 | – |
Table 4.
Coefficient of variation (CV) measurements for SMN1 and SMN2 copy numbers in non-SMA samples
| Gene | Expected copy number | Measured copy number (mean ± SD) | CV |
|---|---|---|---|
| SMN1 | 1 | 0.972 ± 0.016 | 0.017 |
| 2 | 1.926 ± 0.053 | 0.027 | |
| 3 | 2.905 ± 0.069 | 0.024 | |
| SMN2 | 0 | 0.00 | – |
| 1 | 0.991 ± 0.028 | 0.032 | |
| 2 | 1.930 ± 0.072 | 0.037 | |
| 3 | 2.840 ± 0.046 | 0.016 | |
| 5 | 4.72 | – |
Using these assay conditions, we determined the copy numbers of SMN1 and SMN2 for all of the cell lines within our collection. Our collection contained both fibroblasts and Epstein–Barr virus (EBV) immortalized LCLs. One hundred cell lines—63 of which were derived from SMA patients—were used in this study (Table1). All but one of the 63 SMA DNA samples had a loss of both SMN1 alleles as determined by using Sanger sequencing. The remaining cell line harbored one deletion allele and one missense mutation in SMN1 (c.38C>G; SMN1p.A2G). Most of the SMA samples contained 2 or 3 copies of SMN2 (Fig.3A). For those SMA patients harboring deletions of SMN1 and whose disease severities were known (n = 59), patients with higher SMN2 copy numbers (i.e., 3 or 4) had milder disease severities than those patients with fewer copies of SMN2 (i.e., 2; Fig.3B). In fact, there was a strong, negative correlation between SMN2 copy number and SMA disease severity within this group (r = 0.830, P < 0.001).
Figure 3.
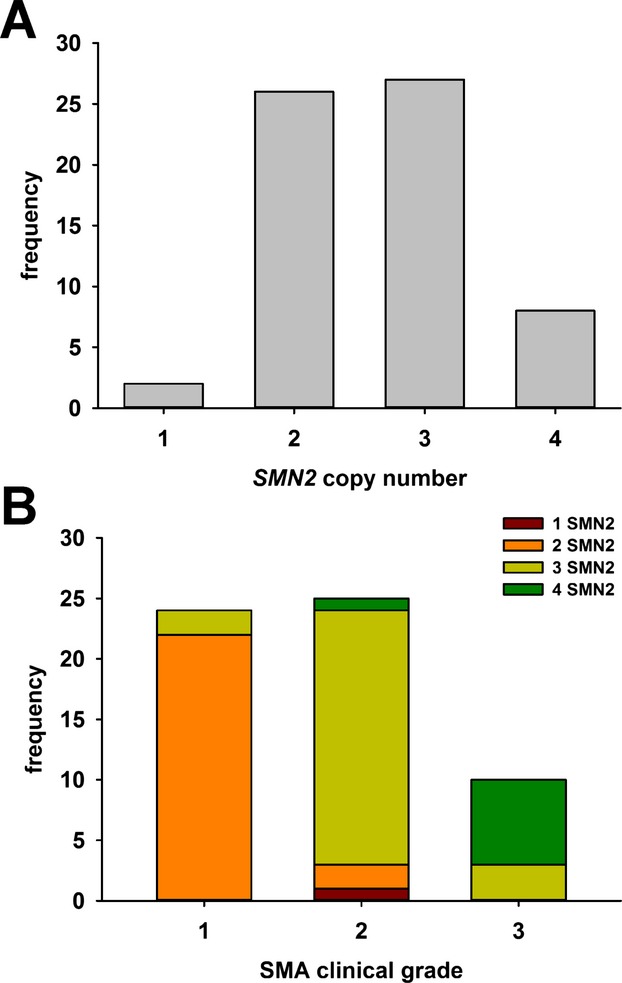
SMN2 copy number in SMA samples. (A) Distribution of SMN2 copy number in the SMA patient samples (n = 60). (B) Relationship between SMN2 copy number and disease severity in SMN1-deleted SMA samples (n = 59). Each bar represents a clinical grade of SMA. The distribution of SMN2 copy numbers (1 SMN2, red; 2 SMN2, orange; 3 SMN2, yellow and 4 SMN2, green) within each clinical grade is shown within each bar.
In the non-SMA samples, we found variation in both SMN1 and SMN2 copy numbers (1–3 copies for SMN1 and 0–5 copies for SMN2; Fig.4). The most common SMN1:SMN2 copy number combination observed within our population was 2:2; this combination has been observed in other studies as well (Anhuf et al., 2003; Gérard et al., 2004; Pyatt and Prior, 2006; Gómez-Curet et al., 2007).
Figure 4.
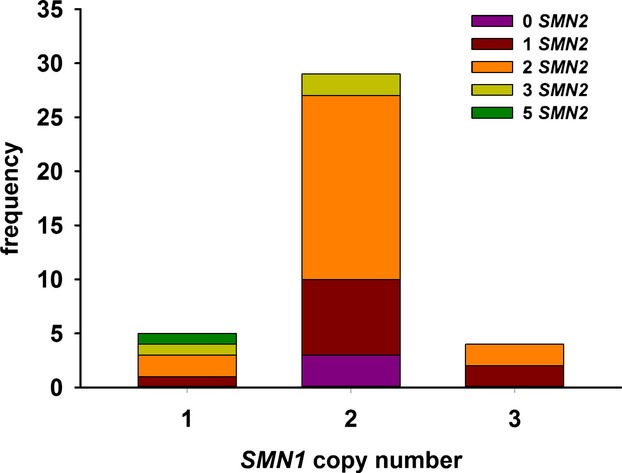
SMN1 and SMN2 copy numbers in non-SMA samples. Each bar represents a copy number for SMN1 in the cohort of non-SMA samples (n = 40). The distribution of SMN2 copy numbers (0 SMN2, purple; 1 SMN2, red; 2 SMN2, orange; 3 SMN2, yellow and 5 SMN2, green) within each SMN1 copy number is shown within each bar. None of the samples in our cohort contained 4 copies of SMN2.
Discussion
We established new array dPCR SMN1 and SMN2 copy number assays that accurately measured copy numbers in SMA as well as in non-SMA DNA samples isolated from whole blood cells and cell lines derived from fibroblasts and lymphoblasts. The dPCR-derived SMN1 and SMN2 copy numbers matched those found in reference standards used by a diagnostic laboratory and in a limited number of cases using microdroplet dPCR (Zhong et al., 2011). SMN2 copy numbers in SMA DNA samples were concordant with those results measured by TaqMan™ qPCR (Gómez-Curet et al., 2007) at low SMN2 copy numbers but the concordance was not as strong at higher (i.e., >3) SMN2 copy numbers. The majority of dPCR / TaqMan™ qPCR mismatches occurred at higher SMN2 copy numbers where the TaqMan™ qPCR assay cannot easily distinguish unit differences (Gómez-Curet et al., 2007; Prior et al., 2011). Array dPCR detected unit differences in SMN2 copy number over a wide range of SMN2 copy numbers similar to droplet dPCR (Zhong et al., 2011). Because of this wide range of detection, dPCR can be very useful in accurately quantifying SMN2 copy number in patients with milder forms of SMA, that is, type III SMA, who generally have higher SMN2 copy numbers.
The reliability of the array dPCR assays was determined by comparing the coefficients of variation (CV) for all samples with the same copy number. Our array dPCR results had a 1.6–3.7% CV for SMN1 and 2.1–3.7% CV for SMN2. In contrast, the TaqMan™ qPCR assay shows a 5.2–9.7% CV for SMN1 and a 0.8–7.6% CV for SMN2 (Gómez-Curet et al., 2007). The greater reliability of the array dPCR assays when compared against the TaqMan™ qPCR assays is a result of the random distribution of template DNA molecules within the 20,000 partitions in microfluidic dPCR array (Whale et al., 2014).
Using array dPCR, we have confirmed a very strong inverse correlation between SMN2 copy number and disease severity in our SMA patient samples. Numerous previous studies also document a similar relationship between SMN2 copy number and SMA disease severity (Coovert et al., 1997; Lefebvre et al., 1997; McAndrew et al., 1997; Prior et al., 2005; Swoboda et al., 2005; Wirth et al., 2006; Tiziano et al., 2007; Elsheikh et al., 2009; Crawford et al., 2012). SMN2 copy number is associated with many measures of SMA phenotype severity including gross motor function, forced vital capacity, muscle mass, and denervation (Swoboda et al., 2005; Rudnik-Schöneborn et al., 2009; Kaufmann et al., 2011; Crawford et al., 2012; Kaufmann et al., 2012). Many current and future clinical trials for SMA will use these outcomes measures along with changes in SMN expression to gauge efficacy (Nurputra et al., 2013). Because SMN2 copy number is a defining criteria of eligibility to many SMA clinical trials, accurate and reliable measurements will continue to be essential to clinical research.
In some cases within our pool of SMA samples, there were SMA patients with low SMN2 copy numbers exhibiting a milder phenotype. A rare variant in SMN2, SMN2 c.859G>C, may explain this finding as it results in a partial rescue of the truncated, exon 7 excluded, transcript that characterized most of the mRNA generated from SMN2 (Prior et al., 2009; Vezain et al., 2010). Array dPCR will aid in the identification of cases having mismatches from the expected genotype–phenotype relationship. Identifying such mismatches could lead to the identification of potential complementing mutations in SMN2 like SMN2 c.859G>C.
Array dPCR can be easily used to measure SMN1 and SMN2 copy numbers accurately in DNA samples obtained from SMA patients and healthy, non-SMA controls. Array dPCR can accurately determine copy number within a wider range of SMN2 copies (0 to at least 5 copies) than either qPCR (0–3 copies) or QCEFA (0–4 copies). Unlike qPCR, dPCR does not require a calibration curve to assign a numeric measure of copy number (Day et al., 2013). Because the template DNA molecules are randomly distributed amongst the 20,000 partitions in dPCR, copy number measurements are more precise and reliable when compared against qPCR (Whale et al., 2014). For these reasons, array dPCR has advantages in comparison to conventional diagnostic measurements of SMN1 and SMN2 copy number in SMA patient DNA samples. Future work using a larger cohort of gDNA extracted from blood samples will determine the applicability of array dPCR for SMA diagnostics and as a prognostic tool.
Acknowledgments
We would like to dedicate this publication to the memory of Dr. Wenlan Wang who passed away on 26 May 2011. N. J. C. and K. W. L. received fellowships from the University of Delaware Undergraduate Research Program. We thank Susan Kirwin and Priscilla Moses of the Nemours Molecular Diagnostics Laboratory for providing some of the fibroblast lines from their archive as well as their SMN1/SMN2 internal reference standards, Dr. Diana Corao-Uribe, Janell Raber, and Christine Brandt-Montone of the Nemours Biobank for obtaining some of the skin biopsies used to establish some of the fibroblast lines and Dr. Ron Zielke and John Cottrell of the NICHD Brain and Tissue Bank for Neurodevelopmental Disorders at the University of Maryland, Baltimore, MD for providing some of the fibroblast lines used in this study. Other fibroblast lines used in this study were obtained from the Intellectual and Developmental Disabilities Research Center at Kennedy Krieger Institute, Baltimore, MD which is supported by the NICHD grant 1U54HD079123-01A1.
Conflict of Interest
None declared.
References
- Anhuf D, Eggermann T, Rudnik-Schöneborn S. Zerres K. Determination of SMN1 and SMN2 copy number using TaqMan technology. Hum. Mutat. 2003;22:74–78. doi: 10.1002/humu.10221. [DOI] [PubMed] [Google Scholar]
- Baer M, Nilsen TW, Costigan C. Altman S. Structure and transcription of a human gene for H1 RNA, the RNA component of human RNase P. Nucleic Acids Res. 1990;18:97. doi: 10.1093/nar/18.1.97. [DOI] [PMC free article] [PubMed] [Google Scholar]
- Ben-Shachar S, Orr-Urtreger A, Bardugo E, Shomrat R. Yaron Y. Large-scale population screening for spinal muscular atrophy: clinical implications. Genet. Med. 2011;13:110–114. doi: 10.1097/GIM.0b013e3182017c05. [DOI] [PubMed] [Google Scholar]
- Burnett BG, Muñoz E, Tandon A, Kwon DY, Sumner CJ. Fischbeck KH. Regulation of SMN protein stability. Mol. Cell. Biol. 2009;29:1107–1115. doi: 10.1128/MCB.01262-08. [DOI] [PMC free article] [PubMed] [Google Scholar]
- Coovert DD, Le TT, McAndrew PE, Strasswimmer J, Crawford TO, Mendell JR, Coulson SE, Androphy EJ, Prior TW. Burghes AHM. The survival motor neuron protein in spinal muscular atrophy. Hum. Mol. Genet. 1997;6:1205–1214. doi: 10.1093/hmg/6.8.1205. [DOI] [PubMed] [Google Scholar]
- Crawford TO. Pardo CA. The neurobiology of childhood spinal muscular atrophy. Neurobiol. Dis. 1996;3:97–110. doi: 10.1006/nbdi.1996.0010. [DOI] [PubMed] [Google Scholar]
- Crawford TO, Paushkin S, Kobayashi DT, Forrest SJ, Joyce CL, Finkel RS, Kaufmann P, Swoboda KJ, Tiziano F, Lomastro R, Li RH, Trachtenberg FL, et al. Evaluation of SMN protein, transcript and copy number in the biomarkers for spinal muscular atrophy (BforSMA) clinical study. PLoS ONE. 2012;7:e33572. doi: 10.1371/journal.pone.0033572. [DOI] [PMC free article] [PubMed] [Google Scholar]
- Cuscó I, Barceló MJ, Soler C, Parra J, Baiget M. Tizzano E. Prenatal diagnosis for risk of spinal muscular atrophy. Br. J. Obstet. Gynaecol. 2002;109:1244–1249. [PubMed] [Google Scholar]
- Day E, Dear PH. McCaughan F. Digital PCR strategies in the development and analysis of molecular biomarkers for personalized medicine. Methods. 2013;59:101–107. doi: 10.1016/j.ymeth.2012.08.001. [DOI] [PubMed] [Google Scholar]
- Dobrowolski SF, Pham HT, Pouch-Downes F, Prior TW, Naylor EW. Swoboda KJ. Newborn screening for spinal muscular atrophy by calibrated short-amplicon melt profiling. Clin. Chem. 2012;58:1033–1039. doi: 10.1373/clinchem.2012.183038. [DOI] [PMC free article] [PubMed] [Google Scholar]
- Elsheikh B, Prior T, Zhang X, Miller R, Kolb SJ, Moore D, Bradley W, Barohn R, Bryan W, Gelinas D, Iannaccone S, Leshner R, et al. An analysis of disease severity based on SMN2 copy number in adults with spinal muscular atrophy. Muscle Nerve. 2009;40:652–656. doi: 10.1002/mus.21350. [DOI] [PubMed] [Google Scholar]
- Feldkötter M, Schwarzer V, Wirth R, Wienker TF. Wirth B. Quantitative analyses of SMN1 and SMN2 based on real-time LightCycler PCR: fast and highly reliable carrier testing and prediction of severity of spinal muscular atrophy. Am. J. Hum. Genet. 2002;70:358–368. doi: 10.1086/338627. [DOI] [PMC free article] [PubMed] [Google Scholar]
- Gérard B, Ginet N, Matthijs G, Evrard P, Baumann C, Da Silva F, Gérard-Blanleut M, Mayer M, Grandchamp B. Elion J. Genotype determination at the survival motor neuron locus in a normal population and SMA carriers using competitive PCR and primer extension. Hum. Mutat. 2004;16:253–263. doi: 10.1002/1098-1004(200009)16:3<253::AID-HUMU8>3.0.CO;2-8. [DOI] [PubMed] [Google Scholar]
- Gómez-Curet I, Robinson KG, Funanage VL, Crawford TO, Scavina M. Wang W. Robust quantification of the SMN gene copy number by real-time TaqMan PCR. Neurogenetics. 2007;8:271–278. doi: 10.1007/s10048-007-0093-1. [DOI] [PubMed] [Google Scholar]
- Hendrickson BC, Donohoe C, Akmaev VR, Sugarman EA, Labrousse P, Boguslavskiy L, Flynn K, Rohlfs EM, Walker A, Allitto B, Sears C. Scholl T. Differences in SMN1 allele frequencies among ethnic groups within North America. J. Med. Genet. 2009;46:641–644. doi: 10.1136/jmg.2009.066969. [DOI] [PMC free article] [PubMed] [Google Scholar]
- Hsieh-Li HM, Chang JG, Jong YJ, Wu MH, Wang NM, Tsai CH. Li H. A mouse model for spinal muscular atrophy. Nat. Genet. 2000;24:66–70. doi: 10.1038/71709. [DOI] [PubMed] [Google Scholar]
- Huang CH, Chang YY, Chen CH, Kuo YS, Hwu WL, Gerdes T. Ko TM. Copy number analysis of survival motor neuron genes by multiplex ligation-dependent probe amplification. Genet. Med. 2007;9:241–248. doi: 10.1097/gim.0b013e31803d35bc. [DOI] [PubMed] [Google Scholar]
- Kaufmann P, McDermott MP, Darras BT, Finkel R, Kang P, Oskoui M, Constantinescu A, Sproule DM, Foley AR, Yang M, Tawil R, Chung W, et al. Observational study of spinal muscular atrophy type 2 and 3. Functional outcomes over 1 year. Arch. Neurol. 2011;68:779–786. doi: 10.1001/archneurol.2010.373. [DOI] [PMC free article] [PubMed] [Google Scholar]
- Kaufmann P, McDermott MP, Darras BT, Finkel RS, Sproule DM, Kang PB, Oskoui M, Constantinescu A, Gooch CL, Foley AR, Yang ML, Tawil R, et al. Prospective cohort study of spinal muscular atrophy types 2 and 3. Neurology. 2012;79:1889–1897. doi: 10.1212/WNL.0b013e318271f7e4. [DOI] [PMC free article] [PubMed] [Google Scholar]
- Kirwin SM, Vinette KMB, Gonzalez IL, Al Abdulwahed H, Al-Sannaa N. Funanage VL. A homozygous double mutation in SMN1: a complicated genetic diagnosis of SMA. Mol. Genet. Genomic Med. 2013;1:113–117. doi: 10.1002/mgg3.10. [DOI] [PMC free article] [PubMed] [Google Scholar]
- Labrum R, Rodda J. Krause A. The molecular basis of spinal muscular atrophy (SMA) in South African black patients. Neuromuscul. Disord. 2007;17:684–692. doi: 10.1016/j.nmd.2007.05.005. [DOI] [PubMed] [Google Scholar]
- Lefebvre S, Bürglen L, Reboullet S, Clermont O, Burlet P, Viollet L, Benichou B, Cruaud C, Millasseau P, Zeviani M, Le Paslier D, Frézal J, et al. Identification and characterization of a spinal muscular atrophy-determining gene. Cell. 1995;80:155–165. doi: 10.1016/0092-8674(95)90460-3. [DOI] [PubMed] [Google Scholar]
- Lefebvre S, Burlet P, Liu Q, Bertrandy S, Clermont O, Munnich A, Dreyfuss G. Melki J. Correlation between severity and SMN protein level in spinal muscular atrophy. Nat. Genet. 1997;16:265–269. doi: 10.1038/ng0797-265. [DOI] [PubMed] [Google Scholar]
- Lorson CL. Androphy EJ. An exonic enhancer is required for inclusion of an essential exon in the SMA-determining gene SMN. Hum. Mol. Genet. 2000;9:259–265. doi: 10.1093/hmg/9.2.259. [DOI] [PubMed] [Google Scholar]
- Lorson CL, Hahnen E, Androphy EJ. Wirth B. A single nucleotide in the SMN gene regulates splicing and is responsible for spinal muscular atrophy. Proc Natl Acad Sci USA. 1999;96:6307–6311. doi: 10.1073/pnas.96.11.6307. [DOI] [PMC free article] [PubMed] [Google Scholar]
- Lyahyai J, Sbiti A, Barkat A, Ratbi I. Sefiani A. Spinal muscular atrophy carrier frequency and estimated prevalence of the disease in Moroccan newborns. Genet. Test Mol. Biomark. 2012;16:215–218. doi: 10.1089/gtmb.2011.0149. [DOI] [PubMed] [Google Scholar]
- McAndrew PE, Parsons DW, Simard LR, Rochette C, Ray PN, Mendell JR, Prior TW. Burghes AHM. Identification of proximal spinal muscular atrophy carriers and patients by analysis of SMNT and SMNC gene copy number. Am. J. Hum. Genet. 1997;60:1411–1422. doi: 10.1086/515465. [DOI] [PMC free article] [PubMed] [Google Scholar]
- Michaud M, Arnoux T, Bielli S, Durand E, Rotrou Y, Jablonka S, Robert F, Giraudon-Paoli M, Riessland M, Mattei MG, Andriambeloson E, Wirth B, et al. Neuromuscular defects and breathing disorders in a new mouse model of spinal muscular atrophy. Neurobiol. Dis. 2010;38:125–135. doi: 10.1016/j.nbd.2010.01.006. [DOI] [PubMed] [Google Scholar]
- Monani UR, Lorson CL, Parsons DW, Prior TW, Androphy EJ, Burghes AHM. McPherson JD. A single nucleotide difference that alters splicing patterns distinguishes the SMA gene SMN1 from the copy gene SMN2. Hum. Mol. Genet. 1999;8:1177–1183. doi: 10.1093/hmg/8.7.1177. [DOI] [PubMed] [Google Scholar]
- Monani UR, Sendtner M, Coovert DD, Parsons DW, Andreassi C, Le TT, Jablonka S, Schrank B, Rossoll W, Prior TW, Morris GE. Burghes AHM. The human centromeric survival motor neuron gene (SMN2) rescues embryonic lethality in Smn-/- mice and results in a mouse with spinal muscular atrophy. Hum. Mol. Genet. 2000;9:333–339. doi: 10.1093/hmg/9.3.333. [DOI] [PubMed] [Google Scholar]
- Nurputra DK, Lai PS, Harahap NIF, Morikawa S, Yamamoto T, Nishimura N, Kubo Y, Takeuchi A, Saito T, Takeshima Y, Tohyama Y, Tay SKH, et al. Spinal muscular atrophy: from gene discovery to clinical trials. Ann. Hum. Genet. 2013;77:435–463. doi: 10.1111/ahg.12031. [DOI] [PubMed] [Google Scholar]
- Parsons DW, McAndrew PE, Iannaccone ST, Mendell JR, Burghes AHM. Prior TW. Intragenic telSMN mutations: frequency, distribution, evidence of a founder effect and modification of the spinal muscular atrophy phenotype by cenSMN copy number. Am. J. Hum. Genet. 1998;63:1712–1723. doi: 10.1086/302160. [DOI] [PMC free article] [PubMed] [Google Scholar]
- Pearn J. Incidence, prevalence and gene frequency studies of chronic childhood spinal muscular atrophy. J. Med. Genet. 1978;15:409–413. doi: 10.1136/jmg.15.6.409. [DOI] [PMC free article] [PubMed] [Google Scholar]
- Prior TW, Krainer AR, Hua Y, Swoboda KJ, Snyder PC, Bridgeman SJ, Burghes AHM. Kissel JT. A positive modifier of spinal muscular atrophy in the SMN2 gene. Am. J. Hum. Genet. 2009;85:408–413. doi: 10.1016/j.ajhg.2009.08.002. [DOI] [PMC free article] [PubMed] [Google Scholar]
- Prior TW, Nagan N, Sugarman EA, Batish SD. Braastad C. Technical standards and guidelines for spinal muscular atrophy testing. Genet. Med. 2011;13:686–694. doi: 10.1097/GIM.0b013e318220d523. [DOI] [PubMed] [Google Scholar]
- Prior TW, Swoboda KJ, Scott HD. Hejmanowski AQ. Homozygous SMN1 deletions in unaffected family members and modification of the phenotype by SMN2. Am. J. Med. Genet. 2005;130A:307–310. doi: 10.1002/ajmg.a.30251. [DOI] [PMC free article] [PubMed] [Google Scholar]
- Pyatt RE. Prior TW. A feasibility study for the newborn screening of spinal muscular atrophy. Genet. Med. 2006;8:428–437. doi: 10.1097/01.gim.0000227970.60450.b2. [DOI] [PubMed] [Google Scholar]
- Rudnik-Schöneborn S, Berg C, Zerres K, Betzler C, Grimm T, Eggermann T, Eggermann K, Wirth R, Wirth B. Heller R. Genotype-phenotype studies in infantile spinal muscular atrophy (SMA) type I in Germany: implications for clinical trials and genetic counseling. Clin. Genet. 2009;76:168–178. doi: 10.1111/j.1399-0004.2009.01200.x. [DOI] [PubMed] [Google Scholar]
- Sangaré M, Hendrickson B, Sango HA, Chen K, Nofziger J, Amara A, Dutra A, Schindler AB, Guindo A, Traoré M, Harmison G, Pak E, et al. Genetics of low spinal muscular atrophy carrier frequency in sub-Saharan Africa. Ann. Neurol. 2014;75:525–532. doi: 10.1002/ana.24114. [DOI] [PMC free article] [PubMed] [Google Scholar]
- Su YN, Hung CC, Li H, Lee CN, Cheng WF, Tsao PN, Chang MC, Yu CL, Hsieh WS, Lin WL. Hsu SM. Quantitative analysis of SMN1 and SMN2 genes based on DHPLC: a highly efficient and reliable carrier-screening test. Hum. Mutat. 2005;25:460–467. doi: 10.1002/humu.20160. [DOI] [PubMed] [Google Scholar]
- Su YN, Hung CC, Lin SY, Chen FY, Chern JPS, Tsai C, Chang TS, Yang CC, Li H, Ho HN. Lee CN. Carrier screening for spinal muscular atrophy (SMA) in 107,611 pregnant women during the period 2005-2009: a prospective population-based cohort study. PLoS ONE. 2011;6:e17067. doi: 10.1371/journal.pone.0017067. [DOI] [PMC free article] [PubMed] [Google Scholar]
- Sugarman EA, Nagan N, Zhu H, Akmaev VR, Zhou Z, Rohlfs AM, Flynn K, Hendrickson BC, Scholl T, Sirko-Osadsa DA. Allitto BA. Pan-ethnic carrier screening and prenatal diagnosis for spinal muscular atrophy: clinical laboratory analysis of >72400 specimens. Eur. J. Hum. Genet. 2012;20:27–32. doi: 10.1038/ejhg.2011.134. [DOI] [PMC free article] [PubMed] [Google Scholar]
- Swoboda KJ, Prior TW, Scott CB, McNaught TP, Wride MC, Reyna SP. Bromberg MB. Natural history of denervation in SMA: relation to age, SMN2 copy number and function. Ann. Neurol. 2005;57:704–712. doi: 10.1002/ana.20473. [DOI] [PMC free article] [PubMed] [Google Scholar]
- Sykes PJ, Neoh SH, Brisco MJ, Hughes E, Condon J. Morley AA. Quantitation of targets for PCR by use of limiting dilution. Biotechniques. 1992;13:444–449. [PubMed] [Google Scholar]
- Tiziano FD, Bertini E, Messina S, Angelozzi C, Pane M, D’Amico A, Alfieri P, Fiori S, Battini R, Berardinelli A, Boffi P, Bruno C, et al. The Hammersmith functional score correlates with the SMN2 copy number: a multicentric study. Neuromuscul. Disord. 2007;17:400–403. doi: 10.1016/j.nmd.2007.02.006. [DOI] [PubMed] [Google Scholar]
- van der Steege G, Grootscholten PM, van der Vlies P, Draaijers TG, Osinga J, Cobben JM, Scheffer H. Buys CHCM. PCR-based DNA test to confirm clinical diagnosis of autosomal recessive spinal muscular atrophy. Lancet. 1995;345:985–986. [PubMed] [Google Scholar]
- Vezain M, Saukkonen AM, Goina E, Touraine R, Manel V, Toutain A, Fehrenbach S, Frébourg T, Pagani F, Tosi M. Martins A. A rare SMN2 variant in a previously unrecognized composite splicing regulatory element induces exon 7 inclusion and reduces the clinical severity of spinal muscular atrophy. Hum. Mutat. 2010;31:E1110–E1125. doi: 10.1002/humu.21173. [DOI] [PubMed] [Google Scholar]
- Villegas J. McPhaul M. Establishment and culture of human skin fibroblasts. Curr. Protoc. Mol. Biol. 2005;Unit 28.3:28.3.1–28.3.9. doi: 10.1002/0471142727.mb2803s71. [DOI] [PubMed] [Google Scholar]
- Vogelstein B. Kinzler KW. Digital PCR. Proc Natl Acad Sci USA. 1999;96:9236–9241. doi: 10.1073/pnas.96.16.9236. [DOI] [PMC free article] [PubMed] [Google Scholar]
- Whale AS, Huggett JF, Cowen S, Speirs V, Shaw J, Ellison S, Foy CA. Scott DJ. Comparison of microfluidic digital PCR and conventational quantitative PCR for measuring copy number variation. Nucleic Acids Res. 2014;40:e82. doi: 10.1093/nar/gks203. [DOI] [PMC free article] [PubMed] [Google Scholar]
- Wirth B, Brichta L, Schrank B, Lochmüller H, Blick S, Baasner A. Heller R. Mildly affected patients with spinal muscular atrophy are partially protected by an increased SMN2 copy number. Hum. Genet. 2006;119:422–428. doi: 10.1007/s00439-006-0156-7. [DOI] [PubMed] [Google Scholar]
- Zaldívar T, Montejo Y, Acevedo AM, Guerra R, Vargas J, Garofalo N, Alvarez R, Alvarez MA. Hardiman O. Evidence of reduced frequency of spinal muscular atrophy type I in the Cuban population. Neurology. 2005;65:636–638. doi: 10.1212/01.wnl.0000172860.41953.12. [DOI] [PubMed] [Google Scholar]
- Zhong Q, Bhattacharya S, Kotsopoulos S, Olson J, Taly V, Griffiths AD, Link DR. Larson JW. Multiplex digital PCR: breaking the one target per color barrier of quantitative PCR. Lab Chip. 2011;11:2167–2174. doi: 10.1039/c1lc20126c. [DOI] [PubMed] [Google Scholar]