

Abstract
Many protein interactions are mediated by small linear motifs interacting specifically with defined families of globular domains. Quantifying the specificity of a motif requires measuring and comparing its binding affinities to all its putative target domains. To this aim, we developed the high-throughput holdup assay, a chromatographic approach that can measure up to a thousand domain-motif equilibrium binding affinities per day. Extracts of overexpressed domains are incubated with peptide-coated resins and subjected to filtration. Binding affinities are deduced from microfluidic capillary electrophoresis of flow-throughs. After benchmarking the approach on 210 PDZ-peptide pairs with known affinities, we determined the affinities of two viral PDZ-binding motifs derived from Human Papillomavirus E6 oncoproteins for 209 PDZ domains covering 79% of the human PDZome. We obtained exquisite sequence-dependent binding profiles, describing quantitatively the PDZome recognition specificity of each motif. This approach, applicable to many categories of domain-ligand interactions, has a wide potential for quantifying the specificities of interactomes.
INTRODUCTION
Many protein-protein interactions are mediated by globular domains 1 specifically binding to short linear peptide motifs 2, involved in complex intracellular competition through quantitatively distinct individual affinities. High throughput interactomics studies have allowed genome-wide description of protein-protein interaction networks 3, including those mediated by domain-motif interactions 4. However, these methods have mainly delivered “binary” data (“interact” or “not interact”) without quantitative information on affinities and specificities. The development of approaches for systematic determination and affinity ranking of domain-motif interacting pairs thus represents a key challenge in systems biology 5.
PDZ domains recognize specific linear motifs (dubbed PDZ-Binding Motifs or PBMs) at the extreme C-terminus of partner proteins 6. The human proteome contains 266 identified PDZ domains (the “PDZome”) dispersed over 152 proteins, and a few thousands of putative PBMs 7. PDZ-PBM interactions participate in cell polarity processes critical for cellular differentiation, proliferation and migration across a wide range of epidermal, retinal, endothelial, neuronal, or immunological cellular types 8,9. PDZ-mediated interactions are recurrently perturbed in carcinogenesis. Several tumor virus proteins, such as Human Papillomavirus (HPV) E6 oncoprotein, contain PBMs that target cancer-relevant PDZ-containing cellular proteins 10.
Here, we developed and benchmarked a fast, accurate and versatile chromatographic approach for determination of domain-ligand affinities at high-throughput. We used this approach to generate “PDZome-binding profiles” quantitatively describing the binding specificity of two HPV E6 PBMs towards the almost full complement of human PDZ domains.
RESULTS
Principle of automated holdup assay
To address PDZ-motif interaction specificities on a large scale, we automated on a liquid handling robot the holdup approach, a chromatographic assay that evaluates domain-ligand interaction affinities at equilibrium 11 (Fig. 1a). Soluble bacterial overexpression extracts of domains fused to a solubility-enhancing tag (here, Maltose Binding Protein) are incubated with aliquots of resin saturated with ligand molecules (here, biotinylated peptides). At this step, affinity-dependent proportions of domain-ligand complexes are formed, favored by the high ligand concentration (around 50-100 μM) largely exceeding the domain concentration (4 μM). Next the resin-extract mixtures are filtrated. The resin, trapped on the filter, retains (“holds up”) the domain-ligand complexes whereas the liquid filtrate contains the free domain molecules. Filtrates of domain extracts incubated with biotin-saturated resin provide negative controls. All filtrates are then systematically subjected to quantitative microfluidic capillary electrophoresis (Fig. 1b). Whenever a domain binds a ligand, the domain peak intensity in the filtrate of the ligand-saturated resin Ilig decreases as compared to the domain peak intensity in the control filtrate Ictrl (Fig. 1b). To optimize the precision of the measurement, domain peak intensities in the compared filtrates are normalized against an internal standard peak (Fig. 1c,d).
Figure 1.
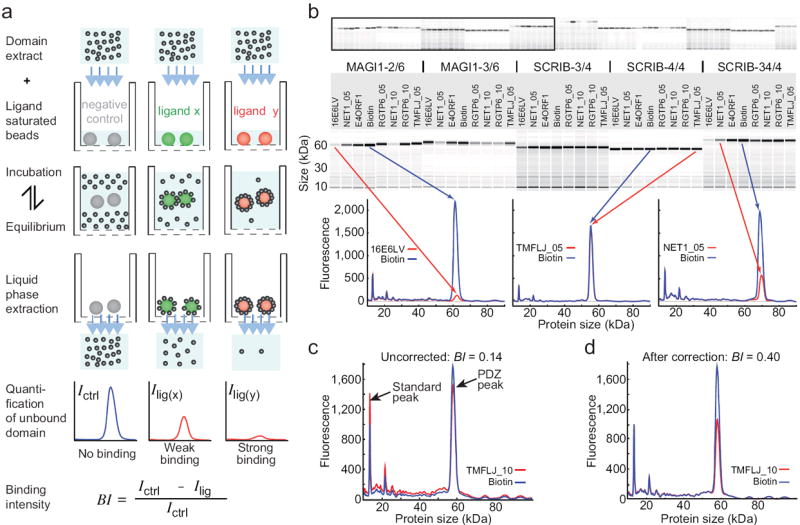
Principle, readout and data treatment of high-throughput holdup assay. (a) Soluble extracts of overexpressed domains are incubated with resin saturated with ligands (here, biotinylated peptides) then filtrated. Flowthroughs are analyzed by microfluidic capillary electrophoresis. A decrease in domain signal in the flowthrough reveals domain-peptide interactions and allows for determination of binding intensities (BI) using the depicted formula. (b) Upper panels: the readout consists in electropherograms (here displayed as virtual gels) of extracts of MBP-PDZ constructs (e.g. MAGI1-2) filtered through resin coated with negative control (e.g. biotin) or peptide (e.g. 16E6LV). Lower panel: overlaid electropherograms of peptide (red) and biotin (blue) flowthroughs reveal both the occurrence and the strength of binding events. Instances of strong binding (MAGI1-2 vs 16E6LV), no binding (SCRIB-4/4 vs TMFLJ_05) or moderate binding (SCRIB-34/4 vs NET1_05) are shown. (c) Instance of two “uncorrected” electropherograms displaying scale differences due to discrepancies in sample loading input. (d) Same electropherograms as before, after normalization against an internal standard peak (here, lysozyme). The corrected electropherograms now look identical, except for the PDZ peak, reduced in the peptide filtrate as compared to the biotin filtrate.
Because the protocol uses a fixed amount of resin fully saturated with ligand peptide, the concentration of ligand is expected to be the same in all measurements. The fraction of domain bound to ligand-saturated resin can therefore be used to define a binding intensity (BI), which allows quantifying and ranking the affinities of all domain-ligand pairs measured:
Equilibrium dissociation constants (KD) can also be estimated using the following formula, where Ibg represents the background signal (see Online Methods for details):
Validation of automated holdup assay
We previously measured by surface plasmon resonance (SPR - BIAcore) 210 interactions involving 42 biotinylated peptides and 5 MBP-fused PDZ constructs (MAGI1-2/6, MAGI1-3/6, SCRIB-3/4, SCRIB-4/4 and SCRIB-34/4), revealing a variety of affinities ranging from micromolar to submillimolar 12. Here, we addressed these 210 interactions as a benchmark for the automated holdup assay. The measurements were performed using three 96-well plates at a rate of 90 min / plate for the interaction assay, plus 66 min / plate for the analysis by capillary electrophoresis. Holdup and SPR data are in very good agreement (correlation coefficient r = 0.76) (Fig. 2a,b and Supplementary Table 1). The best correlation (r = 0.81) is obtained for affinities in the 15-100 μM range (Fig. 2b). Furthermore, the holdup assay detected and discriminated very weak affinities (in the submillimolar range) for many PDZ-peptide pairs that had not generated any signal in the SPR study (see for instance construct SCRIB-4/4, Fig. 2a). We estimate that avidin resin-based holdup can detect relevant binding intensities for KD values up to 300 μM (see Online Methods). The weakest affinity detectable in a holdup assay is dictated by the resin capacity, which determines the concentration of resin-attached ligand in the binding reaction.
Figure 2.
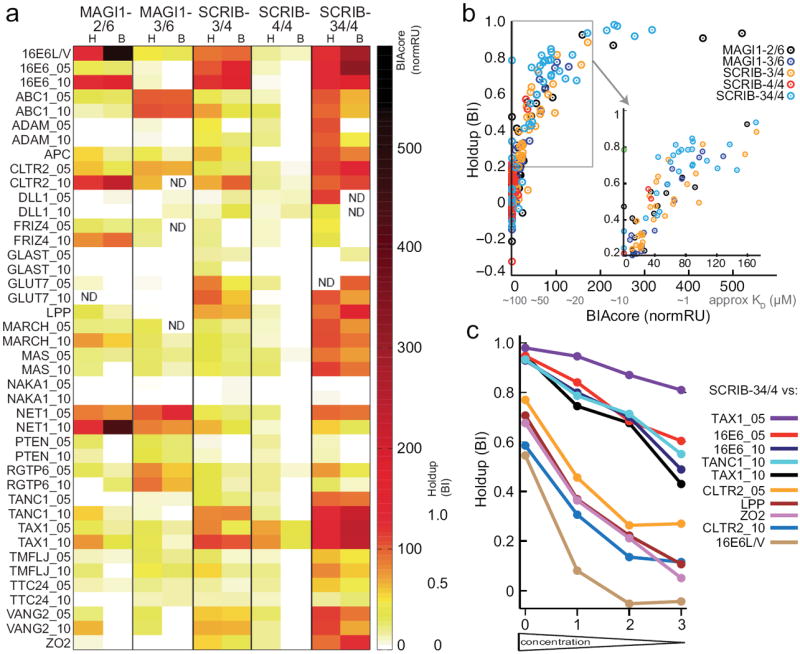
Benchmarking the holdup assay. (a) Heatmap comparing binding intensities of 210 MBP-PDZ / peptide pairs, measured by standard holdup assay (“H”) or BIAcore (“B”) (data from Luck et al. 12). While both methods equally detected medium to strong interactions (orange-red) holdup better detected weak interactions (faint yellow) (see column of SCRIB4/4) but failed to discriminate the intensities of the strongest interactions (dark red-black). (b) Correlation plot of the 210 binding intensities obtained using either BIAcore or holdup. The region showing the most linear correlation is zoomed. “normRU”: normalized BIAcore response units from Luck et al. 12. (c) Binding of MBP-SCRIB-34/4 to strong and medium binders measured by holdup using standard (0) or diluted conditions (1, 2 and 3) (see Online Methods). Diluted conditions better discriminated the strongest binding intensities.
For stronger PDZ-peptide complexes in the 1-10 μM affinity range, our standard holdup protocol delivered saturated maximal binding signals and therefore failed to rank affinities in that range in contrast to SPR (Fig. 2b). Additional holdup runs using serial dilutions of both peptide-saturated resin and domain extracts eventually discriminated the individual affinities of the strong complexes (Fig. 2c).
We also tested holdup measurements using purified domain constructs instead of crude soluble extracts. The results of both approaches were strongly correlated (r = 0.92) (Supplementary Fig. 1). Binding intensities were in general slightly stronger for unpurified domains, indicating that the extracts may protect the constructs from unfolding or aggregation and/or stabilize the complexes. Therefore, for constructs such as MBP-PDZ fusions that are mostly well-folded and soluble, purification can be skipped.
Probing the binding of viral peptides to the human PDZome
We cloned and expressed as MBP-fusions the 266 known PDZ domains representing the human PDZome (see Online Methods). Soluble MBP-PDZ protein was detected for 241 constructs, i.e. 92% of the PDZome (Supplementary Table 2, Supplementary Fig. 2). Among those, 230 were readily overexpressed in 24-deepwell plates while 11 could only be expressed in large flasks.
We then performed high-throughput holdup assays, in which we probed the interaction of the overexpressed PDZome with two viral PBMs corresponding to the extreme C-termini of the HPV16 and HPV18 E6 oncoproteins (sequences SSRTRRETQL and RLQRRRETQV, respectively). The assay was performed in two alternative formats using either 384-well plates (Fig. 3a) or 96-well plates (not shown). In both setups and across, results were highly reproducible and comparable (Fig. 3b,c) with standard deviations (STD) of BI below 0.1 in 90% of all cases. By running a triplicate 384-well holdup screen, we generated, in one “single shot”, high-quality interaction data for 209 PDZ constructs (79% of the PDZome) versus two PBMs and two negative controls (Supplementary Fig. 3 and 4), representing more than a thousand domain-peptide interactions measured over one day.
Figure 3.
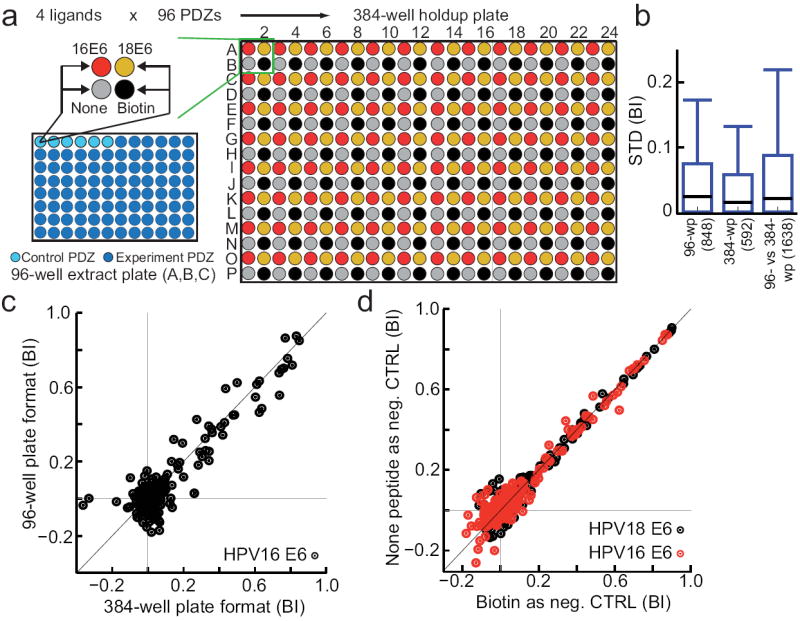
Experimental plan and performance of HPV E6-PDZome interaction screen. (a) The 266 known human PDZ domains were cloned and 241 were successfully overexpressed as soluble MBP-fusions. Soluble overexpression extracts were adjusted to approximately 4 μM of MBP-PDZ, aliquoted and stored at -20°C in series of three 96-well plates (A, B, C). To perform an holdup assay, freshly thawed extracts from one series of plates A, B and C were each distributed into four wells of a 384-well filter plate, containing four distinct batches of resin saturated with HPV16 E6 C-terminus, HPV18 E6 C-terminus, a negative control peptide (none) or a negative control molecule (biotin). The assay was performed in triplicate, requiring in total nine 384-well plates. (b) Box-whisker plots showing the distribution of standard deviations of BIs from measurements repeated in 96-well plates (left), in 384-well plates (middle), or between 96-well plates and 384-well plates (right). Lower box margin: 10th percentile, black line: median, upper box margin: 90th percentile, upper whisker (error bar): max standard deviation observed. Total numbers of pairwise comparisons of BIs obtained for identical PDZ-peptide pairs are shown in brackets on the x-axis. (c) Correlation plot of BIs measured using 384- or 96-well plate formats. (d) Correlation plot of BIs calculated using either biotin or none peptide as a control.
Choice of control and threshold for defining binders
We tested two alternative controls in the PDZome interaction screen (Fig. 3a): biotin and an irrelevant “none” peptide presenting a neutral hydrophilic sequence (GSNSGNGNS) devoid of any PBM. The results obtained using either control were highly correlated (r = 0.97) (Fig. 3d). In addition, neither the none peptide nor biotin displayed relevant binding to any PDZ domain (Fig. 4a, Supplementary Fig. 3), demonstrating their equal suitability as negative controls. Remarkably, 100% and 98% of the BI values obtained in the negative control experiments are lower than 0.2 and 0.1, respectively (Supplementary Table 3), and 100% and 95% of BI values measured in the 384-well format have STDs lower than 0.2 and 0.1, respectively (Fig. 3b). Therefore, we propose two alternative BI threshold values (BImin) for defining “binders” whenever quantitative holdup data must be converted to binary interaction data. BImin = 0.2 represents a very stringent threshold to retain only high-confidence binding pairs, whereas BImin = 0.1 represents a more relaxed threshold to retain a number of additional pairs that display weak but relevant binding signal.
Figure 4.
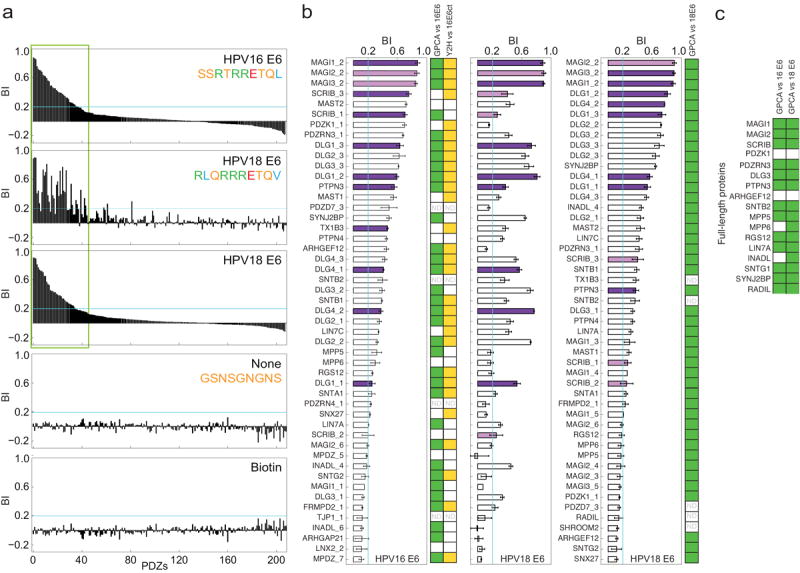
PDZome binding profiles of E6 PBMs. (a) Full Profiles. From up to down: HPV16 E6 - PDZ Binding Intensities (using biotin as control) ranked by decreasing values; HPV18 E6 - PDZ BIs, ranked as in the HPV16 profile; HPV18 E6 - PDZ BIs, ranked by decreasing values; none peptide - PDZ BIs (using biotin as control) ranked as in the HPV16 profile; biotin - PDZ BIs (using none peptide as control) ranked as in the HPV16 profile. Considerable re-shuffling is observed between HPV16 and HPV18 profiles despite of highly similar PBM sequences. (b) Zoomed views (corresponding to thee green box in (a)) showing the 49 best PDZ binders of HPV16 and HPV18 E6. Dark purple bars: PDZ domains previously published to bind that PBM. Violet bars: strongest binding PDZ domain of multi-PDZ proteins previously published to bind that PBM. Error bars: s.e.m. based on triplicate experiments. Colored squares at the right of the plots indicate GPCA positives in our validation (i.e., NLR ≥ 3.5) (green) (the full duplicate GPCA data are shown in Supplemental Table 11) or Y2H positives in a former screen by Belotti et al. 17 (yellow) (see also Supplemental Table 6). White squares: negatives; “ND”: not determined. (c) 17 human proteins containing PDZ domains identified as E6 binders by holdup were assayed by GPCA for interaction with both HPV16 E6 and HPV18 E6.
Quantifying the PDZome recognition specificities of PBMs
For each peptide, the results of the holdup screen were plotted by ranking decreasing PDZ binding intensities from left to right (Fig. 4a) (see also Supplementary Fig. 4 and Supplementary Table 3). This plotting mode produces “PDZome binding profiles”, which depict the binding specificity of each motif at a glance. The steeper the slope of the profile, the more specific the motif. The HPV18 E6 PBM appears slightly more specific than the HPV16 E6 PBM (Fig. 4a).
We estimated KD values for all the PDZ-peptide pairs investigated (Online Methods and Supplementary Table 3). We observe a continuum of affinities, spanning from micromolar to submillimolar. Roughly, each E6 PBM binds 1%, 4% or 20% of the PDZome with a KD below 5 μM, 25 μM or 250 μM, respectively. The continuity of the profiles indicates that human PDZ domains are sufficiently diverse to sample a whole range of affinities for any PBM, including viral ones. These data confirm predictions from Stiffler et al. 13, who suggested that PDZ domains evenly sample a continuous selectivity space rather than clustering into discrete classes.
HPV16 E6 and HPV18 E6 share 70% of common binders (using BImin = 0.1) (Fig. 4b, Supplementary Fig. 5), but their respective affinities for these binders can vary considerably, leading to a substantial re-shuffling of the binding profiles (Fig. 4a and b). Given the high similarity of the two E6 PBMs, this shows that the profiles represent a signature exquisitely dependent on the motif sequence. This signature and its variations are likely to be functionally relevant. For instance, a recent study 14 indicated that HPV16 E6 and HPV18 E6 preferentially degrade SCRIB or DLG proteins, respectively, while both of them efficiently degrade MAGI1. Accordingly, the profiles show that both HPV16 and HPV18 E6 preferentially bound to MAGI PDZ2 domains, closely followed by SCRIB PDZ3 and PDZ1 domains for HPV16 E6, and followed instead by PDZ2 and PDZ3 domains of DLG proteins for HPV18 E6 (Fig. 4b).
Holdup-based heat maps of E6-binding PDZ domains in the context of full-length proteins are also informative (Fig. 5). They show that some proteins, such as SCRIB, DLGs, or MAGI1, can contain several E6-binding domains. This, combined with the ability of E6 to dimerize 15, may create avidity effects prone to potentiate the capture of some host multi-PDZ proteins by E6.
Figure 5.
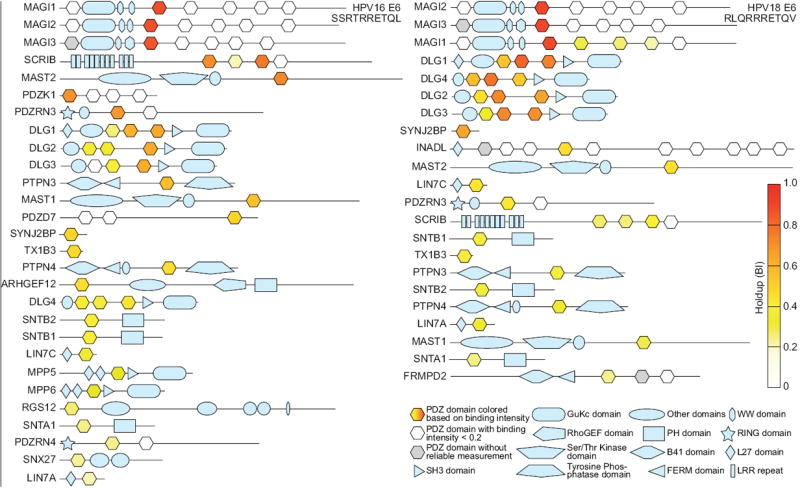
Domain maps of human proteins containing E6-binding PDZ domains. PDZ domains are colored in heat map mode, according to E6 binding intensities. Proteins are ranked according to the binding intensities of their best E6-binding PDZ domain.
Identifying sequence determinants of PDZ-E6 recognition
An alignment of 209 PDZ domains ranked according to their highest E6-binding intensity (Supplementary Fig. 6) revealed, at defined PDZ domain positions, residues displaying a distribution bias towards the top or the bottom of the alignment, that we interpreted as residues preferred or disliked for E6 binding, respectively (see Online methods, Supplementary Fig. 6 and 7, and Supplementary Tables 7 and 8). When highlighted on the structure of E6-bound MAGI1 PDZ2 (Fig. 6a), the PDZ domain positions carrying the residues best correlated to E6 binding are proximal to E6 PBM. Two of the best correlated residues, His119 and Val123, are well-known determinants 6 for recognition of class I PBMs displaying a threonine at position -2; and Glu63 contributes to E6 binding by contacting a stretch of arginines present in both E6 PBMs 12.
Figure 6.
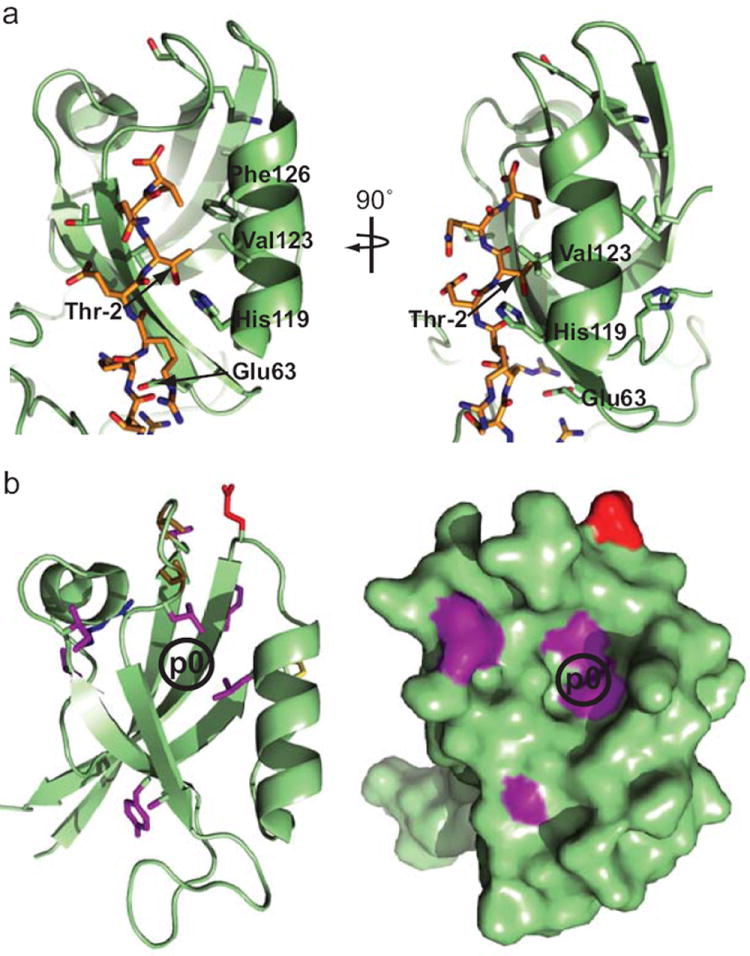
Determinants of PDZ-E6 recognition derived from holdup data. (a) PDZ domain positions (numbered as in Supplementary Fig. 6), for which the occurrence of particular residues correlates with E6 binding, are represented on the 3D structure of MAGI1-2/6 PDZ domain bound to E6 PBM (2KPL.pdb) (shown in two orientations). Among the PDZ residues best correlated with E6 binding, His119 and Val123 both occupy positions proximal to PBM residue Thr-2 in the 3D structure. Accordingly, PBM position -2 is a well-known determinant for PBM-PDZ selectivity. (b) Domain positions, whose physico-chemical properties significantly correlated with BI differences between HPV18 E6 vs HPV16 E6, are represented on the 3D structure of PDZ DLG2-2/3 (2BYG.pdb) (shown either in ribbon or in space filling modes). Several positions are found to cluster around the binding pocket that accomodates PBM position p0 (represented as a black circle). Accordingly, p0 is the position where the two E6 PBM sequences diverge most (L for HPV16; V for HPV18).
We also exploited the profiles to identify critical PDZ positions dictating a preference for HPV18 E6 vs HPV16 E6 or vice-versa. 60 E6-binding PDZ domains (BI > = 0.1 for HPV16 and/or HPV18) were aligned (Supplementary Fig. 8) and ranked according to the differences ΔBI observed between their intensities of binding to HPV18 and HPV16 E6 (Supplementary Table 9). We observed substantial ΔBI values spanning from 0.54 to 0.09. We identified 13 PDZ domain positions in the alignment whose physico-chemical properties of the respective residues (evaluated by four indices developed by Atchley et al. 16) significantly correlated with ΔBI values (see Online methods, Supplementary Fig. 9, and Supplementary Table 10). The most highly correlated domain positions are proximal to peptide position p0 in PDZ-PBM complexes (Fig. 6b). Remarkably, the most notable difference between HPV16 and HPV18 E6 PBMs (see sequences Fig. 4) is at peptide position p0 (L vs V). These results demonstrate the power of quantitative holdup data for identifying sequence determinants of domain-motif interaction specificities.
Comparison to previous studies and orthogonal validation
The holdup screen identified 50 binders for HPV16 E6 and 52 for HPV18 E6 (using BImin = 0.1). As compared to previous low-throughput studies, we confirmed 11 among 12 and 8 among 10 of the published binders (Fig. 4) of HPV16 and HPV18 E6, respectively (see also Supplementary Fig. 5 and Supplementary Table 4). We identified about 40 novel E6-binding PDZ domains, including strong binders such as MAST2, DLG2_2, DLG2_3, DLG3_2, DLG3_3, PDZK1_1, PDZRN3_1, SYNJ2BP (Fig. 4).
Recently, Belotti et al. 17 identified 36 HPV16 E6 binding PDZs 17 from a high-throughput yeast two-hybrid (Y2H) screen of the human PDZome. The holdup assay confirms most of the binders detected by Y2H: 26/36 (72%) using BImin = 0.2, and up to 29/36 (81%) using BImin = 0.1 (Fig.4b, Supplementary Table 6). Using BImin = 0.2, the holdup screen returns 37 HPV16 E6 binders. Using BImin = 0.1 instead, the holdup identifies 13 additional hits, among which only 3 were detected by Y2H (Supplementary Table 6). These additional holdup hits display a weak but significant E6-binding signal, with a low standard deviation.
We validated the holdup screen in mammalian cells using the split Gaussia princeps luciferase Protein Complementation assay (GPCA) 18. In this assay, a “Normalized Luminescence Ratio” (NLR) is computed from the luminescence signals generated by the potential interactors and two controls. A NLR > 3.5 has been found to correspond to a false positive rate below 2.5% 18. We first probed by GPCA the binding of full-length HPV16 and HPV18 E6 proteins to PDZ domains identified as binders of HPV16 or HPV18 E6 PBM by the holdup assay (threshold BImin = 0.1). 33/45 (73%) and 45/45 (100%) of the domains obtained a NLR > 3.5 with HPV16 or HPV18 E6, respectively (Fig. 4b, Supplementary Table 11). Next, we retrieved and subcloned the cDNAs of 17 full-length cellular proteins containing E6-binding PDZ domains identified by holdup assay, and probed by GPCA their interaction with full-length HPV16 and HPV18 E6 proteins. 13/17 (76%) and 15/17 (88%) of these proteins obtained a NLR > 3.5 with HPV16 E6 and HPV18 E6, respectively (Fig. 4c, Supplementary Table 11). Performing holdup assays on protein fragments (i.e. peptides vs domains) thus appears as a valuable strategy for identifying interactions between full-length proteins.
Altogether, we observed a very high agreement between holdup, GPCA and Y2H for domain-peptide interaction discovery. Furthermore, the holdup approach displayed a high sensitivity for low-affinity pairs, and presented the unique advantage of providing affinity-based ranking of the identified binders.
Novel E6 targets potentially involved in cancer
To investigate whether genes encoding potential E6-binding PDZ proteins identified by holdup are significantly deleted or amplified in tumor samples, we queried the Tumorscape dataset containing the sequences of more than 3000 tumor genomes 19 (Supplementary Table 12). The genes of five putative E6 targets (MAGI2, MAGI3, DLG2, PDZRN3 and ARHGEF12) were found to be deleted in at least two different tumor types and those of four other E6 putative targets (SCRIB, DLG1, SNTB1, SNX27) were found to be amplified in at least three different tumor types. The cell junction scaffolding MAGI proteins have already been implicated in tumor suppressor functions 20, 21, 22, 23. The cell polarity proteins SCRIB and DLGs are known to display tumor suppressor and oncogene functions depending on the cellular context 24,25. ARGHEF12 has also been recently noticed as a potential tumour suppressor 26. Whereas MAGI and DLG proteins, SCRIB and very recently PDZRN3 27 are known E6 targets, ARHGEF12, SNTB1 and SNX27 are novel putative E6 targets with a possible link to cancer.
Discussion
The automated holdup assay described herein detects complexes at equilibrium by contrast to several other high-throughput methods for domain-motif binding specificity evaluation such as ELISA 28, SPOT assays 29 or protein arrays 13, 30, which all analyze the survival of complexes after washing steps. Because it operates at equilibrium in the presence of high ligand concentrations, the assay is particularly suitable for analyzing low affinity domain-ligand complexes in the submillimolar range, which may escape detection by methods that require protein concentrations in the range of the KD investigated, such as SPR, calorimetry or fluorescence polarization. Indeed, many domain-motif interactions display low affinity 2, 12, 13, 30, 31 as transient interactions are essential for cell signaling 32. The holdup assay, with its ability to accurately rank low affinity interactions, will thus represent a valuable approach to quantitatively investigate the specificity of cell signaling mediated by large numbers of domains and motifs.
Whereas most approaches for affinity measurements evaluate complexes via indirect properties such as fluorescence 30, 33, fluorescence polarization 34, calorimetry 35, surface plasmon resonance 36, or antibody-mediated signal 28, 29, 37, the holdup assay directly visualizes the bound and unbound proteins by means of electropherograms that provide, for each individual data point, highly precise qualitative and quantitative information (molecular weight, construct integrity, concentration, purity).
The holdup assay is easy to implement and highly versatile. The protocol demonstrated here uses a multitask liquid handling robot and a microfluidics capillary instrument, both found in many laboratories where they serve other purposes. An alternative cost-effective protocol can still address up to a few hundreds of interactions per day without using these instruments (see Online Methods).
Holdup profiles depict motif specificities, quantify sequence determinants of motif-domain recognition and deliver functionally relevant information. Observed differences in the E6-PDZome binding profiles of HPV types 16 and 18 likely play a role in their distinctive biological and pathological traits. The exquisite sequence-dependency of the profiles sets the stage to sequence-function studies, which will analyze the functional impact of natural variations or site-directed mutations of motifs with respect to the resulting alterations of their domain-ome binding profiles. The affinity-based ranking contained in binding profiles can also serve as a rational criterion to select a subset of interactions for further functional characterization. While we focused in this work on motif-domain profiles, we envision future adaptations of the holdup assay for analyzing, at a proteomic scale, interactomes of various domain families with different categories of resin-attachable ligands including all types of modified peptides, sugars, nucleic acids, lipids, or small molecule inhibitors.
ONLINE METHODS
Cloning of human PDZ domains
PDZ domains of benchmark dataset
For benchmarking the automated holdup assay we used five human PDZ domain constructs (MAGI1-2/6, MAGI1-3/6, SCRIB-3/4, SCRIB-4/4, SCRIB-34/4), which we had previously cloned into PETM41 bacterial expression vectors (EMBL Heidelberg and described in 12 (for sequence information see category “C” in Supplementary Table 2).
Control PDZ domains
For each holdup experiment performed in 96- or 384-well plate format in the context of the PDZome screen, we ran control measurements including six PDZ domain constructs whose diverse binding behavior to HPV16 or 18 E6 has been well studied in our group 12. These six constructs comprise the four single PDZ domain constructs used in the benchmarking (see previous paragraph) and the two PDZ constructs SCRIB-1/4 and SCRIB-2/4, which have been cloned identical to the others (for sequence information see category “C” in Supplementary Table 2).
PDZ domains of PDZome
To clone an expression library of the human PDZome (266 PDZs in total 7), we retrieved 224 out of 246 human PDZ domain constructs previously cloned by Belotti et al 17. The sequences of these constructs are provided in Supplementary Table 2 (category “A”). We completed the collection by cloning synthetic genes (NZYtech, Portugal) of 42 PDZ domains (category “B” in Supplementary Table 2). The design of the N-terminal and C-terminal boundaries of the “A” and “B” constructs has been previously described in 17 and 7, respectively. Both “A” and “B” types of constructs were initially cloned into the pDONRZeo entry vector using Gateway BP reactions, then transferred using Gateway LR reaction into the His-pKM596 vector 40.
Both His-pKM596 and PETM41 vectors allow bacterial overexpression of the cloned domains as fusions to his-tagged Maltose Binding Protein (His-MBP). The MBP tag is known to optimize the folding and the solubility of passenger proteins 41 and it also increases the molecular weight of the constructs, facilitating their detection and quantification by microfluidic capillary electrophoresis.
Note that in this study we used for each of the six PDZ domains MAGI1-2/6, MAGI1-3/6, and PDZ 1 to 4 of SCRIB two clones (“A” and “C”) differing in their N- and C-terminal domain boundaries. Both clones have been used in the PDZome screening experiments with the “C” clones being used as control (see previous paragraph). If measurements of several clones of the same PDZ domain have been available, final data analysis and plotting was performed on clone of type “B” if available, otherwise “C”, otherwise “A”.
The full PDZome clone collection (266 clones) was sequenced in destination vector, resulting in a set of 252 fully sequenced clones and 14 remaining clones for which no reliable sequence data could be obtained with 2 distinct sequencing primers (CNKSR2_A, DEPDC6_A, GRIP2_6_A, IL16_3_A, LIN7B_A, MAGIX_A, PDZD2_3_A, RIMS1_A, SCRIB_2_A, SIPA1L1_A, TJP3_1_A, TJP3_2_A, TJP3_3_A, USH1C_1_A) Among the 252 sequenced clones, 243 clones corresponded to known isoforms (documented in Uniprot or NCBI) and were therefore retained. 3 additional clones (MAGI3_6_A, MPP5_A, SDCBP2_1_A) presented sequence variations previously unknown, yet unlikely to perturb either the folding or peptide recognition by the domain. Such sequences may correspond to undocumented, yet existing, sequence variants; therefore they were retained. Finally, 6 clones (GRID2IP_2_A, MPDZ_10_A, PDZD3_3_A, SDCBP2_2_A, SHANK1_A, PDZK1_2_B) revealed mutations likely to affect the correct folding of the domain; those clones were excluded. Therefore, at the end of this process we finally retained 246 clones with validated DNA sequencing, which could all be expressed successfully (see Supplementary Table 2 and Supplementary Fig. 2).
Protein production and preparation of human PDZ domains
Expression of His-MBP-PDZ domains
All PDZ domains (benchmarking set, control PDZ and the 246 PDZ domains of the PDZome) were expressed in 24-deepwell plates following the high-throughput protocol previously described 38, 39. Briefly, the plasmids were transformed in E. coli Ros (DE3) pLysS and the proteins were expressed in 4 ml of ZYP5052 auto-induction medium for 4h at 37°C followed by 18h at 17°C in a thermostated multiplate shaker. The cells were harvested by centrifugation. To increase biomass, each clone was grown in triplicates (three time 4-ml cultures). The 798 cultures for expressing the full PDZome were all performed simultaneously. Each pellet was resuspended in 600 μl of lysis buffer (buffer A : 50 mM Tris (pH8.0) / 300 mM NaCl / 10 mM Imidazole / 5 mM DTT, supplemented with 17.25 μM lysozyme). The three resuspended pellets of each His-MBP-PDZ domain production (1.8 ml in total) were pooled into three 96-deepwell plates (DW 96) labeled PDZ 1-96, PDZ 97-192 and PDZ 193-246. An 80 μl aliquot of each suspension were aliquoted into separate 96 well PCR plates. Cell pellet resuspensions were frozen at -20°C until further processing.
Lysis of the 80 μl aliquot and quantification of His-MBP-PDZ domains
For bacterial lysis, first the frozen cell suspensions of the 80 μl aliquots of each clone were thawed by incubation for 20 minutes at 37°C, then supplemented with 10 μg/ml DNaseI and 20 mM MgSO4 and further incubated for 15 minutes at 17°C with agitation. The lysed cell suspension was transferred into Eppendorf tubes and cleared by centrifugation. The lysates were diluted 4 times with lysis buffer and His-MBP-PDZ protein concentration was measured by quantitative capillary gel electrophoresis (LabChip GXII, Caliper, PerkinElmer). A dilution matrix was generated according to which the lysates were adjusted with lysis buffer to a final His-MBP-PDZ concentration of 5 μM.
Lysis of the expression cultures and quantification of His-MBP-PDZ domains
Lysis of the His-MBP-PDZ expressions was performed using the protocol mentioned above. Cleared lysates were diluted to a final concentration of 5 μM His-MBP-PDZ, using the dilution matrix based on the 80 μl aliquots. The PDZome was aliquoted by 40 μl into series of 96-well plates (representing 45 plates of PDZ 1-96, PDZ 97-192 and PDZ 193-246, respectively for one PDZome culture) and frozen at -20°C prior to be used for holdup experiments. For each new PDZome, one series of PDZ 1-96, PDZ 97-192 and PDZ 193-246 adjusted at 5 μM were thawed, quantified a second time using capillary gel electrophoresis and a new dilution matrix was applied to adjust all His-MBP-PDZ samples precisely to 4 μM prior to the holdup experiment. This allowed removing any discrepancies in His-MBP-PDZ concentration, due to slight differences in the initial cleared lysate preparation. This second dilution matrix was applied on the robot systematically at the beginning of each of the 44 holdup experiments for a given PDZome expression.
Purification of the His-MBP-PDZ domains
All the PDZ domains (benchmarking set, control PDZ and the 246 PDZ domains of the PDZome) were expressed and purified by using strictly the high-throughput protocol previously described 38, 39 in deep-well block 24. Briefly, after harvesting the cells by centrifugation (4-ml cultures), each pellet was resuspended in 1000 μl of lysis buffer (buffer A : 50 mM Tris (pH8.0) / 300 mM NaCl / 10 mM Imidazole / 5 mM DTT, supplemented with 17.25 μM lysozyme) and frozen at -20°C until further processing.
For protein purification, the frozen cell pellets were thawed by incubation for 20 minutes at 37°C, then supplemented with 10 μg/ml DNase I and 20 mM MgSO4 and further incubated for 15 minutes at 17°C with agitation. 50 ml of Ni Sepharose 6 FF beads (GE-Healthcare: 17-5318-02) were added into the lysed cell suspension, incubated and transferred into a filter plate (Novagen 71196-3). The beads were washed and eluted with 200 ul of buffer A containing 250 mM imidazole. The concentration of the His-MBP-PDZ proteins was measured by quantitative microfluidic capillary gel electrophoresis (LabChip GXII, Caliper, PerkinElmer) and a dilution matrix was calculated in order to adjust each lysate to a final His-MBP-PDZ concentration of 4 μM.
Preparation of peptides
Biotinylated peptides were synthesized by either JPT Innovative Peptide Solutions (Berlin, Germany, www.jpt.com) with 70-80% purity or by the peptide synthesis service at IGBMC (Illkirch, France, www.igbmc.fr) with 80-90 % purity. All peptides are N-terminally coupled to biotin. Peptides provided by JPT are coupled to biotin via a Ttds (N-(13-amino-4,7,10-trioxa-tridecayl)-succinamic acid) linker. Peptides provided by IGBMC are directly chemically linked to biotin via a peptide bond. The lyophilized peptides were taken up into water to a stock concentration of 10 mM. After that the pH was roughly adjusted to pH 8 (with NaOH), the solutions were sampled as 100 μl aliquots and stored at -20°C.
The holdup assay
Principle
The holdup assay is based on the principle of comparative chromatographic retention of ligand-analyte pairs at equilibrium conditions. Two equivalent batches of affinity chromatographic beads are coated with either a ligand to be tested (in our setup it will be biotinylated peptide) or with a negative control ligand (in our case biotin or the biotinylated “None” peptide GSNSGNGNS), which should not display any interaction to any analyte. Both batches are incubated with analyte protein in identical experimental conditions until binding equilibrium between ligand and analyte is reached in solution. No washing steps are performed and therefore the binding equilibrium is not disturbed. Liquid phases are rapidly collected by filtration and unbound analyte amounts of the ligand and negative control experiment are compared to each other. This comparison reveals the proportion of free and ligand-bound analyte at equilibrium conditions and thus, allows obtaining an estimate of the binding intensity of tested ligand-analyte pairs.
This method can be performed using purified analyte or cleared analyte expression extracts. Samples can be tested in a high-throughput automated format or manually at lab scale using either 96- or 384-well plate format.
Automated holdup assay protocol
Automated holdup assays were performed on a Tecan Evo200 robot with a 96-tip pipetting head and an 8 needles pipetting arm using MSDVN6B or MZHVNOW plates from Millipore for 96- or 384-well plate formats (HU96 and HU384), respectively. 1.5 ml (HU96 and HU384) of Streptavidin Sepharose High Performance Beads (N° 17-5113-01, GE Healthcare) were equilibrated in 45 ml buffer A (50 mM Tris (pH8.0) / 300 mM NaCl / 10 mM Imidazole / 5 mM DTT). The beads were resuspended by vigorous up and down pipetting prior to be transferred by means of a 8 multipipette or the 96 needles robotic pipetting arm into the appropriate filter plate placed on a vacuum station (MultiScreen vacuum manifold (MAVM 096 OR, Millipore) for the manual protocol or a robot-driven T-Vac vacuum system (Tecan)). 2×150 μl of bead suspension (representing 10 μl of beads (HU96)) or 75 μl of suspension (representing 2.5 μl of beads (HU384)) were aliquoted into the wells of the filter plate. The liquid phase was discarded by vacuum filtration. Beads were equilibrated by adding 30 volumes of buffer A per volume of beads, followed by immediate removal of the buffer by vacuum filtration. This washing step ensures that the beads are perfectly equilibrated. 8 volumes per bead volume of a 42 μM stock solution of biotinylated peptide were transferred into 48 wells (HU96) or 288 wells (HU384) of a filter plate (see Fig. 3a). 8 volumes per bead volume of a 42 μM stock solution of biotin was transferred into the remaining wells of the filter plate serving as negative control. The 96 well protocol requires two 96 well filter plates and two separate holdup assays for testing 96 His-MBP-PDZ domains against one peptide. In case of a 384 well plate holdup assay, each of the 4 × 96 His-MBP-PDZ domains was transferred into 3 wells containing beads saturated with biotinylated peptides and 1 well containing beads saturated with biotin (negative control) allowing to test 96 PDZ domains against 3 peptides on one filter plate (see Figure 3a). According to manufacturers specifications, Streptavidin Sepharose High Performance Beads (N° 17-5113-01, GE Healthcare) have a capacity of 150-300 μM of biotin binding sites (considering equilibrated bedded resin without any extra liquid). With this protocol we assume to saturate the beads with either biotinylated peptides or biotin.
The filter plate containing the biotinylated peptide-resin and biotin-resin mixes was transferred onto a multiwell plate shaker and incubated under vigorous agitation at 1200 rpm for 15 minutes. After saturation of the beads with biotinylated peptide or biotin, the liquid phase was removed by vacuum filtration. Remaining free streptavidin sites on the beads were blocked by incubating a 1 mM biotin solution in every well under agitation at 1200 rpm for 15 minutes. Liquid phases were extracted by vacuum filtration.
2 volumes per resin volume of a 4 μM His-MBP-PDZ domain solution (analytes) were transferred into the filter plate. Analytes can be provided either as purified samples or cleared soluble E. coli overexpression extracts both adjusted to 4 μM with buffer A. The bacterial overexpression extracts all contain 17.25 μM lysozyme provided by the lysis buffer (see chapter Lysis of the 80 μl aliquot and quantification of His-MBP-PDZ domains). Successive dilutions for adjusting the His-MBP-PDZ concentration in the extracts to 4 μM were performed with lysis buffer also containing 17.25 μM lysozyme, thereby providing a reference lysozyme peak for internal normalization during data treatment. Experiments using purified His-MBP-PDZ domains had not been provided with a lysozyme reference for internal normalization.
At this step we assume that the biotinylated peptide concentration in the resin-PDZ mix is about 75 μM and therefore in a 20-fold excess as compared to the His-MBP-PDZ domain concentration. In such conditions, assuming that the His-MBP-PDZ domains in the mix are active to 100%, the fraction of His-MBP-PDZ domain, which will bind to the biotinylated peptides and therefore be retained on the resin, will be more than 90% for any domain-peptide pair displaying a dissociation constant (KD) better than 8 μM.
The plate with the His-MBP-PDZ-peptide mixes was incubated under vigorous agitation at 1200 rpm for 15 minutes. During this incubation step the interaction between domain and peptide reaches its equilibrium in solution. Longer incubation times (30 or 60 mn) do not change the result of the assay (Charbonnier et al.11, and data not shown). After this incubation the liquid phase is rapidly collected by filtration and collected into a 384 or 96 well PCR plate according to the format of the used filter plate. To ensure precise and reproducible volumes of filtered liquid, an extra centrifugation step is performed for the HU384. The filtered flow-throughs were blocked with LabChip GX II sample buffer according to manufacturers instructions. Alternatively, they can be blocked with SDS-PAGE sample buffer, which can be used either for qualitative SDS-PAGE analysis, but could alternatively be diluted with LabChip GX II sample buffer for quantitative microfluidic capillary gel electrophoresis analysis. Blocked samples were boiled at 95°C for 6 minutes and samples were either subjected directly to LabChip GX II capillary gel electrophoresis or stored at -20° prior to migration.
Manual holdup assay protocol
The above automated holdup assay protocol using 96 well or 384 well formats on Tecan robots can be performed at laboratory scale using 8 channel micropipettes with variable tip spacing, a Vacuum Manifold Device (MultiScreen vacuum manifold (MAVM 096 OR, Millipore) and a MS3 Digital muliwell plate shaker (IKA Werke GmbH & Co KG, Germany). At lab scale, experimental samples can be qualitatively analyzed using SDS-PAGE or quantitatively with microfluidic capillary gel electrophoresis.
Validation of holdup assay (Fig. 2a and b)
The 210 benchmark PDZ-peptide pairs were analyzed using the standard 96 well automated holdup assay protocol. The experiments were performed in monoplicate in two different conditions (using purified proteins or extracts).
Holdup experiment using serial dilutions to improve differentiation of high affinity interactions
This experiment (Fig 2c) was performed in 96 well format using crude extracts of the MBP-SCRIB-34/4 tandem construct from the benchmarking experiments adjusted to 4 μM stock concentration. 10 batches of 50 μl of streptavidin beads were batch equilibrated in buffer, saturated with respectively 200 μl of 10 different biotinylated peptide 125 μM stock solutions (16E6_10, 16E6_05, 16E6L/V, TAX1_10, TAX1_05, CLTR2_10, CLTR2_05, TANC1_10, LPP and ZO2). These peptides were selected for their binding intensities to MBP-SCRIB-34/4 ranging from 0.5 – 0.9. The peptide saturated resin batches were resuspended in buffer and varying amounts of beads were aliquoted into a 96 well microtiter filter plate (bead volumes: 25 ml, 6.25 ml, 3.2 ml, 1.9 ml). The beads were saturated with biotin, washed and equilibrated with 2 × 300 μl of buffer as previously described. The different resin aliquots were incubated with 40 μl of varying dilutions of MBP-SCRIB-34/4 extracts (4 μM, 1.3 μM, 0.8 μM, and 0.3 μM, respectively). The remaining steps of the holdup experiment were performed as described above for a standard HU96 assay.
Results have been analyzed using quantitative microfluidic capillary gel electrophoresis. Binding intensities (BI) have been calculated as described in section “Principles and automation of binding intensity calculation” (see Supplementary Data 1 and 2 (folder “dilution”)).
PDZome profiling experiments (Fig. 4)
PDZome profiling experiments in 96-well format were reproduced up to nine times, allowing us to obtain the first profiles and to standardize the assay. The PDZome profiling experiments in 384-well format were systematically performed in triplicate. The total triplicated 384-well experiment was reproduced thrice for HPV16 and twice for HPV18. Fig. 4 show the results of one such triplicated experiment. For each PDZ-peptide pair, the number of repeated measurements (3,2 or 1) that were retained after data curation (see below) for calculating the average BI value is indicated in Supplementary Table 3.
Quantitative analysis using microfluidic capillary gel electrophoresis
Preparation of samples for microfluidic capillary gel electrophoresis measurements
96 well or 384 well PCR plates containing the blocked and boiled holdup assay samples were directly loaded and measured on a LabChip GX II machine (Caliper, Perkin Elmer) equipped with an HT protein express labchip (760499). The high sensitivity10-100 kDa protocol was applied, according to the manufacturers instructions.
Principles of microfluidic capillary gel electrophoresis
Filtrates obtained from holdup experiments are denatured and labeled with fluorescent dyes and subjected to microfluidic capillary electrophoresis resulting in a separation of the proteins of the injected sample based on their molecular mass. During separation, labeled proteins pass a laser that excites the attached fluorescent dyes. Emitted fluorescence signals of labeled proteins can be displayed versus the time in electropherograms produced by the LabChip GX II software. Using internal standard markers, the LabChip GX II software calculates the molecular mass of proteins in the sample and quantifies their concentration. Thus, the time axis can be converted into an axis of protein sizes (see Fig. 1b for an example electropherogram of two overlaid injections).
Manual curation of data prior to binding intensity calculations
Each holdup plate injected in the LabChip GX II device was visually inspected using the LabChip GX II software. During this step incorrect internal standard markers were excluded and replaced by correct ones when applicable. Invalid holdup measurements were identified and excluded. Main criteria for exclusion were: distorted or unrecognizable electropherograms; absence of correct internal standard markers; bands of his-MBP-PDZ and/or lysozyme absent, unrecognized or degraded; signal of MBP too close to background noise in the negative control samples. After this visual curation the data points were labelled either “yes” (accepted for treatment) or “no” (excluded). On the accepted data points, windows of protein sizes containing His-MPB-PDZ peaks (usually between 50 and 70 kDa) and standard peaks (usually between 10 and 20 kDa) (see next paragraph) were defined. Finally, all electropherogram data of that holdup plate containing the fluorescence signals versus time and protein size were exported in simple text format for further data treatment (see Supplementary Data 1).
Principle and automation of binding intensity calculation
Processing of data exported from LabChip GX II software as well as binding intensity calculations have been fully automated and implemented in python (www.python.org). For automatic peak identification, we used exported protein size data determined by the LabChip GX II software including corrections for signal shifts occurring during LabChip GX II measurements. To automatically estimate the amount of unbound His-MBP-PDZ domain or standard peaks from exported electropherogram data, we used the maximal height of the fluorescence signals of the corresponding peaks instead of the areas of the peaks. Maximal heights of peaks have been identified by searching the maximal fluorescence signal within the defined protein size windows (see previous paragraph).
We extracted the maximal fluorescence signals of peaks resulting from incubations of His-MBP-PDZ domains with either biotinylated peptide or a negative control (biotin or None peptide). The more His-MBP-PDZ domain retained on the peptide-coated beads, the smaller the fluorescence peak of the His-MBP-PDZ domain in the collected peptide incubated filtrate as compared to the corresponding fluorescence peak in the negative control filtrate. This difference in signal is directly correlated with the binding strength of His-MBP-PDZ to the biotinylated peptide.
This difference in PDZ peak height is normalized by division with the height of the PDZ peak resulting from the negative control run to take into account variations in PDZ amounts loaded on the well plate. The binding intensity (BI) is defined as:
where Ilig and Ictrl correspond to the maximal fluorescence signals of the His-MBP-PDZ peaks of the biotinylated peptide sample and the negative control sample, respectively.
Input correction - the standard peak method
Slight variations in input quantities between the peptide sample and the corresponding negative control sample (visible by shifts of the fluorescence signals when overlaying peptide and control sample electropherograms, see Fig. 1c) can distort calculated binding intensities. We developed a simple strategy, the standard peak method, which allows input variations to be corrected prior to binding intensity calculation. This method is based on the determination of an α factor to rescale the peptide sample to the negative control signals:
Here, α has been calculated from the fluorescence signal of the protein standard lysozyme that has been added in high and equal amounts to all His-MBP-PDZ extracts:
where Ictrl_st and Ilig_st are the maximal fluorescence signals of the standard peak of the negative control and the peptide sample, respectively.
In case peptide or negative control samples displayed negative fluorescence signals, the multiplication with α would have led to incorrect scaling. Therefore, the minimal fluorescence signals mlig and mctrl determined within a window between 12.5 and 90 kDa were subtracted from the peptide sample and negative control sample, respectively, resulting in the final equation for binding intensity calculation when incorporating input correction:
Validation of automated holdup and the standard peak method
Automated holdup assay and the protocol of binding intensity calculations have been benchmarked on a previously published data set. This data set consists of 210 interactions and non-interactions between 5 His-MBP-PDZ domain constructs and 42 biotinylated C-terminal peptides for which binding intensities had been obtained in a previous study using Surface Plasmon Resonance (BIAcore) 12. Like in that study, normalized Response Units (RUs) obtained for the interaction experiments (see Supplementary Table 1) were used instead of dissociation constants to interpret binding intensities of measured interactions.
Uncorrected binding intensities obtained for crude protein samples using the holdup assay correlate well with the reference binding intensities determined using BIAcore (r=0.69). Better correlations can even be obtained when comparing input-corrected holdup assay binding data with the BIAcore data (r=0.76). This analysis indicates that input correction using standard peaks results in more reliable binding intensities (see Supplementary Data 1 and 2 (folder (“benchmarkHU”) as well as Supplementary Table 1 for exported caliper data, parameters and binding intensities).
Application of automated holdup
Exported Caliper files as well as parameters and binding intensities of measurements of the PDZome vs. HPV16 or 18 E6 done in 96 or 384 well plate format can be found in Supplementary Data 1 and 2 (folders “PDZome_16E6_96” and “PDZome_16_18E6_384”).
Estimation of equilibrium dissociation constants (KD) from holdup binding intensities
In principle, the equilibrium dissociation constant KD) for PDZ - peptide complex formation is calculated as follows:
where Cpdz and Cpept are the concentrations of free PDZ and free peptide, respectively, and Cpept-pdz is the concentration of the complex.
According to the announced capacity of the streptavidin resin (N° 17-5113-01, GE Healthcare) and to our own resin saturation experiments (data not shown), the total peptide concentration (C0pept) in our assay conditions is around 50-100 μM. The concentration of PDZ (C0pdz) is adjusted to approximately 4 μM. Therefore, peptide is in large excess relatively to PDZ, so that the free peptide concentration will remain practically unaltered by the formation of PDZ-peptide complexes, even if these complexes use up the full amount of PDZ present in the reaction. Therefore, the free peptide concentration (Cpept) is approximately equal to the total peptide concentration ( ):
The KD can thus be approximated as follows:
In electropherograms, for a given molecular size (horizontal axis) the concentration of protein is supposed to be proportional to the signal (vertical axis) after subtraction of the background intensity. The concentration of free PDZ, Cpdz, can thus be obtained from the experiment as follows:
where Ilig is the PDZ signal detected in the flow-though after incubation with ligand-saturated resin, Ibg is the background intensity contained within the PDZ signal, and λ is the proportionality factor between PDZ concentration and background-subtracted PDZ signal.
The concentration of bound PDZ, Cpept-pdz, can be obtained from the experiment as follows:
where Ibiot is the signal of the full PDZ present in the reaction, detected in the flow-through of the negative control experiment.
Therefore, each single KD value can be approximated as follows:
| [1] |
On the other hand, the holdup binding intensity (BI) is defined as follows:
Therefore, we have
so that equation [1] can also be written:
| [2] |
While the BI is directly obtained for each PDZ-peptide pair in the experiment, the values of the background correction factor Ibg/Ibiot and the peptide concentration C0pept must be evaluated once for the entire experiment. C0pept should be comprised between 50 and 100 μM; and Ibg/Ibiot should be comprised between 0 and 0.1 since the best binder in our assay has a BI ≈ 0.9. For a precise estimation of these two values, we included in all our experiments three standard PDZ-peptide pairs, for which we had previously published KD values obtained with BIAcore: MAGI1-2/6 - HPV16 E6 (KD = 2.5 μM) 42, 43, 12, SCRIB-3/4 - HPV16 E6 (KD = 3 μM) 12 and SCRIB-3/4 - HPV18 E6 (KD = 12 μM) 12. The best fit between these three KD values and the BIs that we measured for these three standards in the triplicate 384-well plate experiment is obtained with a correction factor Ibg/Ibiot ≈ 0.097 and a peptide concentration C0pept ≈ 86.75 μM. Therefore, these values of Ibg/Ibiot and were used for all KD estimations of triplicate holdup experiments (Supplementary Table 3).
Statistics
Correlations and significances were determined using the stats module of scipy (www.scipy.org). Linear correlations between datasets were assessed using Pearson correlation coefficients. Significance of correlations was calculated using two-tailed Student’s t test. Datasets were not normally distributed (assessed with a combination of the skewtest and kurtosistest, function normaltest of stats module of scipy) but of sufficiently large size (between 192 and 208 data points) to justify the application of this test.
Box-whisker plot
Box-whisker plots (see Fig. 3b) were used to analyze the reproducibility of three categories of automated holdup experiments: repetitions of measurements on different 96-well plates, repetitions of measurements on different 384-well plates, and comparison of measurements performed in 96- and 384-well plate format. For the latter comparison, the correlation value was r = 0.92. Measurements for this analysis were obtained from screening of the PDZome vs HPV16 E6 on 96- and 384-well plates excluding all measurements involving the six control PDZ clones (see paragraph “Control PDZ domains”). Standard deviations (STDs) of repeated measurements of all PDZ-peptide pairs per category were determined and plotted in box-whisker mode thereby allowing the range and distribution of STDs obtained within a given category to be visualized. The number of repetitions available for all PDZ-peptide pairs within a given category varied (mostly either 2 or 3 repetitions). To increase comparability, STDs were determined of all possible pairs of repeated measurements obtained for a given PDZ-peptide pair within a given category. In box-whisker plots we have used the following scheme: lower whisker (error bar): min STD observed (note that this lower whisker is hidden under the lower box margin in all plots of Fig. 3b); lower box margin: 10th percentile, black line: median, upper box margin: 90th percentile, upper whisker (error bar): max STD observed.
Validation of interactions in mammalian cells
Cell lines
Hela ws cells were obtained from the cell culture platform of the IGBMC (Illkirch), which regularly checks the authenticity of cell lines. Absence of mycoplasms in the cells was regularly verified.
Cell culture
Hela ws cells were grown and maintained in Dulbecco’s Modified Eagle’s Medium (DMEM), supplemented with 10% FCS and 50μg/ml of gentamycin at 37°C with 5% CO2 and 95% humidity.
Cloning and Plasmids
The two ORFs encoding for HPV16 E6 and HPV18 E6 were amplified by PCR and cloned into vector pDONR207 by recombinational cloning system (Gateway recombinational cloning system, Invitrogen). The resulting Entry clones were then transferred into Gateway compatible GPCA destination vector pSPICA-N2. ORFs encoding for full-length PDZ proteins or PDZ domains were obtained from the Human ORFeome resource (Center for Cancer Systems Biology, Dana-Farber Cancer Institute, Boston) and PDZ domains collections respectively and directly transferred into the Gateway compatible GPCA destination vector pSPICA-N1.
GPCA vectors pSPICA-N1 and pSPICA-N2 (both derived from the pCiNeo mammalian expression vector) respectively express the Gluc1 and Gluc2 complementary fragments of the Gaussia princeps luciferase linked to the N-terminal ends of tested proteins by a flexible hinge polypeptide of 20 amino acid residues. To normalize expression levels, a Kozak consensus translation start sequence was included at the N-terminal end of the fusion protein 18. N-terminal and C-terminal end sequences and orientation of DNA constructs were verified by GATC DNA sequencing.
GPCA experiment
Hela ws cells were seeded in white 96-well plates at a concentration of 2×10⁴ cells per well. After 24 h, cells were transfected using JetPEI® (Polyplus transfection) with 100 ng of pSPICA-N2 expressing HPV16 or HPV18 E6 and 100 ng of pSPICA-N1 expressing full length PDZ protein or PDZ domain. At 24 h post-transfection, cells were washed with 50 μl of PBS and harvested with 40 μl per well of Renilla Lysis Buffer (Promega, E2820) for 30 min. Gaussia princeps luciferase enzymatic activity was measured using a Berthold Centro LB960 luminometer by injecting 50 μl per well of luciferase substrate reagent (Promega, E2820) and counting luminescence for 10 seconds. GPCA experiments were performed in duplicate. Results were expressed as a fold change normalized over the sum of controls, specified herein as Normalized Luminescence Ratio (NLR) 18. For a given protein pair A–B, the “pSPICA-N1-A + pSPICA-N2-B” couple luminescence activity was divided by the sum of luminescence activity for negative controls “pSPICA-N1-A + empty pSPICA-N2” and “empty pSPICA-N1 + pSPICA-N2-B”. According to a previous benchmarking study of the GPCA approach 18, the pairs with NLR > 3.5 have a probability P > 97.5% to be true interactors. Conversely, NLR < 3.5 does not mean “no interaction”. It means “the probability that this is a true interaction is below 97.5%”.
The GPCA experiments (Fig. 4 and Supplemental Table 11) were performed on 52 PDZ domains and 17 human proteins. These experiments are performed in duplicate within one single experiment performed the same day with the same batch of cells. The data shown correspond to one such duplicated experiment. The resulting standard deviations are reported in Table 11. The entire experiment was repeated twice and yielded very comparable results each time.
Bioinformatics analysis
Search for residues of PDZ domains that are either preferred or disliked for E6 binding
For this analysis we considered all PDZ domains that gave a reliable measurement for both HPV18 E6 and HPV16 E6 (209 PDZs in total). We assigned to each of these 209 PDZs the greater BI that this PDZ obtained from its binding to 18 and 16E6 (Supplementary Table 7). Negative BIs were put to zero. Next, the 209 PDZ domains were aligned using ClustalW (http://www.clustal.org/). The resulting alignment was manually corrected and refined using Jalview (http://www.jalview.org/) and available structural information of PDZ domains from the PDB. The aligned sequences were then ranked from highest to lowest BI (Supplementary Fig. 6). For each amino acid at each alignment position, we built a cumulative count by adding one if the given PDZ domain had that specific amino acid at that particular alignment position, or adding zero otherwise. The count was performed by starting from the bottom of the alignement (lowest BIs). This cumulative count was then normalized by division with the total number of PDZ domains that had this amino acid at this alignment position. If an amino acid x at alignment position y is strongly supporting binding to E6, one would expect a distribution of the cumulative count staying close to zero for PDZ domains that did not bind to E6 and then rising for PDZ domains that bound E6. This distribution can be plotted as a function f(x, y) versus the ordered PDZ domains (Supplementary Fig. 7a). The stronger the selection of amino acid x for E6 binding, the lower the area under the plotted curve (AUC). Amino acids that do not play a direct role for E6 binding would result in an AUC around 104 (209*1/2). Amino acids that are strongly disliked for E6 binding would result in an AUC greater than 104.
Which AUCs are significantly different from random? The random distribution of such AUCs depends on the residue count (i.e. a distribution of random AUCs is different for residue counts of 10 versus 200). For each possible count between 1 and 209 we performed 10,000 randomizations (randomly assigning 1 n-times on 209 positions) resulting in 10,000 AUCs defining a random distribution of AUCs for a specific count of residues. To determine the significance of an AUC found for a real residue x at alignment position y, its AUC was compared to the corresponding random distribution and a p-value calculated representing the likeliness of randomly finding an AUC as extreme as the one observed (Supplementary Fig. 7b). Using a p-value cutoff of 0.001, 21 residues (including a gap) at 20 specific alignment positions were found to be significantly correlated with either preferred or disliked binding to E6 (Supplementary Table 8, the z-score indicates whether observed AUCs had been lower (preference for E6 binding) than random distributions or greater).
Search for residue positions in PDZ domains that correlate with a preferred binding to the C-terminal peptide of HPV18 E6 (18E6) vs. HPV16 E6 (16E6)
All PDZ domains, which bound to HPV16 or HPV18 E6 with a BI >= 0.1 were taken into consideration for this analysis (60 PDZs in total). For each of these PDZ domains the difference in BI for HPV18 vs HPV16 E6 (ΔBI) was determined (Supplementary Table 9). Negative BIs were set to zero prior to difference calculation. The protein sequences of these PDZ domains were aligned (see Supplementary Fig. 8) as described before. The aligned sequences were ranked from highest to lowest ΔBI. We used four of five amino acid indices published by Atchley et al. 16 (we excluded index 4), to transform amino acids in the PDZ alignment into numerical values representing different physico-chemical amino acid properties. Index 1 represents polarity, index 2 secondary structure propensity, index 3 molecular size, and index 5 electrostatic charge.
We systematically searched for correlations between differences in BI of PDZ domains and each of the 4 amino acid indices for each column in the PDZ alignment where at least half of the PDZ domains did not have a gap. Pearson correlation coefficients and p-values were calculated for each set of data points using the stats module of scipy (www.scipy.org). P-values were corrected for multiple testing. Using a p-value cutoff of 0.01 13 different alignment positions were found to significantly correlate with differences in BI values using at least one of the 4 indices (see Supplementary Table 10).
We controlled for the significance of these correlations by performing 100,000 randomizations using the random module of python (www.python.org). We randomly assigned, to all the PDZ domains used in this analysis, BI values selected from within the range of BIs observed from the real data. Significantly correlated domain positions had been determined as described above.
Pymol (www.pymol.org) was used to create figures of PDZ structures with highlighted domain positions.
Search for occurrences of PDZ proteins binding 18 or 16E6 in oncogene and tumor suppressor data
We determined all PDZ proteins that had at least one PDZ domain binding to 18E6 or 16E6 with a BI >= 0.2 (30 PDZ proteins in total out of 118 in this study, see Supplementary Table 11).
We used two lists of genes annotated to be drivers in cancerogenesis from Vogelstein et al. 43 and which were either observed to be modified in cancer via non-synonymous mutations or copy number variations. None of the PDZ proteins found to bind 18 or 16E6 in our assay occurred in these two lists.
We also used a list of driver genes in cancer as annotated from the Sanger Cancer Gene Consensus (http://cancer.sanger.ac.uk/cancergenome/projects/census/). ARHGEF12 was the only PDZ protein found to bind E6 and occurring in this list of drivers. From this annotation it is unclear whether it belongs to the tumor suppressor or oncogene class.
Last, we used annotations of genes found to be significantly altered in different cancer types via somatic copy number alterations as made publicly available by Tumorscape 19. We focussed on those genes that were significantly altered (q value <= 0.25) and were predicted to be in a peak region (as defined by Beroukhim et al. 19). This allowed us to obtain, for the 118 PDZ proteins of our assay (binding HPV 18 or 16 E6 or not), a list (Supplementary Table 12) of the cancer types in which the genes of these proteins have been observed to be significantly altered (separated into amplified or deleted) and to occur within a peak region.
Supplementary Material
Acknowledgments
This work was supported by institutional support from CNRS, Université de Strasbourg, Infrastructures Biologie Santé et Agronomie (Ibisa), and grants from Association pour la Recherche contre le Cancer (ARC) (n° 3171), Agence Nationale de la Recherche (ANR-MIME-2007 EPI-HPV-3D), US National Institute of Health (NIH grant R01CA134737), and Ligue contre le Cancer. K.L. was supported by grants of Région Alsace and ARC. J. Poirson was supported by a grant of the Ligue Régionale contre le Cancer. JPB is supported in part by grants from La Ligue Contre le Cancer, Institut paoli-Calmettes, Cancéropôle PACA and by SIRIC (INCa-DGOS-Inserm 6038). JPB is a scholar of Institut Universitaire de France. We thank the CCSB (Harvard University) for kindly providing clones of the human ORFeome and T. Rolland, M.A. Delsuc, D. Altschuh, B. Kieffer, A. Dejaegere and all members of the “Oncoproteins” team for helpful discussions and advice.
Footnotes
Author contributions:
G.T. conceived the project and raised funding for it. G.T., S.C. and R.V. supervised the project. R.V. and S.C. developed the robotized holdup assay. K.L. designed and performed all computational data treatment and bioinformatics analysis. R.V., M.B., J.A., F.I., K.R. performed high-throughput protein cloning and expression and high-throughput holdup assays. S.C., M.L.S. and K.L. curated the data. J.Poirson, A.F., P.C., Y.J. and M.M. performed the GPCA experiments. J. Polanowska, J.R. and J.P.B. provided the ’A’ PDZome resource. Y.N. provided expertise in data treatment. G.T., K.L., S.C. and N.W. interpreted the data. K.L., S.C., J. Poirson and G.T. prepared the figures. K.L., S.C., R.V., J.Poirson and GT wrote the Online Methods. K.L., G.T. and Ju.P. prepared the supplemental material. G.T. wrote the main text.
COMPETING FINANCIAL INTERESTS
The authors declare no competing financial interests.
References
- 1.Nash PD. Why modules matter. FEBS Lett. 2012;586:2572–4. doi: 10.1016/j.febslet.2012.04.049. [DOI] [PubMed] [Google Scholar]
- 2.Diella F, et al. Understanding eukaryotic linear motifs and their role in cell signaling and regulation. Front Biosci. 2008;13:6580–603. doi: 10.2741/3175. [DOI] [PubMed] [Google Scholar]
- 3.Lievens S, Eyckerman S, Lemmens I, Tavernier J. Large-scale protein interactome mapping: strategies and opportunities. Expert Rev Proteomics. 2010;7:679–690. doi: 10.1586/epr.10.30. [DOI] [PubMed] [Google Scholar]
- 4.Weatheritt RJ, Luck K, Petsalaki E, Davey NE, Gibson TJ. The identification of short linear motif-mediated interfaces within the human interactome. Bioinformatics. 2012;28:976–982. doi: 10.1093/bioinformatics/bts072. [DOI] [PMC free article] [PubMed] [Google Scholar]
- 5.Jadwin JA, Ogiue-Ikeda M, Machida K. The application of modular protein domains in proteomics. FEBS Lett. 2012;586:2586–96. doi: 10.1016/j.febslet.2012.04.019. [DOI] [PMC free article] [PubMed] [Google Scholar]
- 6.Doyle DA, et al. Crystal structures of a complexed and peptide-free membrane protein-binding domain: molecular basis of peptide recognition by PDZ. Cell. 1996;85:1067–76. doi: 10.1016/s0092-8674(00)81307-0. [DOI] [PubMed] [Google Scholar]
- 7.Luck K, Charbonnier S, Trave G. The emerging contribution of sequence context to the specificity of protein interactions mediated by PDZ domains. FEBS Lett. 2012;586:2648–61. doi: 10.1016/j.febslet.2012.03.056. [DOI] [PubMed] [Google Scholar]
- 8.Nourry C, Grant SG, Borg JP. PDZ domain proteins: plug and play! Sci STKE. 2003;2003:RE7. doi: 10.1126/stke.2003.179.re7. [DOI] [PubMed] [Google Scholar]
- 9.Iden S, Collard JG. Crosstalk between small GTPases and polarity proteins in cell polarization. Nat Rev Mol Cell Biol. 2008;11:846–59. doi: 10.1038/nrm2521. [DOI] [PubMed] [Google Scholar]
- 10.Javier RT, Rice AP. Emerging theme: cellular PDZ proteins as common targets of pathogenic viruses. J Virol. 2011;85:11544–56. doi: 10.1128/JVI.05410-11. [DOI] [PMC free article] [PubMed] [Google Scholar]
- 11.Charbonnier S, Zanier K, Masson M, Trave G. Capturing protein-protein complexes at equilibrium: the holdup comparative chromatographic retention assay. Protein Expr Purif. 2006;50:89–101. doi: 10.1016/j.pep.2006.06.010. [DOI] [PubMed] [Google Scholar]
- 12.Luck K, et al. Putting into practice domain-linear motif interaction predictions for exploration of protein networks. PLoS One. 2011;6:e25376. doi: 10.1371/journal.pone.0025376. [DOI] [PMC free article] [PubMed] [Google Scholar]
- 13.Stiffler MA, et al. PDZ domain binding selectivity is optimized across the mouse proteome. Science. 2007;317:364–9. doi: 10.1126/science.1144592. [DOI] [PMC free article] [PubMed] [Google Scholar]
- 14.Kranjec C, Banks L. A systematic analysis of human papillomavirus (HPV) E6 PDZ substrates identifies MAGI-1 as a major target of HPV type 16 (HPV-16) and HPV-18 whose loss accompanies disruption of tight junctions. J Virol. 2011;85:1757–64. doi: 10.1128/JVI.01756-10. [DOI] [PMC free article] [PubMed] [Google Scholar]
- 15.Zanier K, et al. Solution structure analysis of the HPV16 E6 oncoprotein reveals a self-association mechanism required for E6-mediated degradation of p53. Structure. 2012;20:604–17. doi: 10.1016/j.str.2012.02.001. [DOI] [PMC free article] [PubMed] [Google Scholar]
- 16.Atchley WR, Zhao J, Fernandes AD, Drüke T. Solving the protein sequence metric problem. Proc Natl Acad Sci U S A. 2005;102:6395–400. doi: 10.1073/pnas.0408677102. [DOI] [PMC free article] [PubMed] [Google Scholar]
- 17.Belotti E, et al. The human PDZome: a gateway to PDZ mediated functions. Mol Cell Proteomics. 2013;12:2587–603. doi: 10.1074/mcp.O112.021022. [DOI] [PMC free article] [PubMed] [Google Scholar]
- 18.Cassonnet P, et al. Benchmarking a luciferase complementation assay for detecting protein complexes. Nat Methods. 2011;8:990–2. doi: 10.1038/nmeth.1773. [DOI] [PubMed] [Google Scholar]
- 19.Beroukhim R, et al. The landscape of somatic copy-number alteration across human cancers. Nature. 2010;463:899–905. doi: 10.1038/nature08822. [DOI] [PMC free article] [PubMed] [Google Scholar]
- 20.Zaric J, et al. Identification of MAGI1 as a tumor-suppressor protein induced by cyclooxygenase-2 inhibitors in colorectal cancer cells. Oncogene. 2012;31:48–59. doi: 10.1038/onc.2011.218. [DOI] [PubMed] [Google Scholar]
- 21.Lee SJ, et al. MAGI-3 competes with NHERF-2 to negatively regulate LPA2 receptor signaling in colon cancer cells. Gastroenterology. 2011;140:924–34. doi: 10.1053/j.gastro.2010.11.054. [DOI] [PMC free article] [PubMed] [Google Scholar]
- 22.Valiente M, et al. Binding of PTEN to specific PDZ domains contributes to PTEN protein stability and phosphorylation by microtubule-associated serine/threonine kinases. J Biol Chem. 2005;280:28936–43. doi: 10.1074/jbc.M504761200. [DOI] [PubMed] [Google Scholar]
- 23.Kotelevets L, et al. Implication of the MAGI-1b/PTEN signalosome in stabilization of adherens junctions and suppression of invasiveness. FASEB J. 2005;19:115–7. doi: 10.1096/fj.04-1942fje. [DOI] [PubMed] [Google Scholar]
- 24.Ellenbroek SI, Iden S, Collard JG. Cell polarity proteins and cancer. Semin Cancer Biol. 2012;22:208–15. doi: 10.1016/j.semcancer.2012.02.012. [DOI] [PubMed] [Google Scholar]
- 25.Roberts S, Delury C, Marsh E. The PDZ protein discs-large (DLG): the ’Jekyll and Hyde’ of the epithelial polarity proteins. FEBS J. 2012;279:3549–58. doi: 10.1111/j.1742-4658.2012.08729.x. [DOI] [PubMed] [Google Scholar]
- 26.Ong DC, et al. LARG at chromosome 11q23 has functional characteristics of a tumor suppressor in human breast and colorectal cancer. Oncogene. 2009;28:4189–200. doi: 10.1038/onc.2009.266. [DOI] [PMC free article] [PubMed] [Google Scholar]
- 27.Thomas M, Banks L. PDZRN3/LNX3 is a novel target of human papillomavirus type 16 (HPV-16) and HPV-18 E6. J Virol. 2015;89:1439–44. doi: 10.1128/JVI.01743-14. [DOI] [PMC free article] [PubMed] [Google Scholar]
- 28.Hu H, et al. A map of WW domain family interactions. Proteomics. 2004;4:643–55. doi: 10.1002/pmic.200300632. [DOI] [PubMed] [Google Scholar]
- 29.Landgraf C, et al. Protein interaction networks by proteome peptide scanning. PLoS Biol. 2004;2:E14. doi: 10.1371/journal.pbio.0020014. [DOI] [PMC free article] [PubMed] [Google Scholar]
- 30.Kaushansky A, et al. Quantifying protein-protein interactions in high throughput using protein domain microarrays. Nat Protoc. 2010;5:773–790. doi: 10.1038/nprot.2010.36. [DOI] [PMC free article] [PubMed] [Google Scholar]
- 31.Babault N, et al. Peptides targeting the PDZ domain of PTPN4 are efficient inducers of glioblastoma cell death. Structure. 2011;19:1518–1524. doi: 10.1016/j.str.2011.07.007. [DOI] [PubMed] [Google Scholar]
- 32.Perkins JR, Diboun I, Dessailly BH, Lees JG, Orengo C. Transient protein-protein interactions: structural, functional, and network properties. Structure. 2010;18:1233–43. doi: 10.1016/j.str.2010.08.007. [DOI] [PubMed] [Google Scholar]
- 33.Gerber D, Maerkl SJ, Quake SR. An in vitro microfluidic approach to generating protein-interaction networks. Nat Methods. 2009;6:71–4. doi: 10.1038/nmeth.1289. [DOI] [PMC free article] [PubMed] [Google Scholar]
- 34.Hause RJ, Jr, et al. Comprehensive binary interaction mapping of SH2 domains via fluorescence polarization reveals novel functional diversification of ErbB receptors. PLoS One. 2012;7:e44471. doi: 10.1371/journal.pone.0044471. [DOI] [PMC free article] [PubMed] [Google Scholar]
- 35.Velázquez Campoy A, Freire E. ITC in the post-genomic era…? Priceless. Biophys Chem. 2005;115:115–124. doi: 10.1016/j.bpc.2004.12.015. [DOI] [PubMed] [Google Scholar]
- 36.Rich RL, Myszka DG. Advances in surface plasmon resonance biosensor analysis. Curr Opin Biotechnol. 2000;11:54–61. doi: 10.1016/s0958-1669(99)00054-3. [DOI] [PubMed] [Google Scholar]
- 37.Weiser AA, et al. SPOT synthesis: reliability of array-based measurement of peptide binding affinity. Anal Biochem. 2005;342:300–11. doi: 10.1016/j.ab.2005.04.033. [DOI] [PubMed] [Google Scholar]
- 38.Vincentelli R, et al. High-throughput protein expression screening and purification in Escherichia coli. Methods. 2011;55:65–72. doi: 10.1016/j.ymeth.2011.08.010. [DOI] [PubMed] [Google Scholar]
- 39.Saez NJ, Vincentelli R. High-throughput expression screening and purification of recombinant proteins in E. coli. Methods Mol Biol. 2014;1091:33–53. doi: 10.1007/978-1-62703-691-7_3. [DOI] [PubMed] [Google Scholar]
- 40.Tropea JE, Cherry S, Nallamsetty S, Bignon C, Waugh DS. A generic method for the production of recombinant proteins in Escherichia coli using a dual hexahistidine-maltose-binding protein affinity tag. Methods Mol Biol. 2007;363:1–19. doi: 10.1007/978-1-59745-209-0_1. [DOI] [PubMed] [Google Scholar]
- 41.Nominé Y, et al. A strategy for optimizing the monodispersity of fusion proteins: application to purification of recombinant HPV E6 oncoprotein. Protein Eng. 2001;14:297–305. doi: 10.1093/protein/14.4.297. [DOI] [PubMed] [Google Scholar]
- 42.Fournane S, et al. Surface plasmon resonance analysis of the binding of high-risk mucosal HPV E6 oncoproteins to the PDZ1 domain of the tight junction protein MAGI-1. J Mol Recognit. 2011;24:511–23. doi: 10.1002/jmr.1056. [DOI] [PubMed] [Google Scholar]
- 43.Charbonnier S, et al. The structural and dynamic response of MAGI-1 PDZ1 with noncanonical domain boundaries to the binding of human papillomavirus E6. J Mol Biol. 2011;406:745–63. doi: 10.1016/j.jmb.2011.01.015. [DOI] [PubMed] [Google Scholar]
- 44.Vogelstein B, et al. Cancer genome landscapes. Science. 2013;339:1546–58. doi: 10.1126/science.1235122. [DOI] [PMC free article] [PubMed] [Google Scholar]
Associated Data
This section collects any data citations, data availability statements, or supplementary materials included in this article.