Summary
DNA methylation at selective cytosine residues (5mC) and their removal by TET-mediated DNA demethylation are critical for setting up pluripotent states in early embryonic development1–2. TET enzymes successively convert 5mC to 5hmC, 5fC, and 5caC, the latter two of which are subject to removal by thymine DNA glycosylase (TDG) in conjunction with base excision repair1–6. Early reports indicate that 5fC and 5caC could be stably detected on enhancers, promoters, and gene bodies with distinct effects on gene expression, but the mechanisms have remained elusive7,8. Here we determined the X-ray crystal structure of elongating Pol II in complex with DNA template containing oxidized 5-methylcytosines (oxi-mCs), revealing specific hydrogen bonds between the 5-carboxyl group of 5caC and the conserved epi-DNA recognition loop in the polymerase. This causes a positional shift for incoming NTP thus compromising nucleotide addition. To test the in vivo significance of this structural insight, we determined the global effect of increased 5fC/5caC levels on transcription, finding that such DNA modifications indeed retarded Pol II elongation on gene bodies. These results demonstrate the functional impact of oxi-mCs on gene expression and suggest a novel role for Pol II to function as a specific and direct epigenetic sensor during transcription elongation.
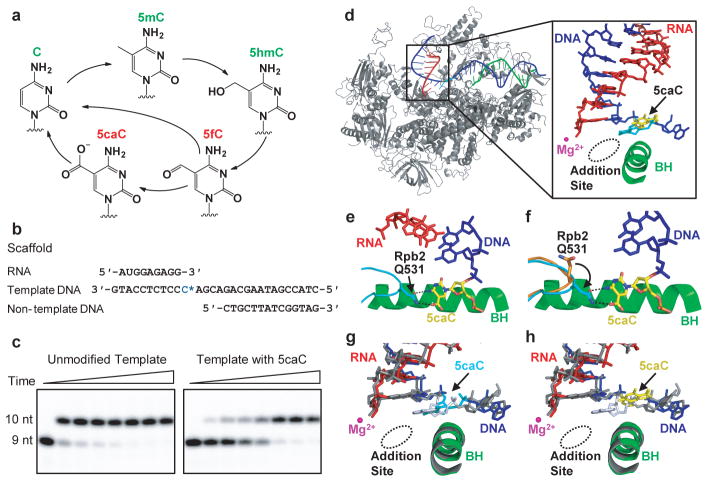
Epigenetic DNA methylation (5mC) is an important regulator of gene transcription recognized by several families of protein readers, such as methyl-CpG-binding domain proteins (MBDs) and ubiquitin-like PHD and RING finger domain containing proteins (UHRF1), and certain zinc-finger proteins (Kaiso)9,10. TET enzymes iteratively oxidize 5mC to 5-hydroxymethylcytosine (5hmC), 5-formylcytosine (5fC), and 5-carboxylcytosine (5caC)3–6, and TDG coupled with base excision repair further process 5fC/5caC to complete DNA demethylation (Fig. 1a)5,6. An open question is whether 5fC and 5caC are simple DNA demethylation intermediates or have active roles in gene expression.
Figure 1.
Pol II directly recognizes 5caC during transcription. a, Epigenetic modification cycle of cytosine. Cytosine (C), 5-methylcytosine (5mC), 5-hydroxylmethylcytosine (5hmC), 5-formylcytosine (5fC), and 5-carboxylcytosine (5caC). b, The RNA/DNA scaffold used in both structural and biochemical analysis. C* stands for 5caC residue. c, Impeded Pol II elongation on the 5caC-containing template relative to the unmodified C template. Time points are 0, 5 s, 15 s, 30 s, 1 min, 5 min, 20 min, and 1 hr (left to right). d, The overall Pol II EC structure containing a site-specific 5caC (EC-I). Color-coded are template DNA (blue), non-template DNA (green), and RNA (red). The two 5caC conformers are highlighted in yellow and cyan, respectively. Part of bridge helix (BH) (Rpb1 822–840) is highlighted in green and the rest of Pol II subunits are in gray (Rpb2 is omitted). The addition site is represented by a dotted oval. e, The midway 5caC interacts with the Rpb2 Q531 residue via hydrogen bonds (black dotted lines). The epi-DNA recognition loop (fork loop 3) (Rpb2 521–541) is shown in cyan. f, The Q531 side chain rotates 90 degrees to form hydrogen bonds with 5caC. Pol II EC-I is superimposed with the Pol II EC containing an unmodified DNA template in post-translocation state (PDB: 1SFO). The fork loop 3 region of Pol II EC (1SFO) is shown in orange. g–h, Comparison of two 5caC conformers (cyan or yellow) with the corresponding canonical template nucleotide (bluewhite).
Genomic mapping revealed specific enrichment of 5fC and 5caC at enhancers, promoters, and gene bodies7,8. Moreover, a number of protein complexes involved in transcription, splicing, chromatin remodeling, and DNA repair have been identified to selectively bind synthetic DNA oligonucleotides containing oxidized 5-methylcytosines (oxi-mCs)11–13. Our early study indicates that these modifications induce transient pausing of purified yeast and mammalian RNA polymerase II elongation complex (Pol II EC) in vitro14. Together, these observations imply that different oxi-mCs may influence gene expression15. Importantly, our work suggests that Pol II has the capacity to directly sense the demethylation state (oxi-mCs) of template DNA during transcription.
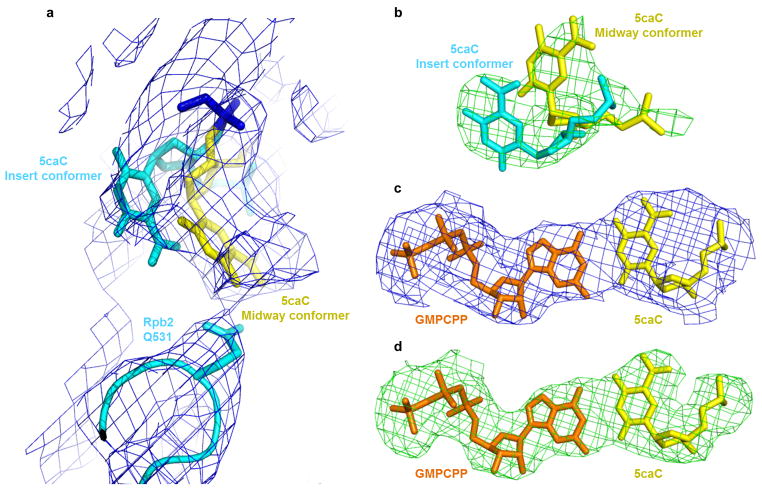
To understand the molecular basis for the Pol II EC to recognize oxi-mCs, we performed structural studies of the complex assembled on an RNA/DNA scaffold that contains a 5caC at the i+1 site (Fig. 1b) to mimic the stage when Pol II EC encounters 5caC during transcription elongation. This scaffold recapitulated the impediment of Pol II elongation in in vitro reactions (Fig. 1c)14. The crystal structure (EC-I) revealed that the upstream RNA/DNA hybrid region maintains a post-translocation state register in which the active site is empty and ready for NTP loading (Fig. 1d). About 50% of 5caC nucleobase (yellow colored in Fig. 1d and 1h, see also Extended Data Fig. 1a and 1b) accommodates at a new translocation intermediate position, located about halfway between the canonical i+1 and i+2 sites. The other 50% of 5caC nucleobase is partially inserted into the i+1 position (cyan colored in Fig. 1d and 1g). Importantly, we detected specific hydrogen bonds between the 5-carboxyl moiety of 5caC and the side chain of residue Q531 at a loop in the fork region of Rpb2 (the second largest subunit) (Fig. 1e and 1f)16. We termed it the “epi-DNA recognition loop” or “fork loop 3”, because it recognizes the epigenetic DNA modification in the major groove and is next to the previously identified fork loop 1 and fork loop 2 within the fork region16. The specific hydrogen bonding interactions with 5caC result in a 90-degree rotation of the side chain of Pol II Rpb2 Q531, switching its interacting partner in the upstream RNA/DNA hybrid region17 to the nucleobase of 5caC at i+1 position register (Fig. 1e and 1f). This causes 5caC to shift into a new translocation intermediate position right above the bridge helix (Fig. 1e, 1f, and 1h), which we termed the “midway position”.
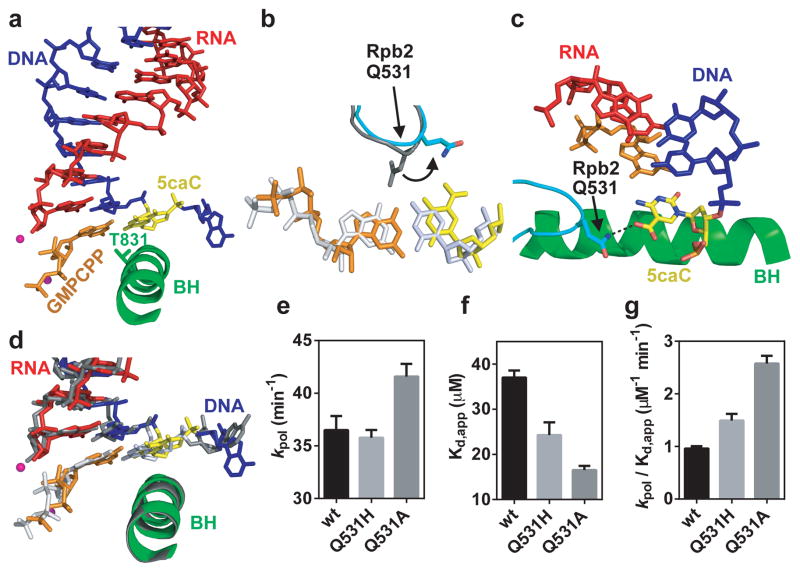
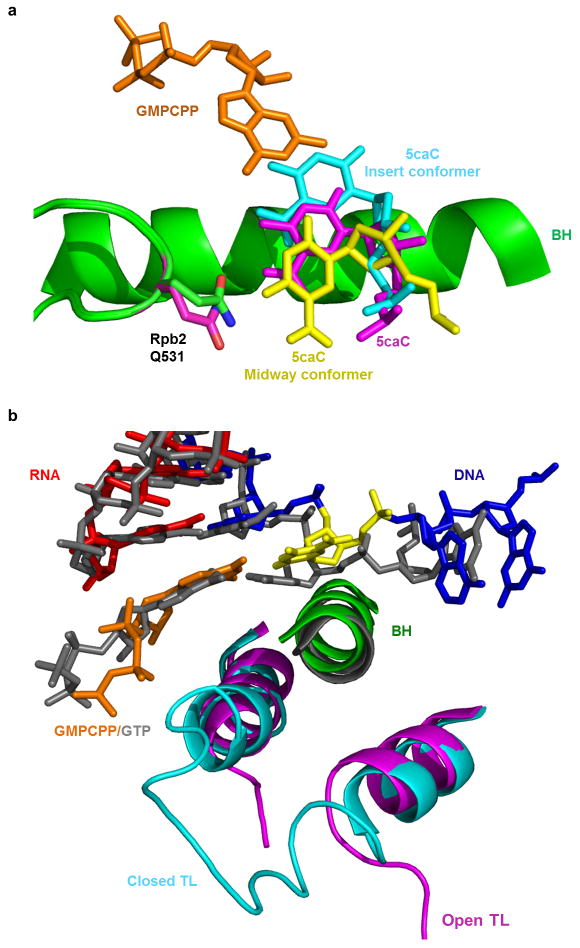
To investigate the potential impact of 5caC on nucleotide incorporation, we next solved the structure of the Pol II EC with a 5caC at i+1 site in the presence of a non-hydrolyzable GTP analogue (GMPCPP) to mimic the state of GTP binding opposite 5caC (EC-II). We found that while 5caC forms a canonical Watson-Crick base pair with GMPCPP (Fig. 2a, Extended Data Fig. 1c and 1d), the base pair shifts to another translocation intermediate position, ~1.5 Å away from its canonical position toward the downstream main channel (Fig. 2b, 2d, and Extended Data Fig. 2a). The interaction between the epi-DNA recognition loop and 5caC likely causes this positional shift (Fig. 2b–d), which disrupts the proper alignment between Rpb1 Leu1081 and substrate as well as the correct positioning of 3′-RNA terminus and substrate that is crucial for full closure of the trigger loop and effective GTP addition17,18. The nucleobase of substrate now misaligns with Rpb1 Thr831 in the bridge helix (Fig. 2a), leading to a partially open conformation of the trigger loop (Extended Data Fig. 2b).
Figure 2.
Interaction between 5caC and epi-DNA recognition loop compromises GTP incorporation. a, The Pol II EC structure containing a matched GMPCPP opposite 5caC site (EC-II). The color codes are the same as Fig. 1 except for 5caC (yellow) and GMPCPP (orange). b–d, The GMPCPP:5caC base pair is shifted toward the downstream main channel from the canonical GMPCPP:dC position (PDB: 2E2J). The side chain of Rpb2 Q531 rotates 100 degrees to interact with 5caC (b and c). e–g, Comparison of catalytic rate constants (kpol) (e), substrate dissociation constants Kd,app (f), and specificity constants (kpol/Kd,app) (g) of GTP incorporation opposite 5caC template by wt, Q531H, and Q531A Pol II, respectively. The mean values are presented and error bars are standard deviations derived from three independent experiments.
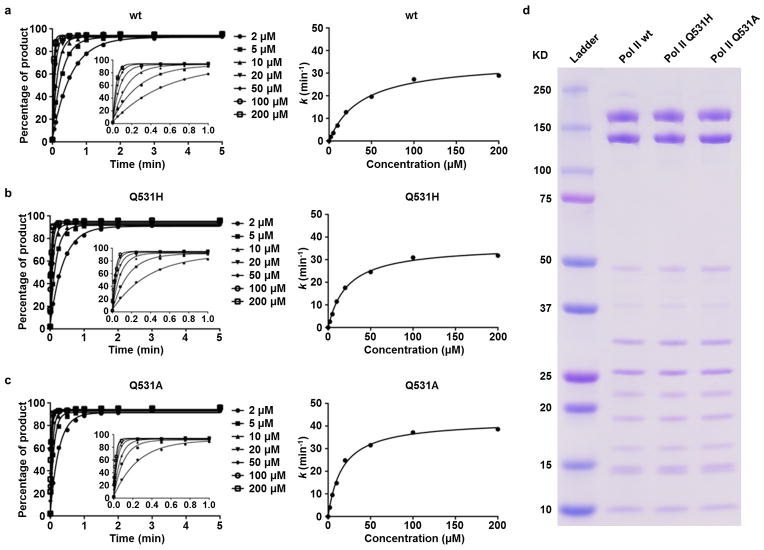
To further determine whether the specific hydrogen-bonding interaction between the Pol II epi-DNA recognition loop (Rpb2 Q531) and 5caC (Fig. 2b and 2c) causes a reduction in GTP addition efficiency, we purified two yeast Pol II point mutants (Rpb2 Q531H and Q531A) and measured GTP incorporation on the 5caC template in comparison with wt Pol II. The Pol II Q531A mutant would abolish the specific hydrogen bonds between the side chain of residue 531 and the 5-carboxyl moiety of 5caC, thus alleviating the negative impact of 5caC on Pol II transcription. In contrast, the Q531H mutant should behave similarly as wt Pol II, as the His residue has the capability to form hydrogen bond with 5caC. Indeed, we observed that the Q531A mutant leads to a 2.6-fold increase in GTP incorporation specificity (kpol/Kd) (p-value < 0.0001, unpaired, two-sided t test) with a faster kpol and a tighter Kd, whereas the Q531H mutant behaves like wt Pol II (Fig. 2e–2g, Extended Data Fig. 3). Consistently, abolishing the specific hydrogen bonding interaction with Pol II epi-DNA recognition loop by removal of the 5-carboxyl moiety of 5caC (replacement of 5caC to unmodified C template) also leads to a 4.2-fold increase in GTP incorporation specificity14. These data demonstrate the functional impact of 5caC on both the rate and specificity of GTP incorporation via Q531 in the Pol II epi-DNA recognition loop.
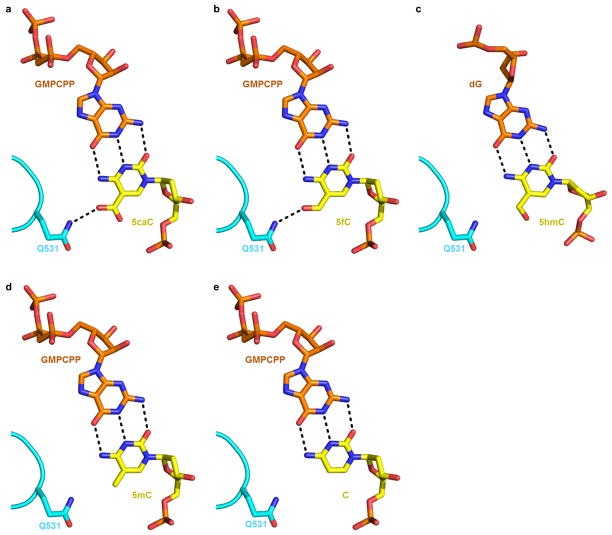
The same epi-DNA recognition loop is equally capable of forming similar interactions with the 5-carbonyl group of 5fC, but not with 5mC or unmodified C (Extended Data Fig. 4). We also modeled the structure of 5hmC (PDB: 4R2C) within the Pol II EC. Interestingly, the 5-hydroxylgroup appears to adapt a different orientation away from the epi-DNA recognition loop (Extended Data Fig. 4c), consistent with less Pol II retardation on a 5hmC template relative to a 5fC/5caC template14. Intriguingly, a recent study revealed that base J (β-D-glucosyl-hydroxymethyluracil), a major groove DNA modification, prevents transcriptional read-through in Leishmania19. We observed a striking similarity between 5fC/5caC and base J on slowing down or stalling Pol II transcription, suggesting a likely universal mechanism for Pol II to sense distinct DNA modifications via the epi-DNA recognition loop15.
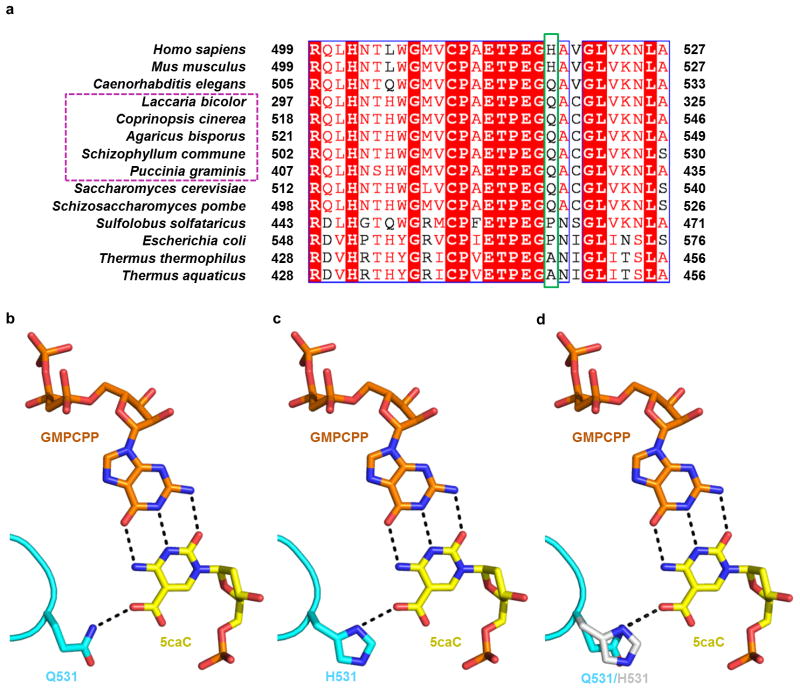
The critical Gln residue (Q531 in yeast Rpb2) is conserved among several fungal species containing active TET/JBP enzymes and oxi-mCs, such as Agaricomycetes and Pucciniomycete, and is substituted by the functionally equivalent His residue in mammals (Extended Data Fig. 5a)20, suggesting that similar interactions between 5caC and the Pol II epi-DNA recognition loop are likely maintained from fungi to humans (Extended Data Fig. 5b–d). Indeed, we observed impeded elongation by human Pol II in HeLa nuclear extracts (Extended Data Fig. 6) and with purified rat Pol II on the 5caC-containing template relative to the unmodified C template14. The conservation of this critical Gln/His residue in eukaryotes coincides with the existence of 5fC/5caC modifications. In contrast, bacteria and archaea RNA polymerases carry Ala or Pro at the corresponding position in the βD loop II region (Extended Data Fig. 5a, see also ref. 21), and consistently, we found that 5caC has no observable effect on E. coli RNA polymerase transcription elongation in vitro (Extended Data Fig. 7, lower panel). It is interesting to note that glycosylated cytosine derivatives are also present in some phage and bacterial DNA genomes, pointing to future investigation to understand how these modifications (bulkier than 5fC/5caC) may be recognized during transcription.
Our structural studies also shed critical lights on the canonical Pol II translocation process by revealing two new translocation intermediate positions of the 5caC template before and after GTP binding. The first translocation intermediate position of 5caC sits above the bridge helix in the absence of GTP. Upon GTP binding, the 5caC template is shifted to a new translocation intermediate position allowing the formation of base pair with incoming GTP. The translocation intermediate states are similar to the translocation intermediate states on unmodified DNA template recently suggested by molecular simulation22. Our ability to capture the crystal structures of these Pol II translocation intermediates suggests that the specific interactions between the Pol II recognition loop (Q531) and the 5-carboxyl group of 5caC stabilize the translocation intermediates that are otherwise too transient to be captured on unmodified DNA template.
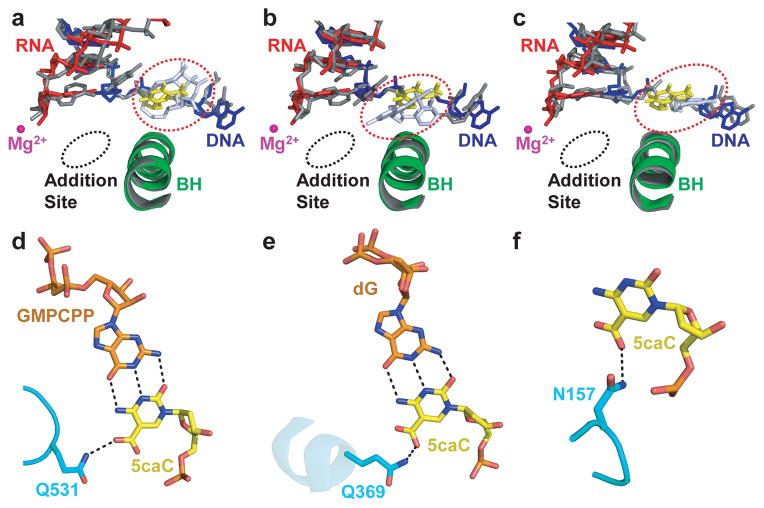
Aligning the structures of 5caC-paused Pol II EC with bulky DNA lesion-arrested or α-amanitin-arrested Pol II EC18,23,24 reveals additional insights into Pol II pausing and arrest. Notably, 5caC, CPD, pyriplatin-dG, and i+1 transition template base in α-amanitin-arrested Pol II EC are all accommodated above the bridge helix (Fig. 3a–c), even though their exact locations, orientations, and interactions of Pol II greatly differ (see Methods). A similar (but not identical) “above-the-bridge-helix” translocation intermediate has also been recently observed in an elemental paused E. coli RNA polymerase structure (ePEC) with a kinked bridge helix to occlude the canonical i+1 template position25. Taken together, we propose that these observations point to a common translocation checkpoint to serve as a rate-limiting step for the transition of DNA template nucleobase to cross over the bridge helix and subsequently insert into the canonical i+1 site to guide RNA synthesis. While DNA lesions have been proposed to interfere with Pol II elongation via steric hindrance26,27, our current data suggest that Pol II can also directly sense epigenetically modified DNA (5caC/5fC) through specific hydrogen bonding interactions.
Figure 3.
Similar “above-the-bridge-helix” translocation intermediates captured in pausing/arrested Pol II ECs and a common 5caC-recognition mode shared by a variety of 5caC-recognition proteins. a–c. Superimposition of 5caC-paused Pol II EC with CPD-lesion-arrested EC (PDB: 4A93) (a), pyriplatin-lesion-arrested EC (PDB: 3M4O) (b), and α-amanitin-arrested EC (PDB: 2VUM) (c), respectively. The similar “above-the-bridge-helix” translocation intermediates region for accommodation of i+1 5caC (yellow) and DNA lesion (or translocation intermediate captured by α-amanitin) (blutewhite) is highlighted by a red-dotted oval. The damage-arrested or α-amanitin-arrested Pol II ECs are shown in gray. d–f, The conserved interactions and residue involved 5caC recognition by Pol II (Rpb 2-Q531) (d), Wilms tumor protein 1 (Q369, PDB: 4R2R) (e), and human thymine DNA glycosylase (N157, PDB: 3UO7) (f).
We further noticed a remarkable mechanistic similarity in 5caC recognition by several unrelated family proteins. For example, the residue Q369 in Wilms tumor (WT1) protein (PDB: 4R2R)13 and the residue N157 in human TDG (PDB: 3UO7)28 are both functionally equivalent to Q/H531 residues in Pol II in recognizing the 5caC carboxyl group via specific hydrogen bonds (Fig. 3d–f). We thus speculate that 5caC could be a potential epigenetic mark for recognition by a variety of “protein readers” (including Pol II itself) via specific hydrogen bonding interactions with its 5-carboxyl moiety.
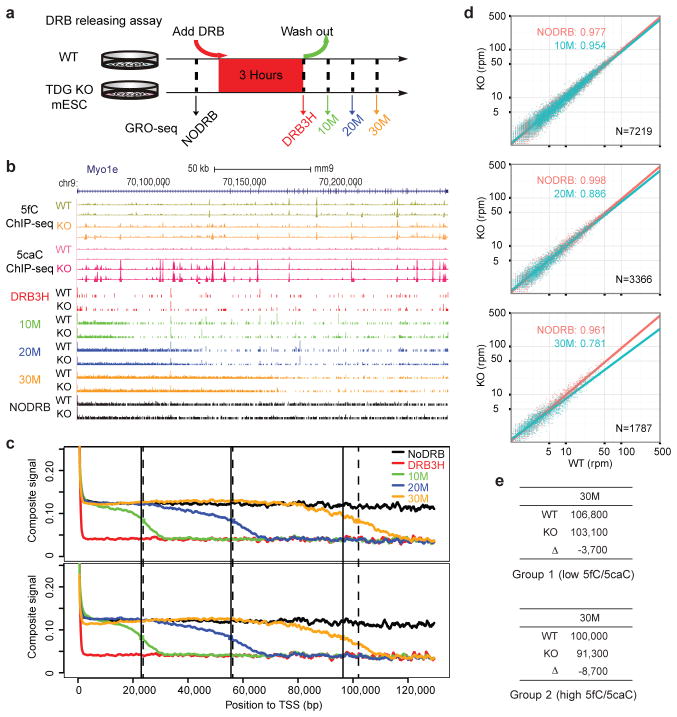
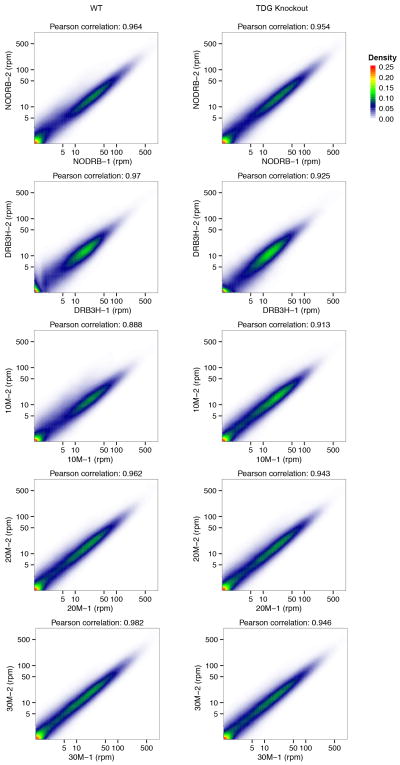
To further determine the functional consequences of oxi-mCs on Pol II transcription elongation in mammalian cells, we measured the in vivo transcription elongation rate on a pair of isogenic mouse embryonic ES cells (wild-type TDGfl/fl mESCs (WT) and TDG−/− mESCs (KO) derived from conditional TDG KO mice) by global nuclear run-on coupled with deep sequencing (GRO-seq)(Fig. 4a). Previous studies showed that, relative to WT, TDG KO led to a substantial increase of global 5fC/5caC levels7,8. The GRO-seq experiments allowed us to measure the front edge of waves of nascent transcripts at different time points to deduce the rate of Pol II transcription elongation.
Figure 4.
Impact of 5fC/5caC on Pol II transcription elongation in mouse embryonic stem cells (mESCs). a, Scheme of the DRB releasing assay. Wt and TDG-knockout mESCs were treated with DRB followed by washing out DRB to allow transcription for 10, 20, or 30 min. No DRB treatment (NODRB) or 3 hr DRB treatment (DRB3H) were performed as controls. All experiments were performed in duplicate and reproducibility was evident in all pairwise comparisons (Extended Data Fig. 8). b, The GRO-seq data on the representative Myo1e gene. Elevated 5fC/5caC levels in TDG-KO mESCs are derived from the published ChIP-seq data in duplicate8. c, Comparative metagene analysis of GRO-seq signals between WT (upper) and KO mESCs (bottom). Dashed and non-dashed lines show the middle points of the ensemble transcription waves in WT and KO mESCs, respectively. d, Pairwise comparisons of the GRO-seq density (reads per million) of individual genes in the +/−10 kb window around different middle points between WT (x-axis) and KO cells (y-axis) in c (10M, 20M, 30M in cyan) with the NODRB data (red) as control. The coefficients are the slopes of the lines from linear regression on the scattered points. The p-values were calculated based on one-sided Kolmogorov-Smirnov test of comparing read density ratio (KO/WT) at 30 min. N: number of genes. e, Correlation between increased 5fC/5caC levels and retarded transcription elongation. Genes were divided into two groups according to increased 5fC/5caC levels in the gene bodies (low in group 1 and high in group 2). The numbers correspond to the middle point positions (bp) of the ensemble transcription waves relative to TSS in WT versus KO mESCs.
We observed retarded Pol II elongation in TDG KO mESCs relative to WT mESCs after the functional impact was sufficiently accumulated, as exemplified on the long Myo1e gene (Fig. 4b). Further metagene analysis of the middle points of WT and TDG KO mESCs at different time points revealed a clear reduction of Pol II elongation in TDG KO mESCs relative to WT mESCs after 30 min of synchronized transcription, although the differences at earlier times were not evident (Fig. 4c). We next analyzed the GRO-seq read density gene by gene +/−10 kb around individual middle points followed by linear regression to determine the slope (Fig. 4d). We observed progressive slowing down of Pol II in TDG KO mESCs relative to wt cells, as indicated by decreasing slopes, and the read density ratio (TDG KO/WT) at 30 min was significantly smaller relative to control (p-value = 1.52×10⁻¹⁰ from one-sided KS-test) (Fig. 4d). Finally, to determine the dosage-dependent effect of 5fC/5caC on Pol II transcription elongation, we focused on the data at 30 min and segregated genes into two groups according to increased levels of 5fC/5caC in response to TDG KO and compared the middle points at individual assay points. The data indicate a correlation between increased 5fC/5caC and reduced transcription elongation rate among genes in group 2 (high 5fC/5caC level) relative to group 1 (low 5fC/5caC level) (Fig. 4e). Together, these global data demonstrate retarded Pol II elongation by enhanced 5fC/5caC levels in the gene body. The combination of in vitro and in vivo data strongly argues for the direct impact of 5fC/5caC on Pol II elongation on DNA template.
In summary, we present a series of structural and biochemical evidence to suggest that Pol II has the ability to directly sense the DNA oxidative methylation state through its conserved epi-DNA recognition loop and transiently slows down at oxi-mC (5fC/5caC) sites during transcription. Since 5fC/5caC are not distributed evenly across the genome and show significant variations between cell types, it is conceivable that these pausing effects may add a new layer of fine-tuned regulation of Pol II transcription elongation dynamics. For example, the accumulative effect of pausing effects at 5fC/5caC sites likely have much more profound regulatory effects on transcribing some long genes that preferentially expressed in brain and have crucial roles in neuronal integrity29. The transient Pol II pausing at 5fC/5caC sites may also provide signals for the recruitment of various transcription elongation factors, chromatin remodeling complexes, mRNA processing machineries, and thymine DNA glycosylase (TDG) and the base excision repair (BER) machineries to the oxi-mC sites to induce additional functional consequences. Based on the similarity between direct Pol II recognition of 5caC and Pol II’s role to sense bulky DNA lesions in transcription-coupled nucleotide excision repair, we propose that Pol II may act as a direct sensor for a variety of DNA modification and damage events to instruct distinct downstream pathways26,27,30.
Methods
Preparation of Pol II ECs
S. cerevisiae Pol II was purified as described17. PAGE-purified RNA oligonucleotides were purchased from Dharmacon, non-template DNA oligonucleotides were obtained from IDT, and template DNA oligonucleotides with 5caC were prepared and purified as previously described14. The template DNA, non-template DNA, and RNA oligonucleotides were annealed to form scaffold. To form the Pol II EC, Pol II was mixed with scaffold in the reaction buffer (20 mM Tris (pH 7.5), 40 mM KCl, and 5 mM DTT). The final concentrations were 2 μM Pol II, 10 μM template DNA, and 20 μM non-template DNA and RNA oligonucleotides. The mixture was incubated at room temperature for 1 hr, followed by ultrafiltration to remove excess oligonucleotides. The Pol II elongation complex was crystallized using the hanging drop method and from solutions containing 390 mM (NH4)2HPO4/NaH2PO4, pH 6.0, 50 mM dioxane, 10 mM DTT and 10.7–11.6% (w/v) PEG6000. Crystals were transferred in a stepwise manner to cryo buffer as described17. For the Pol II EC with GMPCPP, Pol II EC crystals were soaked with 5–10 mM GMPCPP and 10 mM MgCl2 overnight before harvest.
Data collection and structure determination of 5caC-paused Pol II ECs
Diffraction data were collected on beamlines 8.2.1 and 5.0.2 at the Advanced Light Source, Lawrence Berkeley National Laboratory. Data were processed in DENZO and SCALEPACK (HKL2000)31. Model building was performed with the program Coot32, and refinement was done with REFMAC5 with TLS (CCP4i) or PHENIX (Extended Data Table 1)33. Electron density maps are shown in Extended Data Fig. 1. EC-I refers to the Pol II EC crystal structure that contains a site-specific 5caC at the i+1 site in the absence of GTP binding. EC-II refers to the Pol II EC crystal structure that contains a site-specific 5caC at the i+1 site in the presence of GMPCPP. Ramachandran plot of EC-I showed 85.57%, 11.70%, and 2.73% of EC-I residues are in preferred, allowed and disallowed regions, respectively. For EC-II, 86.00%, 11.22%, and 2.78% of residues are in above regions, respectively. All structural models in the figures were superimposed with the bridge helix region (Rpb1 822–840) near the active site using Coot32 and PYMOL34.
Purification of 12-subunit wild type or Pol II Q531A and Q531H mutants for in vitro transcription assay
S. cerevisiae Pol II and mutants were purified essentially as described17. Briefly, Pol II (with recombinant protein A tag at Rpb3 subunit) was first affinity-purified by IgG column. The Pol II elution from IgG column was further purified using HiTrap Heparin and Mono Q (GE Healthcare). The final pure Pol II (Extended Data Fig. 3d) was ready for future in vitro transcription experiments.
In vitro transcription assays
The S. cerevisiae Pol II ECs for transcription assays were assembled using established methods16. Briefly, an aliquot of 5′-32P-labeled RNA was annealed with 1.5-fold amount of template DNA and 2-fold amount of non-template DNA to form RNA/DNA scaffold in elongation buffer (20 mM Tris-HCl, pH 7.5, 40 mM KCl, and 5 mM MgCl2). An aliquot of annealed scaffold of RNA/DNA was then incubated with a 4-fold excess amount of Pol II at room temperature for 10 min to ensure the formation of Pol II EC. The in vitro transcription started when the Pol II EC was mixed with equal volumes of GTP solution. The final concentrations were 25 nM scaffold, 100 nM Pol II, and 1 μM GTP in the elongation buffer. Reactions were quenched at various time points by the addition of one volume of 0.5 M EDTA (pH 8.0). (Time points are 0, 5 s, 15 s, 30 s, 1 min, 5 min, 20 min, and 1 hr). The quenched products were analyzed by denaturing PAGE and visualized using a storage phosphor screen and Pharos FX imager (Bio-Rad). The in vitro transcription assay of E. coli RNA polymerase (RNAP, New England Biolabs (NEB)) was performed using the same procedure as S. cerevisiae RNA Pol II transcription.
For the transcription of human Pol II in the nuclear extract of HeLa cells (Life Technologies), the excess annealed scaffold was incubated with nuclear extract of HeLa cells for 5 min before the addition of α-32P-GTP. The final concentrations were 1 μM scaffold, 1 μM α-32P-GTP (0.2 μCi/uL) and 3 mg/mL protein of nuclear extract. Reactions were then quenched at various time points by the addition of one volume of 0.5 M EDTA (pH 8.0). The quenched products were analyzed by denaturing PAGE and visualized using a storage phosphor screen and Pharos FX imager (Bio-Rad). All above transcription assays were performed independently in triplicates.
In vitro RNA pol II transcription kinetic assay and analysis
The assay was carried out as previously described14. Briefly, nucleotide incorporation assays were conducted by pre-incubating 50 nM annealed scaffold containing a site-specific 5caC modification at the template with 200 nM purified Pol II (wt, Q531H, and Q531A) for 10 min in elongation buffer at room temperature. The Pol II EC was then mixed with an equal volume of solution containing 40 mM KCl, 20 mM Tris-HCl (pH 7.5), 10 mM DTT, 10 mM MgCl2, and 2-fold concentrations of various nucleotides. Final reaction concentrations after mixing were 25 nM scaffold, 100 nM Pol II, 5 mM MgCl2, and various nucleotide concentrations in elongation buffer. Reactions were quenched at various times by addition of one volume of 0.5 M EDTA (pH 8.0) and analyzed by denatured PAGE.
Nonlinear-regression data fitting was performed using Prism 6. The time dependence of product formation was fit to a one-phase association equation (Product = Ae(−kobs t) + C) to determine the observed rate (kobs). The substrate concentration dependence was fit to a hyperbolic equation (kobs = kpol [Substrate]/(Kd,app + [Substrate])) to obtain values for the maximum rate of NTP incorporation (kpol) and apparent Kd (Kd,app) governing NTP binding essentially as described. The specificity constant was determined by kpol/Kd,app.
Cell culture and in vivo transcription rate measurement (DRB releasing GRO-seq assays)
Wild-type (WT) mESCs (Tdgfl/fl) and TDG knockout (TDG KO) mESCs (Tdgfl/fl)7 were cultured in KnockoutTM DMEM (Life Technologies, Cat. NO: 10828-018) supplemented with 15% KnockoutTM Serum Replacement (Life Technologies, Cat. NO: 10828-028), 2 mM L-glutamine (Life Technologies, Cat. NO: 25030-081), 1X Non-essential amino acids (Life Technologies, Cat. NO: 11140-050), 1X Penicillin-Streptomycin (Life Technologies, Cat. NO: 15140-122), 0.1 mM 2-Mercaptoethanol (Life Technologies, Cat. NO: 21985-023), 1000 U/ml LIF (Millipore, Cat. NO: ESG1106), 3 μM CHIR99021 (Stemgent, Cat. NO: 04-0004) and 1 μM PD0325901 (Stemgent, Cat. NO: 04-0006). The DRB releasing GRO-seq assays were carried out in mESCs under both WT and TDG KO conditions. For each time-course assay, there are 5 samples prepared for GRO-seq: 1) NODRB (without DRB treatment); 2) DRB3H (DRB treatment for 3 hrs, and this is the 0 time point); 3) 10M (10 min after washing out DRB); 4) 20M (20 min after washing); 5) 30M (30 min after washing). For DRB treatment, we grew cells in 10 cm plate to 70–80% confluence, treated cells by adding of DRB (Sigma) at final concentration of 100 mM to the culture medium and incubated for 3 hrs in the incubator, removed DRB by quick washing cells 3 times with PBS, then incubated in fresh medium in the incubator to different time points. GRO-seq was implemented as described37,38, and the GRO-seq libraries were subjected to Illumina Hiseq 2000 and 2500 for sequencing.
For each sequencing sample, the sequenced reads were trimmed by removing 3′ adapter and polyA sequences, and only those longer than 16 bp were used to map the mouse genome (mm9) with Bowtie (version 0.12.7), with parameters “--best --strata -l25 -n2 -k1 -m10” 36. Only one read was kept for those reads mapped to the same location and strand.
To measure the concordance between replicated samples, we counted the number of the GRO-seq reads in all annotated genes (UCSC refGene) and did pair-wise comparisons38. Transcripts with the same start and end positions were used once. Having established the data reproducibility, we combined replicated data sets for comparison between biological conditions at different assay points.
To estimate the Pol II elongation rates, we computed the metagene profiles for all assay points. Only the genes with RPKM ≥ 0.5 in NODRB sample were kept for meta-analysis. The genes were aligned at TSSs, and mapped reads were counted in 100 bp bins across the gene bodies. The counts were normalized to one million total reads per sample, and were averaged for each bin by the number of covering genes and normalized by the relative gene expression in the NODRB sample. The meta-profiles from the normalized counts were smoothed with a 1 kb moving window. The middle point of the ensemble transcription wave at each time point after washing DRB was computed as the position at which the signal reached half of that in the NODRB control sample.
To compare elongation differences at different assay points on individual genes, we calculated the GRO-seq read density in +/− 10 kb window around the middle points identified in WT mESC cells. At each assay point (10M, 20M, 30M), the counts for each gene in WT and TDG KO conditions were pairwise compared and linear regressions were fitted to check the trend of change. The samples without DRB treatment were used as control. The changes of 5fC/5caC levels on genes were calculated as the differences of normalized ChIP-seq signals under 5fC/5caC ChIP-seq peaks from KO to WT based on the published ChIP-seq data from Ref. 8, and the genes were divided into two groups with low and high increased 5fC/5caC levels.
Comparison of 5caC-paused Pol II EC and DNA lesion or α-amanitin -arrested Pol II EC
All the structures were aligned by superimposition of Pol II bridge helix region (residues 822–840 in Rpb1). The i+1 5caC, CPD, pyriplatin-dG, and i+1 transition template base in α-amanitin-arrested Pol II EC are all accommodated above the bridge helix, even though their exact locations, orientations, and interactions of Pol II greatly differ: α-amanitin appears to capture Pol II translocation intermediate indirectly by jamming the movement of the Pol II bridge helix and trapping the trigger loop in an inactive conformation, whereas the conformation of CPD and pyriplatin-DNA lesions is largely governed by their covalent crosslink or bulky ligand. In contrast to all of these previous cases, the translocation intermediate of 5caC nucleobase forms a direct interaction with the Pol II epi-DNA recognition loop. Second, the upstream RNA/DNA hybrid adapts essentially the same post-translocation register for all of these paused/arrested Pol II ECs, except that the 3′-RNA/DNA hybrid is substantially tilted for CPD-lesion arrested Pol II EC. Finally, while 5caC and pyriplatin-DNA lesion can form Watson-Crick base pairs with incoming NTP, thus allowing template-dependent nucleotide addition, the CPD-DNA lesion fails to form such base pair with incoming nucleotide, therefore only allowing template independent ATP incorporation. In contrast to all of these previous cases, the translocation intermediate of 5caC nucleobase forms a direct interaction with the Pol II epi-DNA recognition loop.
Extended Data
Extended Data Figure 1. Electron density maps of Pol II EC-I and EC-II.
a, 2Fo-Fc map (blue) of Rpb2 Q531 in epi-DNA recognition loop and the opposite 5caC in Pol II EC-I, contoured at 1.0 sigma. b, Fo-Fc omit map (green) of Pol II EC-I (with 5caC omission), contoured at 3.0 sigma. c, 2Fo-Fc map (blue) of GMPCPP paired with 5caC in Pol II EC-II, contoured at 1.0 sigma. d, Fo-Fc omit map (green) of Pol II EC-II (with GMPCPP and 5caC omission), contoured at 3.0 sigma.
Extended Data Figure 2. Structural comparison between Pol II EC-I, EC-II and Pol II EC containing unmodified C template and a matched GTP.
a, Superimposition of Pol II EC-I and EC-II structures. Rpb2 Q531 and 5caC in EC-II are in magenta to differentiate between those counterparts in EC-I. These two structures are aligned using bridge helix region (Rpb1 822–840). b, Superposition of Pol II EC-II containing 5caC template and GMPCPP with Pol II EC with closed trigger loop (containing unmodified C template and GTP, PDB: 2E2H). The two structures are aligned using bridge helix region (Rpb1 822–840).
Extended Data Figure 3. Kinetic study of GTP incorporation opposite 5caC template by purified Pol II proteins.
Representative kinetic parameters fitting curves from three independent experiments for GTP incorporation opposite 5caC template for Pol II wt (a), Pol II Q531H (b), and Pol II Q531A (c), respectively. (d) Purified Pol II wt, Pol II Q531H, and Pol II Q531A proteins used in the in vitro transcription experiments.
Extended Data Figure 4. Modeling potential similar interaction for recognition of 5fC and 5caC templates, but not for 5hmC, 5mC and C templates.
a, Hydrogen bonds (black dotted lines) between Rpb2 Q531, 5caC, and GMPCPP in EC-II. b, Model of the interaction between Pol II EC with 5fC template through the same hydrogen bonds interaction network. c, Model of Pol II EC with 5hmC template reveals no obvious hydrogen bonding between Q531 and 5hmC. The 5hmC nucleotide structure was based on PDB: 4R2C. d, Model of Pol II EC with 5mC template. e, Model of Pol II EC with unmodified C template. The above models were derived from the Pol II EC-II structure.
Extended Data Figure 5. Sequence alignment of Pol II epi-DNA recognition loop across different species.
a, Pol II epi-DNA recognition loop (Rpb2 521–541) is conserved from fungi to human and strictly conserved among several fungal species highlighted with magenta dotted rectangle, which contains active TET/JBP enzymes18. Key residues in the loop were highlighted in green box. b, Hydrogen bonds (black dotted lines) between yeast Pol II Rpb2 Q531, 5caC, and GMPCPP in EC-II. c, Model of human Pol II with the functionally equivalent His substitution based on EC-II structure. d, Comparison between Q531 and H531 substitution reveals the similar hydrogen bonding interaction.
Extended Data Figure 6. Human Pol II slows down at 5caC template in comparison with unmodified template in the content of HeLa nuclear extract.
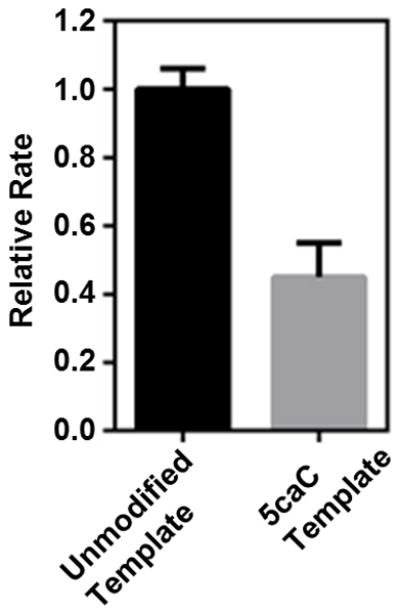
The relative transcription elongation rate is normalized by the transcription elongation rate (kobs) from unmodified template. The relative rate from unmodified template and 5caC template are colored in black and gray, respectively. The error bars are standard deviations derived from three independent experiments.
Extended Data Figure 7. Comparison of purified yeast Pol II (upper panel) and E. coli RNAP (lower panel) transcription on 5caC template in comparison with unmodified template.
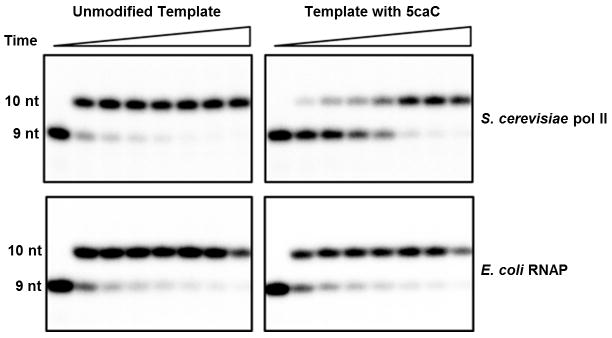
Time points are 0, 5 s, 15 s, 30 s, 1 min, 5 min, 20 min, and 1 hr (left to right). The upper panel is identical to Fig. 1c and is placed here for direct comparison.
Extended Data Figure 8. Correlation between two replicates of GRO-seq data sets at different assay points.
GRO-seq replicates (−1 and −2) were pairwise compared gene by gene on the normalized number of reads (rpm: reads per million total reads) for WT (left) and TDG KO (right) samples. The colors show the density of points or genes. The Pearson correlation coefficient were calculated from the points and shown on the top of each subfigure.
Extended Data Table 1.
Data collection and refinement statistics.
| EC-I | EC-II | |
|---|---|---|
| Data collection | ||
| Space group | C2 | C2 |
| Cell dimensions | ||
| a, b, c (Å) | 166.7, 221.6, 192.4 | 168.2, 222.6, 192.8 |
| α, β, γ (°) | 90, 100.4, 90 | 90, 101.6, 90 |
| Resolution (Å) | 50-3.5 (3.56-3.5) * | 50-3.3 (3.36-3.3) |
| Rsym | 0.143 (0.583) | 0.153 (0.762) |
| I/sI | 8.1 (1.7) | 9.2 (1.1) |
| Completeness (%) | 94.3 (72.8) | 99.4 (96.5) |
| Redundancy | 3.6 (3.3) | 3.7 (3.3) |
| Refinement | ||
| Resolution (Å) | 49.3-3.5 | 48.9-3.3 |
| No. reflections | 81,638 | 105636 |
| Rwork/Rfree | 20.1/23.2 | 20.7/25 |
| No. atoms | ||
| Protein/Nucleic acid | 29180 | 29151 |
| Ligand/Ions | 9 | 42 |
| Water | ||
| B-factors | ||
| Protein/Nucleic acid | 94.3 | 102.8 |
| Ligand/Ions | 135.8 | 95.4 |
| Water | ||
| R.m.s deviations | ||
| Bond lengths (Å) | 0.009 | 0.009 |
| Bond angles (°) | 1.355 | 1.326 |
Values in parentheses are for the highest resolution shell.
Acknowledgments
D.W. acknowledges the National Institutes of Health (NIH) (GM102362), Kimmel Scholars award from the Sidney Kimmel Foundation for Cancer Research, and start-up funds from the Skaggs School of Pharmacy and Pharmaceutical Sciences, UCSD. The work was also supported by the NIH grant (HG006827) and the Howard Hughes Medical Institute to C.H. and the NIH grants (GM052872 and HG004659) to X-D. F. We are grateful to Dr. Craig Kaplan for providing S. cerevisiae Pol II Rpb2 Q531H and Rpb2 Q531A mutant strains. GEO accession number for GRO-seq data is GSE64748. Atomic coordinates and structure factors for the reported crystal structures have been deposited in the Protein Data Bank with accession codes 4Y52 and 4Y7N for EC-I and EC-II, respectively.
Footnotes
Author contributions
D.W. conceived the original idea and together with X-D. F. designed the experiments. X.L. carried out synthesis of DNA templates. J.C., L.W., and D.W. purified Pol II. L.W. and D.W. performed crystallization, data collection and structural refinement. L.X. performed in vitro transcription assay. Y.Z., R.X., L.C., and H.L. performed in vivo GRO-seq assay. L.W., Y.Z., L.X., R.X., X.L., J.C., C.H., X-D. F., and D.W. wrote the paper.
References
- 1.Pastor WA, Aravind L, Rao A. TETonic shift: biological roles of TET proteins in DNA demethylation and transcription. Nat Rev Mol Cell Biol. 2013;14:341–356. doi: 10.1038/nrm3589. [DOI] [PMC free article] [PubMed] [Google Scholar]
- 2.Wu H, Zhang Y. Reversing DNA methylation: mechanisms, genomics, and biological functions. Cell. 2014;156:45–68. doi: 10.1016/j.cell.2013.12.019. [DOI] [PMC free article] [PubMed] [Google Scholar]
- 3.Tahiliani M, et al. Conversion of 5-methylcytosine to 5-hydroxymethylcytosine in mammalian DNA by MLL partner TET1. Science. 2009;324:930–935. doi: 10.1126/science.1170116. [DOI] [PMC free article] [PubMed] [Google Scholar]
- 4.Pfaffeneder T, et al. The discovery of 5-formylcytosine in embryonic stem cell DNA. Angew Chem Int Ed. 2011;50:7008–7012. doi: 10.1002/anie.201103899. [DOI] [PubMed] [Google Scholar]
- 5.Ito S, et al. Tet proteins can convert 5-methylcytosine to 5-formylcytosine and 5-carboxylcytosine. Science. 2011;333:1300–1303. doi: 10.1126/science.1210597. [DOI] [PMC free article] [PubMed] [Google Scholar]
- 6.He YF, et al. Tet-mediated formation of 5-carboxylcytosine and its excision by TDG in mammalian DNA. Science. 2011;333:1303–1307. doi: 10.1126/science.1210944. [DOI] [PMC free article] [PubMed] [Google Scholar]
- 7.Song CX, et al. Genome-wide profiling of 5-formylcytosine reveals its roles in epigenetic priming. Cell. 2013;153:678–691. doi: 10.1016/j.cell.2013.04.001. [DOI] [PMC free article] [PubMed] [Google Scholar]
- 8.Shen L, et al. Genome-wide analysis reveals TET- and TDG-dependent 5-methylcytosine oxidation dynamics. Cell. 2013;153:692–706. doi: 10.1016/j.cell.2013.04.002. [DOI] [PMC free article] [PubMed] [Google Scholar]
- 9.Klose RJ, Bird AP. Genomic DNA methylation: the mark and its mediators. Trends Biochem Sci. 2006;31:89–97. doi: 10.1016/j.tibs.2005.12.008. [DOI] [PubMed] [Google Scholar]
- 10.Moore LD, Le T, Fan G. DNA methylation and its basic function. Neuropsychopharmacology. 2013;38:23–38. doi: 10.1038/npp.2012.112. [DOI] [PMC free article] [PubMed] [Google Scholar]
- 11.Spruijt CG, et al. Dynamic readers for 5-(hydroxy)methylcytosine and its oxidized derivatives. Cell. 2013;152:1146–1159. doi: 10.1016/j.cell.2013.02.004. [DOI] [PubMed] [Google Scholar]
- 12.Iurlaro M, et al. A screen for hydroxymethylcytosine and formylcytosine binding proteins suggests functions in transcription and chromatin regulation. Genome Biol. 2013;14:R119. doi: 10.1186/gb-2013-14-10-r119. [DOI] [PMC free article] [PubMed] [Google Scholar]
- 13.Hashimoto H, et al. Wilms tumor protein recognizes 5-carboxylcytosine within a specific DNA sequence. Genes Dev. 2014;28:2304–2313. doi: 10.1101/gad.250746.114. [DOI] [PMC free article] [PubMed] [Google Scholar]
- 14.Kellinger MW, et al. 5-formylcytosine and 5-carboxylcytosine reduce the rate and substrate specificity of RNA polymerase II transcription. Nat Struct Mol Biol. 2012;19:831–833. doi: 10.1038/nsmb.2346. [DOI] [PMC free article] [PubMed] [Google Scholar]
- 15.Huang Y, Rao A. New functions for DNA modifications by TET-JBP. Nat Struct Mol Biol. 2012;19:1061–1064. doi: 10.1038/nsmb.2437. [DOI] [PMC free article] [PubMed] [Google Scholar]
- 16.Cramer P, Bushnell DA, Kornberg RD. Structural basis of transcription: RNA polymerase II at 2.8 angstrom resolution. Science. 2001;292:1863–1876. doi: 10.1126/science.1059493. [DOI] [PubMed] [Google Scholar]
- 17.Wang D, Bushnell DA, Westover KD, Kaplan CD, Kornberg RD. Structural basis of transcription: role of the trigger loop in substrate specificity and catalysis. Cell. 2006;127:941–954. doi: 10.1016/j.cell.2006.11.023. [DOI] [PMC free article] [PubMed] [Google Scholar]
- 18.Brueckner F, Cramer P. Structural basis of transcription inhibition by alpha-amanitin and implications for RNA polymerase II translocation. Nat Struct Mol Biol. 2008;15:811–818. doi: 10.1038/nsmb.1458. [DOI] [PubMed] [Google Scholar]
- 19.van Luenen HG, et al. Glucosylated hydroxymethyluracil, DNA base J, prevents transcriptional readthrough in Leishmania. Cell. 2012;150:909–921. doi: 10.1016/j.cell.2012.07.030. [DOI] [PMC free article] [PubMed] [Google Scholar]
- 20.Iyer LM, et al. Lineage-specific expansions of TET/JBP genes and a new class of DNA transposons shape fungal genomic and epigenetic landscapes. Proc Natl Acad Sci U S A. 2014;111:1676–1683. doi: 10.1073/pnas.1321818111. [DOI] [PMC free article] [PubMed] [Google Scholar]
- 21.Korzheva N, et al. A structural model of transcription elongation. Science. 2000;289:619–625. doi: 10.1126/science.289.5479.619. [DOI] [PubMed] [Google Scholar]
- 22.Silva DA, et al. Millisecond dynamics of RNA polymerase II translocation at atomic resolution. Proc Natl Acad Sci U S A. 2014;111:7665–7670. doi: 10.1073/pnas.1315751111. [DOI] [PMC free article] [PubMed] [Google Scholar]
- 23.Wang D, Zhu GY, Huang XH, Lippard SJ. X-ray structure and mechanism of RNA polymerase II stalled at an antineoplastic monofunctional platinum-DNA adduct. Proc Natl Acad Sci U S A. 2010;107:9584–9589. doi: 10.1073/pnas.1002565107. [DOI] [PMC free article] [PubMed] [Google Scholar]
- 24.Walmacq C, et al. Mechanism of translesion transcription by RNA polymerase II and its role in cellular resistance to DNA damage. Mol Cell. 2012;46:18–29. doi: 10.1016/j.molcel.2012.02.006. [DOI] [PMC free article] [PubMed] [Google Scholar]
- 25.Weixlbaumer A, Leon K, Landick R, Darst SA. Structural basis of transcriptional pausing in bacteria. Cell. 2013;152:431–441. doi: 10.1016/j.cell.2012.12.020. [DOI] [PMC free article] [PubMed] [Google Scholar]
- 26.Lindsey-Boltz LA, Sancar A. RNA polymerase: the most specific damage recognition protein in cellular responses to DNA damage? Proc Natl Acad Sci U S A. 2007;104:13213–13214. doi: 10.1073/pnas.0706316104. [DOI] [PMC free article] [PubMed] [Google Scholar]
- 27.Hanawalt PC, Spivak G. Transcription-coupled DNA repair: two decades of progress and surprises. Nat Rev Mol Cell Biol. 2008;9:958–970. doi: 10.1038/nrm2549. [DOI] [PubMed] [Google Scholar]
- 28.Zhang L, et al. Thymine DNA glycosylase specifically recognizes 5-carboxylcytosine-modified DNA. Nat Chem Biol. 2012;8:328–330. doi: 10.1038/nchembio.914. [DOI] [PMC free article] [PubMed] [Google Scholar]
- 29.Polymenidou M, et al. Long pre-mRNA depletion and RNA missplicing contribute to neuronal vulnerability from loss of TDP-43. Nat Neurosci. 2011;14:459–468. doi: 10.1038/nn.2779. [DOI] [PMC free article] [PubMed] [Google Scholar]
- 30.Sarker AH, et al. Recognition of RNA polymerase II and transcription bubbles by XPG, CSB, and TFIIH: insights for transcription-coupled repair and Cockayne syndrome. Mol Cell. 2005;20:187–198. doi: 10.1016/j.molcel.2005.09.022. [DOI] [PubMed] [Google Scholar]
- 31.Otwinowski Z, Minor W. Processing of x-ray diffraction data collected in oscillation mode. Methods Enzymol. 1997;276:307–326. doi: 10.1016/S0076-6879(97)76066-X. [DOI] [PubMed] [Google Scholar]
- 32.Emsley P, Cowtan K. Coot: model-building tools for molecular graphics. Acta Crystallogr D. 2004;60:2126–2132. doi: 10.1107/S0907444904019158. [DOI] [PubMed] [Google Scholar]
- 33.Adams PD, et al. PHENIX: a comprehensive Python-based system for macromolecular structure solution. Acta Crystallogr D. 2010;66:213–221. doi: 10.1107/S0907444909052925. [DOI] [PMC free article] [PubMed] [Google Scholar]
- 34.DeLano WL. The PyMOL Molecular Graphics System. DeLano Scientific; Palo Alto, CA: 2002. [Google Scholar]
- 35.Wang D, et al. Reprogramming transcription by distinct classes of enhancers functionally defined by eRNA. Nature. 2011;474:390–394. doi: 10.1038/nature10006. [DOI] [PMC free article] [PubMed] [Google Scholar]
- 36.Langmead B, Trapnell C, Pop M, Salzberg SL. Ultrafast and memory-efficient alignment of short DNA sequences to the human genome. Genome Biol. 2009;10:R25. doi: 10.1186/gb-2009-10-3-r25. [DOI] [PMC free article] [PubMed] [Google Scholar]
- 37.Core LJ, Waterfall JJ, Lis JT. Nascent RNA sequencing reveals widespread pausing and divergent initiation at human promoters. Science. 2008;322:1845–1848. doi: 10.1126/science.1162228. [DOI] [PMC free article] [PubMed] [Google Scholar]
- 38.Karolchik D, et al. The UCSC Genome Browser database: 2014 update. Nucleic Acids Res. 2014;42:D764–770. doi: 10.1093/nar/gkt1168. [DOI] [PMC free article] [PubMed] [Google Scholar]


