

Abstract
Background
The neural endophenotype associated with 22q11.2 deletion syndrome (22q11DS) includes deviant cortical development and alterations in brain connectivity. Resting-state functional magnetic resonance imaging (fMRI) findings also reported disconnectivity within the default mode network (DMN). In this study, we explored the relationship between functional and structural DMN connectivity and their changes with age in patients with 22q11DS in comparison to control participants. Given previous evidence of an association between DMN disconnectivity and the manifestation of psychotic symptoms, we further investigated this relationship in our group of patients with 22q11DS.
Methods
T1-weighted, diffusion, and resting-state fMRI scans were acquired from 41 patients with 22q11DS and 43 control participants aged 6 to 28 years. A data-driven approach based on independent component analysis (ICA) was used to identify the DMN and to define regions of interest for the structural and functional connectivity analysis. Prodromal psychotic symptoms were assessed in adolescents and adults using the positive symptom scores of the Structured Interview of Prodromal Syndromes (SIPS). Connectivity measures were compared between groups and correlated with age. Repeating the between-group analysis in three different age bins further assessed the presence of age-related alterations in DMN connectivity. Structural and functional connectivity measures were then correlated with the SIPS scores.
Results
A simultaneous reduction of functional and structural connectivity between core medial nodes of the DMN was observed. Furthermore, structural connectivity measures significantly increased with age in the control group but not in patients with 22q11DS, suggesting the presence of an age-related alteration of the DMN structural connections. No correlations were found between the DMN disconnectivity and expression of prodromal symptoms in 22q11DS.
Conclusions
These findings indicate the presence of functional and structural DMN disconnectivity in 22q11DS and that patients with 22q11DS fail to develop normal structural connections between medial DMN nodes. This suggests the presence of altered neurodevelopmental trajectories in 22q11DS.
Electronic supplementary material
The online version of this article (doi:10.1186/s11689-015-9120-y) contains supplementary material, which is available to authorized users.
Keywords: Resting-state fMRI, DTI, Tractography, Maturation, Positive symptoms, Schizophrenia
Background
Chromosome 22q11.2 deletion syndrome (22q11DS) is a neurodevelopmental disorder associated with a broad phenotypic expression including clinical, cognitive, and psychiatric manifestations [1]. Cognitive problems are highly variable and comprise alterations in learning, language, working memory, and executive functions [2–5]. The psychiatric phenotype is characterized by social impairments, anxiety, and the manifestation of schizophrenia-like disorders, which occur in 30 % of adults affected by the syndrome [6, 7].
Cognitive processes result from the dynamic interaction between brain regions that communicate with each other through structural and functional connections [8, 9]. In order to ensure an efficient synchrony between integrated brain areas, these connections evolve during neurodevelopment [10]. For instance, fractional anisotropy (FA) significantly increases during childhood and adolescence signifying an increase of myelination that ensures more rapid signal conduction [10–12]. Functional networks undergo similar processes of integration and specialization [13–15]. These maturation processes are altered in neurodevelopmental and psychiatric disorders [16–18], resulting in the onset of cognitive, behavioral, and psychological impairments.
Structural neuroimaging studies based on diffusion tensor imaging (DTI) conducted in patients with 22q11DS reported altered white matter microstructure [19–30]. Also, a previous study by our group using tractography reported impairments in limbic, parietal, and fronto-temporal connections [31]. Specifically, reduced fronto-temporal connectivity was considered a vulnerability factor for the development of schizophrenia in 22q11DS [31]. Moreover, studies based on resting-state fMRI (rs-fMRI) reported functional connectivity alterations within the default mode network (DMN) in 22q11DS [32, 33].
The DMN is one of the most described resting-state networks (RSNs), active in the absence of cognitive tasks and involved in self-referential functions [34, 35]. The DMN includes a collection of spatially distinct regions covering parts of the anterior and the posterior medial areas of the brain as well as the lateral parietal cortices. Anteriorly, the DMN includes the medial prefrontal (mPFC) and the anterior cingulate cortices (ACCs); lateral DMN components have been identified in the bilateral inferior parietal lobule (IPL) and in the medial temporal lobes (MTLs); posteriorly, it comprises the posterior cingulate cortex (PCC) and the precuneus [36, 37].
The first studies investigating DMN connections adopted one imaging modality, either fMRI [38–45] or DTI [43, 46, 47]. More recently, studies began to combine the two modalities in healthy participants [48–52], reporting significant correlations between the DMN structural and functional connections. Similar studies have also been conducted in clinical samples of schizophrenic patients, reporting, for instance, a concomitant impairment in structural and functional DMN connectivity [53] and reduced coherence between structural and functional connections within the DMN [54].
In 22q11DS, a previous study from our group [32] conducted an ICA analysis aiming at investigating the organization of resting-state networks in this population of patients. This study provided evidence for alterations in the functional DMN connectivity, but did not specify which regions of the DMN were disconnected [32]. Indeed, differences between control participants and 22q11DS were evaluated by comparing the spatial activation maps. Subsequent work by Schreiner and colleagues further showed functional disconnections between the anterior and the posterior DMN nodes in 22q11DS [33]. In this context, we further aimed to investigate the within-DMN structural connectivity using an ROI-based approach to assess if the previously reported alterations in the DMN functional connections were associated to alterations in the underlying white matter tracts. The specific interest in studying the DMN structural and functional connectivity in 22q11DS was also motivated by the observation that such patterns of disconnectivity in the DMN have been reported in several neurodevelopmental disorders [44, 45, 47, 55, 56], including schizophrenia [53, 54], suggesting that DMN connectivity could represent a promising endophenotype for neurodevelopmental diseases.
Moreover, previous studies reported the presence of alterations in the trajectories of structural cortical development in individuals with 22q11DS [57–60]. Given this evidence, and considering the normal development of white matter in healthy people [61, 62], we investigated if structural and functional connectivity measures increased with age in our group of control and 22q11DS participants. In addition, we conducted the analysis of functional and structural connectivity in three age subgroups, corresponding to children, adolescents, and young adults.
Finally, we explored whether changes in the DMN connectivity were associated with specific psychiatric symptoms. Evidence suggests that altered connectivity between medial nodes of the DMN is associated with the presence of psychotic symptoms in patients who are affected by, or are at, high risk of schizophrenia [32, 53, 54, 63]. Also, altered DMN connectivity at rest and white matter impairments in the cingulum bundle are associated with prodromal psychotic symptoms in patients with 22q11DS [20, 32]. To further establish if alterations in the DMN connectivity were associated with early symptoms of psychosis in 22q11DS, we investigated the relationship between structural and functional DMN connectivity and the Structured Interview of Prodromal Syndromes (SIPS, [64]) positive scores.
Methods
Participants
The group of patients with 22q11DS included 41 participants aged between 8 and 28 years (mean age = 17.1 ± 5.3; 17 males). The IQ of the participants was measured using the Wechsler Intelligence Scale for Children-III [65] or the Wechsler Adult Intelligence Scale-III for adults [66]. The mean IQ was 67 ± 10.6. Sixteen participants (39 %) were under medication at the time of testing. Between them, nine patients were taking methylphenidate, three antipsychotics, three antidepressants, and one antiepileptic. The presence of psychiatric disorders was evaluated during a clinical interview with the participants and their parents using the Diagnostic Interview for Children and Adolescents Revised (DICA-R, [67]) and the psychosis supplement from the Kiddie-Schedule for Affective Disorders and Schizophrenia Present and Lifetime version (K-SADS-PL, [68]) for individuals below 18 years. For adult participants, we used the Structured Clinical Interview for DSM-IV Axis I Disorders (SCID-I, [69]). Twenty-two patients (54 %) met criteria for an axis-I psychiatric disorder at the time of the visit: seven were affected by anxiety disorders, five by attention deficit hyperactivity disorders (ADHDs), three by psychotic disorders, two by mood disorders. The remaining five patients were affected by more than one psychiatric disorder. In addition, we used the Structured Interview for Prodromal Syndromes (SIPS, [64]) to identify the subjects with an ultra high risk (UHR) state. As the administration of the interview requires intact cognitive functioning, six participants were unable to complete this assessment because they were too young (under 12 years old) and two because they had severe cognitive deficits. The mean SIPS scores for each positive (from P1 to P5) and negative (from N1 to N6) subscale are reported in Additional file 1: Table S1. After excluding the three subjects that presented psychotic disorders, five subjects fulfilled the three SIPS criteria for a UHR state (presence of a brief intermittent psychotic symptom prodromal syndrome and/or attenuated positive symptom prodromal syndrome and/or genetic risk and deterioration prodromal syndrome).
Forty-three control participants aged between 6 and 25 years (mean age = 16.1 ± 4.5; 15 males) were recruited among healthy siblings (N = 21) of the patients, as well as from the Geneva state school system (N = 22). No demographic differences were observed between the two control groups (p > 0.42). None of the healthy participants had a past or present history of neurologic or psychiatric disorders, and the mean IQ was 108.4 ± 13.9. Written informed consent was received from all participants or their parents, and the study was approved by the Institutional Review Board of Geneva University School of Medicine.
A total of 55 participants had to be excluded from the original sample (80 patients with 22q11DS, 59 control participants) due to the multimodal nature of the study and the need for good quality data using both the DTI and the resting-state fMRI techniques (Table 1).
Table 1.
Subjects’ exclusion
| No. subjects excluded | Reason for exclusion |
|---|---|
| 2 controls (1 male); 5 22q11DS (2 males) | Moved during the diffusion tensor imaging (DTI) and the resting-state fMRI acquisition |
| 4 controls (2 males); 8 22q11DS (4 males) | Moved during the DTI but not the resting-state fMRI acquisition |
| 4 controls (3 males); 5 22q11DS (1 male) | Moved more than 3 mm in translation or 3° in rotation during the resting-state acquisition |
| 6 controls (4 males); 8 22q11DS (6 males) | The field of view did not include the entire cortex in the DTI or in the functional images |
| 3 22q11DS (males) | Fell asleep during the resting-state acquisition |
| Tot. 16 controls; 39 22q11DS | |
Some of the participants in our final group of subjects were included in our previous studies using either DTI [31] or resting-state acquisitions only [32, 70]. Among the 84 participants, 14 control participants and 12 patients were included in [32], 9 control participants and 5 patients in [31], and 32 controls and 29 patients in [70].
Image acquisition
A Siemens Trio 3 Tesla scanner was used to acquire anatomical, diffusion-weighted, and functional resting-state imaging data during the same scanning session. The T1-weighted sequence was collected with a 3D volumetric pulse using the following sequence: TR = 2500 ms, TE = 3 ms, flip angle = 8°, acquisition matrix = 256 × 256, field of view = 22 cm, slice thickness = 1.1 mm, and 192 slices. For diffusion tensor imaging (DTI), the following parameters were used: number of directions = 30, b = 1000 s/mm2, TR = [8300–8800] ms, TE = 82 ms, flip angle = [90–180]°, acquisition matrix = 128 × 128, field of view = 25.6 cm, 64 axial slices, and slice thickness = 2 mm. The rs-fMRI sequence was acquired over 8 min and consisted of 200 blood-oxygenation-level-dependent (BOLD) images (TR = 2400 ms, TE = 30 ms, 38 axial slices, slice thickness = 3.2 mm, flip angle = 85°, acquisition matrix = 94 × 128, field of view = 96 × 128). During the rs-fMRI acquisition, participants were asked to look at a cross on the screen, to let their thoughts go, and to refrain from falling asleep.
Definition of the DMN nodes from the resting-state data using independent component analysis (ICA)
Functional images were preprocessed, and group-level spatial ICA was conducted on the entire sample of participants. ICA was the chosen spatial analysis method for two reasons: (1) it represents a data-driven approach allowing the isolation of resting-state networks without any a priori hypothesis [71] and (2) it allows for the identification and removal of artifacts caused by motion from the fMRI signal [72].
Functional images were preprocessed using the same technique we applied in our previous study [32] using Statistical Parametric Mapping (SPM8, http://www.fil.ion.ucl.ac.uk/spm/). Briefly, functional images were realigned with respect to the mean image. The T1-weighted anatomical image of each individual was co-registered to the mean functional image and then segmented. The anatomical images and the functional realigned images were spatially normalized to the Montreal Neurological Institute (MNI) template, followed by spatial smoothing using an isotropic Gaussian smoothing kernel with a full width at half maximum (FWHM) of 6 mm. To avoid our results being biased by motion artifacts, we included only participants with movement less than 3 mm for translation and 3° for rotation. These criteria have widely been employed in normal and clinical populations [32, 48, 70, 73–79]. Mean translational and rotational movement, root mean squares (RMSs), and significance of the between-group difference for each direction is reported in Additional file 1: Table S2. No between-group significant differences were observed. However, the mean framewise displacement (FD) was significantly different between groups (mean FD controls = 0.086 ± 0.035, mean FD 22q11DS = 0.127 ± 0.068, p = 0.0005).
Group-level spatial ICA was conducted on the entire sample of participants using the GIFT toolbox (http://mialab.mrn.org/software/gift/index.html). The number of components was fixed at n = 20 and, in accordance with our previous paper [32], 9 of the 20 components resulting from the ICA were visually identified as RSNs (Fig. 1). The remaining 11 components were considered artifacts due to motion or signal from the ventricles. Network identification was performed by visual inspection and confirmed by computing the correlation coefficient between the component and resting-state network templates (http://findlab.stanford.edu/functional_ROIs.html). Among the maps corresponding to the RSNs, only one was identified as the DMN and it comprised different clusters distributed along anterior and posterior medial brain regions and in two lateral regions corresponding to the IPL.
Fig. 1.
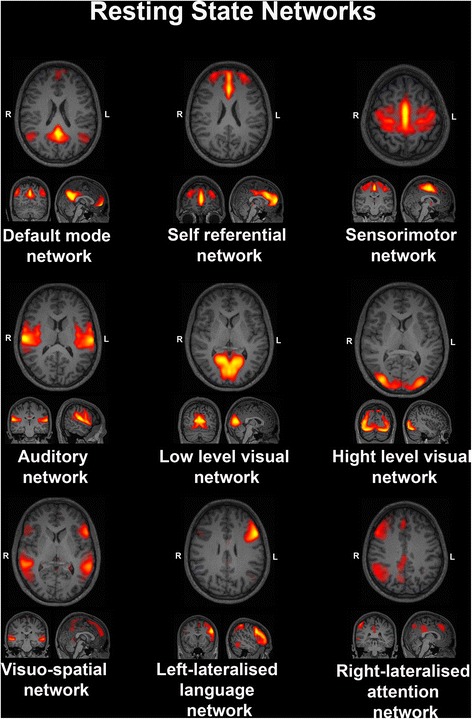
Nine resting-state networks (RSNs), which resulted from the independent component analysis (ICA)
The map corresponding to the DMN was back reconstructed to obtain subject-specific DMN maps, converted into spatial Z-scores, thresholded at z = 2, and unwrapped in the subjects’ native space.
Analysis of DMN connectivity: structural connectivity (DTI)
Data preprocessing and analysis were performed using the FSL Diffusion Toolbox (http://fsl.fmrib.ox.ac.uk/fsl/fslwiki/). The Brain Extraction Tool (BET, [80]) was employed for skull and non-brain tissue stripping. The effect of head motion and distortion of eddy currents was corrected using an affine alignment of all the weighted diffusion images onto the b0 image. The FMRIB’s Linear Image Registration Tool (FLIRT, [81, 82]) was used to register the T1-weighted images on the set of diffusion images.
The different clusters included in the DMN maps were separated to obtain independent images. Only the clusters with a dimension ≥400 voxels (corresponding to a volume of 325 mm3) were retained. Through visual inspection, each cluster was categorized as part of the anterior, posterior, or lateral components of the DMN. The position of each cluster was further confirmed by calculating the percentage of overlap between the cluster and four atlas-based (AAL atlas, [83]) structural regions of interest (ROIs) that were constructed in order to subdivide the whole brain into an anterior (frontal lobe and ACC), a posterior (occipital lobe, PCC, cuneus, precuneus), and two lateral regions (bilateral parietal lobes). In order to include the clusters corresponding to the main DMN regions, we only retained the clusters that overlapped for more than 50 % with one of the structural ROIs. Four masks corresponding to the mPFC/ACC, PCC/precuneus, and bilateral IPL were then binarized and used for fiber tracking.
Structural connectivity was estimated for each pair of regions (anterior and posterior DMN nodes and left and right IPL for a total of six connections) using the Probtrackx probabilistic tractography software from FSL [84]. The tractography algorithm drew 5000 streamline samples, with a step length of 0.5 mm and a curvature threshold of 0.2, from each voxel in the seed ROI to build up a connectivity distribution between the seed and the target ROI. This was repeated in the reverse direction (i.e., from target ROI to seed ROI), and the outputs of the two runs were averaged in order to obtain (1) the mean number of tracts connecting seed and target and (2) individual maps in which each voxel value indicated the probability of having fibers connecting the seed and the target region. Using the probabilistic maps, we computed a voxel-based connectivity measure, which is sensitive not only to the integrity and coherence of the white matter tracts but also to the tract geometry and length [85]. This mean connectivity index was calculated after thresholding the probabilistic maps to 25 % of their maximum value and calculating the mean of the thresholded maps. Additionally, mean FA along the tracts was calculated after masking the FA maps on the thresholded connectivity maps.
For the statistical analysis, we first assessed the normal distribution of the data corresponding to three structural connectivity measures (mean number of fibers, mean connectivity index, mean FA) using SPSS software (http://www-01.ibm.com/software/analytics/spss/). The mean number of fibers and the mean connectivity index were non-normally distributed, so we used two different approaches: (1) a non-parametric analysis of covariance [86] and (2) a logarithmic transformation of the data, in order to improve their normality, followed by a parametric analysis of covariance (ANCOVA). Since the mean FA values were normally distributed, we used an ANCOVA for analyses involving FA. Group comparisons were conducted using age, gender, and white matter volume as covariates. We decided not to use IQ as a covariate in the model for two reasons: (1) cognitive impairments are an integral part of the clinical profile in 22q11DS, so the effect of IQ reduction cannot easily be disentangled from other factors to explain the clinical and neural phenotype and (2) as expected from the first assumption, IQ significantly differs between patients and controls in our sample (p < 0.01), and it has been argued that it is not correct to include in the model a factor that significantly differs between groups [87].
In order to investigate the development of the DMN connectivity, we correlated the structural and functional connectivity measures with age in both 22q11DS and control groups. Given the wide age range of the participants included in the study, we subdivided the entire group of subjects into three different age bins and assessed the presence of between-group differences in structural connectivity measures using ANCOVA while covarying for age, gender, and white matter volume.
Analysis of DMN connectivity: functional connectivity
To avoid spurious correlations due to non-neural signal or motion, functional scans were preprocessed adding additional steps using the DPARSF toolbox (http://rfmri.org/DPARSF). After removing the first five volumes, the functional images were realigned, segmented, and co-registered. In addition, the signal was linearly detrended and white matter, cerebro-spinal fluid signals, and movement were regressed out. The signal was then bandpass-filtered (0.01–0.1 Hz).
ROIs were constructed for each subject in native space. Spheres with an 8-mm radius were defined using the center of gravity coordinates of the four DMN clusters identified by ICA (anterior and posterior medial regions, bilateral IPL) as seed points. This methodology has been previously adopted [48] and provides a reliable measure of the region-averaged time series by increasing the signal-to-noise ratio. Functional connectivity between pairs of DMN nodes was measured using partial correlation. The result was a 4 × 4 matrix in which each element represented the connectivity strength between two regions controlled for the effect of the other regions. Fisher’s r-to-z transformation was applied to improve normality. Statistical analysis was conducted using ANCOVA covarying for age and gender.
Results
Group differences in structural connectivity
Detailed descriptions of the structural connectivity measurements are displayed in Table 2. In the group of patients with 22q11DS, we observed a reduced number of tracts and mean connectivity index between the anterior and posterior medial regions of the DMN and between the anterior node of the DMN and the left IPL (Fig. 2). In order to assess if medication was affecting the results, we repeated the analysis after excluding the patients that were taking any psychotropic medication at the time of the visit. The results of the statistical analysis are reported in the Additional file 1: Table S3. Even with this smaller sample size, the results remained qualitatively the same. The mean FA values for both tracts did not show any significant reduction (p > 0.52) in the 22q11DS population.
Table 2.
Statistical analysis of structural connectivity
| Controls | 22q11DS | F (1,82) | p | |
|---|---|---|---|---|
| Quade’s test | ||||
| Mean number of tracts | ||||
| Anterior-posterior DMN | 31 957.84 | 16 266.24 | 5.742 | 0.019 |
| Anterior DMN-left IPL | 864.1 | 120.46 | 11.561 | 0.001 |
| Mean connectivity value | ||||
| Anterior-posterior DMN | 16 948.52 | 8 751.93 | 7.716 | 0.007 |
| Anterior DMN-left IPL | 282.81 | 43.932 | 11.413 | 0.001 |
| ANCOVA on logarithmic transformed data | ||||
| Mean number of tracts | ||||
| Anterior-posterior DMN | 4.25 | 3.82 | 8.661 | 0.004 |
| Anterior DMN-left IPL | 2.41 | 1.62 | 15.747 | 0 |
| Mean connectivity value | ||||
| Anterior-posterior DMN | 3.97 | 3.5 | 10.976 | 0.001 |
| Anterior DMN-left IPL | 1.9 | 1.21 | 15.039 | 0 |
Fig. 2.
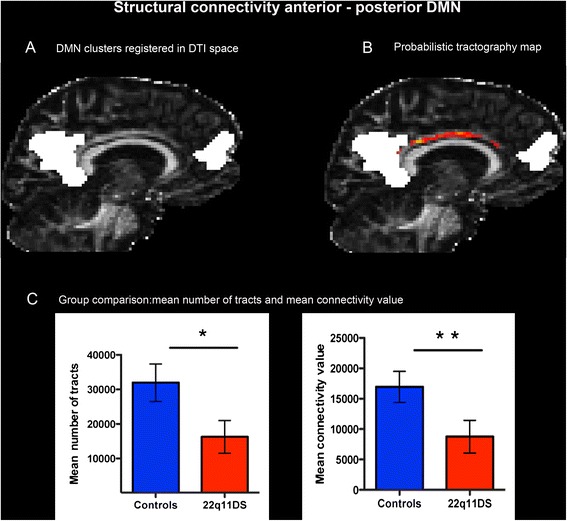
Structural connectivity between the anterior and the posterior node of the DMN (default mode network). DMN clusters were registered in DTI space (a) and used as regions of interest (ROIs) for the probabilistic tractography analysis (b). The connectivity map is represented in red/yellow colors and overlaid onto the fractional anisotropy (FA) map. The lighter the color, the greater the probability to have a connection. Structural connectivity measures (c) were significantly reduced in the 22q11DS population compared with controls (p < 0.05, indicated by *, p < 0.01, indicated by **)
For the connections that showed significant differences, namely between the anterior and posterior DMN and between the anterior DMN and the left IPL, we further assessed if the number of tracts and the mean connectivity index changed with age. The correlation analysis revealed that both measures were significantly correlated with age in the control group, but not in the group of patients with 22q11DS (Fig. 3). To further explore the effect of age, we subdivided the whole cohort of participants into three age bins: children (6–12 years old; 10 control participants, 9 patients), adolescents (13–17 years old; 17 control participants, 15 patients), and young adults (18–28 years old; 16 control participants, 17 patients). We observed that structural connectivity was preserved in children and adolescents affected by the syndrome whereas, in the group of adults, the mean number of tracts and the mean connectivity value were both significantly reduced (see Table 3 and Fig. 4), thereby suggesting an alteration in the maturation process of these white matter tracts.
Fig. 3.
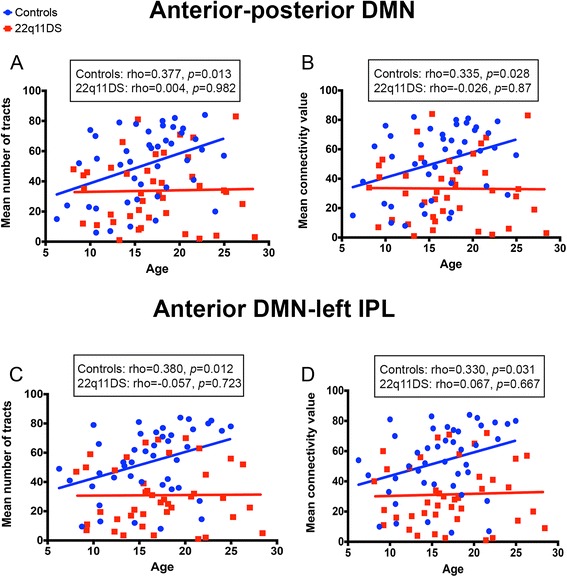
Correlation between structural connectivity and age. In the anterior-posterior (a, b) and anterior-left (c, d) default mode network (DMN) structural connectivity increases with age in control participants but not in patients with 22q11DS
Table 3.
Statistical analysis of structural connectivity in the adult population
| Controls | 22q11DS | F (1,31) | p | |
|---|---|---|---|---|
| Quade’s test | ||||
| Mean number of tracts | ||||
| Anterior-posterior DMN | 51 245.97 | 21 133.62 | 9.901 | 0.004 |
| Anterior DMN-left IPL | 1 565.47 | 131.47 | 8.913 | 0.005 |
| Mean connectivity value | ||||
| Anterior-posterior DMN | 25 664.69 | 9 698.67 | 12.992 | 0.001 |
| Anterior DMN-left IPL | 442.3 | 49.74 | 6.997 | 0.013 |
| ANCOVA on logarithmic transformed data | ||||
| Mean number of tracts | ||||
| Anterior-posterior DMN | 4.54 | 3.84 | 8.179 | 0.008 |
| Anterior DMN-left IPL | 2.69 | 1.69 | 10.941 | 0.003 |
| Mean connectivity value | ||||
| Anterior-posterior DMN | 4.27 | 3.51 | 11.044 | 0.002 |
| Anterior DMN-left IPL | 2.15 | 1.32 | 9.326 | 0.005 |
Fig. 4.
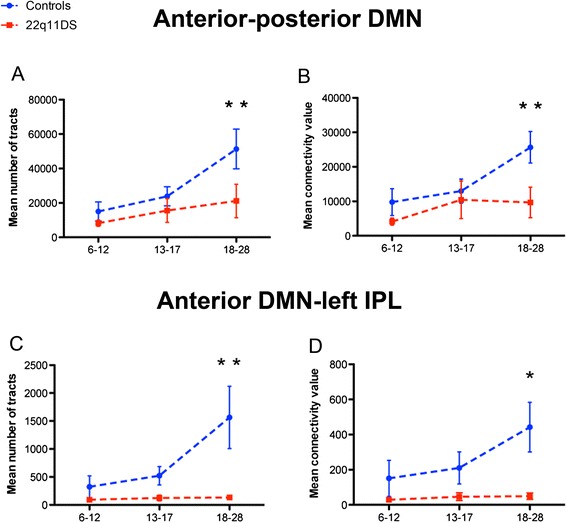
Structural connectivity in different age bins (6–12, 13–17, 18–28 years old). The mean number of tracts (a, c) and the mean connectivity values (b, d) in the anterior-posterior and anterior-left default mode network (DMN) connections were significantly reduced in the adult population (p < 0.05 indicated by *, p < 0.01, indicated by **)
Group differences in functional connectivity
As for the structural connections, partial correlation revealed a significant reduction of functional connectivity between the anterior and the posterior medial regions of the DMN (p = 0.0025) and between the left and right IPL (p = 0.0055) in the group of patients with 22q11DS (Fig. 5). These results remained stable after covarying for the mean framewise displacement and for the Friston 24 motion parameters. There were no significant correlations between functional DMN connectivity and age (p > 0.52) in either of the two groups.
Fig. 5.
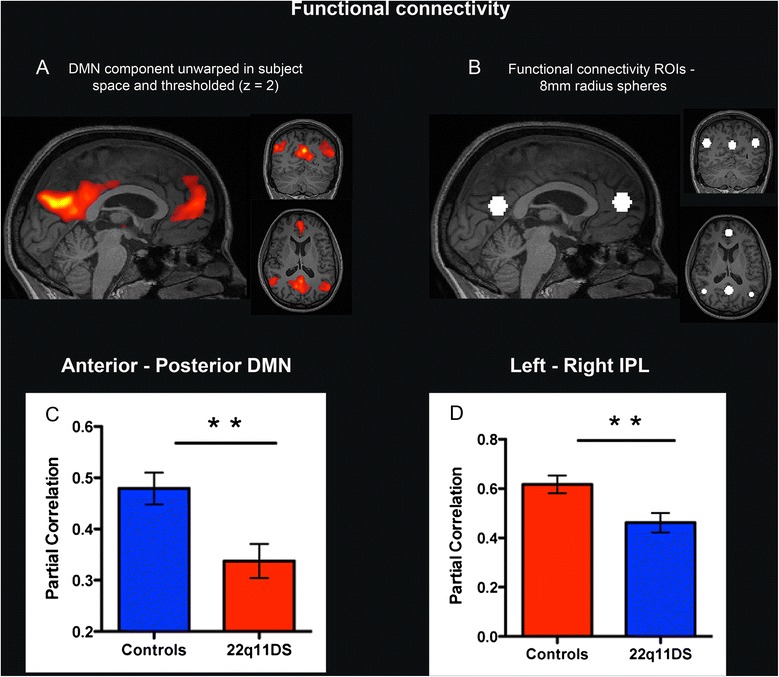
Functional connectivity analysis. The component corresponding to the default mode network (DMN) was isolated, unwrapped in subject space, and thresholded at z = 2 (a). Spheres of 8-mm radius were used as regions of interest (ROIs) for the functional connectivity analysis (b). Partial correlation revealed weaker functional connectivity between the anterior and the posterior DMN nodes (c) and between the left-right IPL (d) in the 22q11DS group compared to the control group (p < 0.01, indicated by **)
Correlation between structural and functional DMN connectivity
We used the Spearman correlation coefficient to evaluate the presence of an association between structural and functional connectivity measures between the anterior and the posterior medial nodes of the DMN. There were no significant correlations in both groups (p > 0.366 in controls and p > 0.317 in 22q11DS). The analysis was then repeated using the three age subgroups but, also in this case, no evidence for a significant correlation between structural and functional DMN connectivity was found (p > 0.74 in children controls, p > 0.38 in children with 22q11DS, p > 0.65 in adolescent controls, p > 0.62 in adolescents with 22q11DS, p > 0.078 in adult controls, p > 0.56 in adults with 22q11DS).
Correlation between DMN connectivity and prodromal psychotic symptoms
The strength of functional and structural DMN connections was not correlated with any of the five positive symptoms scales of the SIPS in our group of patients with 22q11DS (p > 0.24).
Discussion
To the best of our knowledge, this is the first multimodal study investigating DMN structural and functional connectivity in 22q11DS. To date, studies on brain connectivity in patients with the syndrome were based on whole-brain approaches and adopted only one imaging modality, which was either rs-fMRI [32, 33, 70] or DTI [19–31]. Although not focused on the DMN, some of the abovementioned studies reported impaired connectivity within DMN regions [20, 22, 27, 28, 31]. Only one study specifically investigated the DMN functional connectivity in 22q11DS [33], confirming the presence of weaker connections between the anterior and posterior nodes. Using a data-driven approach, we reported a concomitant reduction of functional and structural connectivity between mPFC/ACC and PCC/precuneus in patients with 22q11DS.
Multimodal studies conducted in healthy subjects put forward an association between DMN functional and structural connectivity [48–52, 88], further reporting that this correlation became significant only in adulthood [48]. In our sample, we did not observe a direct correlation between the two connectivity measures, possibly due to the wide age range. Also, the relationship between structural and functional connectivity is complex, and it is therefore difficult to decipher whether alterations in the white matter tracts are responsible for the impairment in the functional connections or vice versa [89]. A previous study [33] reported the presence of stronger functional connectivity between DMN and non-DMN brain regions in 22q11DS, suggesting that impairments in the white matter tracts connecting DMN regions can lead to plastic compensatory adaptations resulting in the development of alternative functional pathways [90]. Studies conducted in animal models would be useful in further clarifying this relationship.
Our findings indicate a disruption in the DMN connectivity in 22q11DS and are consistent with previous evidence collected in patients affected by other neurodevelopmental disorders such as autism spectrum [44, 45] and attention deficit hyperactivity [47, 56] disorders, fragile X syndrome [55], and schizophrenia [38–43, 46, 53]. In particular, two studies simultaneously investigated functional and structural DMN connectivity in schizophrenic patients [53, 54]. While Chamchong et al. [53] showed a concomitant reduction of both connectivity measures, Skudlarski and colleagues [54] found a lower coherence between the DMN functional and structural connections in those with schizophrenia, thereby suggesting that schizophrenic patients develop new patterns of functional connectivity not related to underlying structural connections.
In both studies, functional and structural DMN disconnectivity were associated with the severity of psychotic symptoms [53, 54]. In our group of patients, however, we did not find evidence for a correlation between the DMN structural and functional connectivity impairments and the manifestation of early symptoms of psychosis. In a previous study with a partially overlapping cohort of adolescent patients [32], we observed that increased activity in the left superior frontal gyrus (lSFG) was associated with severity of early psychotic symptoms. However, our present analysis differs from the previous by Debbané and colleagues for two main aspects. First, although the lSFG is considered as part of the DMN, our data-driven approach did not include this region in the anterior node of the DMN. Second, unlike our previous study, we looked at the connectivity between pairs of DMN nodes and not at the activation of a single DMN region. One possible explanation for the lack of correlation between DMN connectivity and SIPS scores in the present study is that we might not have sufficient power. Indeed, as reported in Additional file 1: Table S1, the mean symptom intensity in our group was relatively low. Moreover, the small number of subjects having major to severe psychotic symptoms (three affected by a psychotic disorder and five with an UHR) prevented the possibility of comparing the DMN connectivity between patients with and without such symptoms. Given the dynamic nature of neurodevelopmental trajectories in psychotic spectrum disorders, future longitudinal studies may further observe different connectivity patterns at different stages of progression of the disorder.
Moreover, we observed that structural connectivity between the anterior and the posterior DMN nodes did not typically develop with age in 22q11DS, supporting the claim that maturation of brain connectivity is impaired in patients affected by neurodevelopmental diseases [91]. In line with previous findings in healthy subjects [48, 61, 92], we report an age-related increase of the DMN structural connectivity in our control group. However, we did not observe a similar trend of increased connectivity with age in 22q11DS (Fig. 3). Consequently, structural connectivity did not differ between patients and controls in the groups of children and adolescents; however, reduced structural connectivity was observed in adults affected by 22q11DS (Fig. 4). Such findings largely corroborate previous observations of deviant developmental trajectories in 22q11DS, using different imaging modalities [58–60, 93], including our previous finding of a lack of age-related increase in FA in patients with 22q11DS [31]. Also, a study using 1H spectroscopy [60] reported an absence of age-associated decrease in the NAA levels of patients with 22q11DS, indicating alterations in cortical development. Anatomical studies also provided evidence of abnormal neurodevelopmental trajectories in 22q11DS, such as volumetric impairments in gray matter maturation during the transition into late adolescence-young adulthood [58, 59] and greater cortical loss during adolescence [57]. The currently observed absence of typical increase in structural connectivity with age adds an additional piece to the complex pattern of cerebral maturation associated with 22q11DS during development.
Conclusions
This study reported original evidence for a concomitant reduction in structural and functional connectivity between core medial nodes of the DMN in 22q11DS. Additionally, we found that structural DMN connections did not typically develop with age in patients with 22q11DS, confirming the presence of altered developmental trajectories already reported in this group of patients.
However, there were several limitations to the current study. Firstly, we decided to employ a probabilistic tractography algorithm [84] to partially reduce the problem of crossing fibers. However, as discussed in [31], tractography studies bear some limitations. Another issue concerns head motion. Indeed, with exclusion criteria of 3-mm translation and 3° rotation, we excluded 55 subjects. Even after excluding the subjects that moved most, the mean framewise displacement remained significantly greater in the group of patients than in the control participants. Possible factors that can explain motion in our sample are the length of our scanner protocols (50–70 min including a high-resolution T1-weighted MRI, a diffusion acquisition, resting-state fMRI, and functional task), the young age of the participants, or the presence of cognitive deficits and psychotic symptoms. Therefore, using more stringent selection criteria may introduce a bias in our analysis, resulting in the inclusion of the oldest patients with less comorbidity. In order to account for motion artifacts, we further performed several steps (no between-group difference in mean translation and rotation and regression of motion parameters), but we cannot totally exclude the effect of residual motion on the results. A third limitation is that the mean IQ values significantly differ between patient and control groups. Although the connectivity measures did not correlate with IQ, thereby suggesting that the group differences cannot be attributed to differences in IQ values, only the recruitment of IQ-matched control participants could confirm this. Finally, although our findings indicate impaired maturation of the white matter tracts connecting the DMN in 22q11DS, longitudinal studies are necessary to confirm the developmental trajectories of white matter maturation.
Acknowledgements
This study was supported by the Swiss National Science Foundation (SNF) (Grant numbers: to S. Eliez 324730_121996 and 324730_144260; to D. Van De Ville PP00P2-146318) and by the National Center of Competence in Research (NCCR) “Synapsy-The Synaptic Bases of Mental Diseases” (SNF, Grant number: 51AU40_125759). E. Scariati (#145250) and M. Schaer (#145760) were supported by a fellowship from the SNF. We would like to thank Reem Jan and Angeline Mihailov for the manuscript proofreading.
Additional file
Supplementary tables. Table S1. Mean SIPS scores for positive and negative symptoms subscales. Table S2. Functional data motion parameters. Table S3. Statistical analysis of structural connectivity after excluding the subjects receiving medications at the time of the visit.
Footnotes
Competing interests
The authors declare that they have no competing interests.
Authors’ contributions
MCP, MSchaer, ES, and SE designed the study; MCP, ES, MS, MD, and SE acquired the data, including magnetic resonance imaging and clinical assessments of the study participants; MCP, MSchaer, and ES analyzed the data; MCP, MSchaer, and MD analyzed and interpreted the clinical data; MCP and MSchaer undertook the statistical analysis; DVDV supervised the technical aspects of the data analysis; MCP and MSchaer wrote the first draft of the manuscript; and all authors contributed to the interpretation of the results and the writing of the manuscript. All authors have approved the final manuscript.
Contributor Information
Maria Carmela Padula, Phone: +41 22 388.67.31, Email: Maria.Padula@unige.ch.
Marie Schaer, Email: Marie.Schaer@unige.ch.
Elisa Scariati, Email: Elisa.Scariati@unige.ch.
Maude Schneider, Email: Maude.Schneider@unige.ch.
Dimitri Van De Ville, Email: Dimitri.VanDeVille@unige.ch.
Martin Debbané, Email: Martin.Debbane@unige.ch.
Stephan Eliez, Email: Stephan.Eliez@unige.ch.
References
- 1.Shprintzen RJ. Velo-cardio-facial syndrome: 30 years of study. Dev Disabil Res Rev. 2008;14:3–10. doi: 10.1002/ddrr.2. [DOI] [PMC free article] [PubMed] [Google Scholar]
- 2.Glaser B, Mumme DL, Blasey C, Morris MA, Dahoun SP, Antonarakis SE, et al. Language skills in children with velocardiofacial syndrome (deletion 22q11.2). J Pediatr. 2002;140:753–8. [DOI] [PubMed]
- 3.Green T, Gothelf D, Glaser B, Debbane M, Frisch A, Kotler M, et al. Psychiatric disorders and intellectual functioning throughout development in velocardiofacial (22q11.2 deletion) syndrome. J Am Acad Child Adolesc Psychiatry. 2009;48:1060–8. [DOI] [PubMed]
- 4.Swillen A, Vandeputte L, Cracco J, Maes B, Ghesquière P, Devriendt K, et al. Neuropsychological, learning and psychosocial profile of primary school aged children with the Velo-Cardio-Facial Syndrome (22q11 Deletion): evidence for a nonverbal learning disability? Child Neuropsychol. 1999;5:230–41. doi: 10.1076/0929-7049(199912)05:04;1-R;FT230. [DOI] [PubMed] [Google Scholar]
- 5.De Smedt B, Devriendt K, Fryns JP, Vogels A, Gewillig M, Swillen A. Intellectual abilities in a large sample of children with velo-cardio-facial syndrome: an update. J Intellect Disabil Res. 2007;51:666–70. doi: 10.1111/j.1365-2788.2007.00955.x. [DOI] [PubMed] [Google Scholar]
- 6.Lewandowski KE, Shashi V, Berry PM, Kwapil TR. Schizophrenic-like neurocognitive deficits in children and adolescents with 22q11 deletion syndrome. Am J Med Genet B Neuropsychiatr Genet. 2007;144B:27–36. doi: 10.1002/ajmg.b.30379. [DOI] [PubMed] [Google Scholar]
- 7.Murphy KC, Jones LA, Owen MJ. High rates of schizophrenia in adults with velo-cardio-facial syndrome. Arch Gen Psychiatry. 1959;56:940–5. doi: 10.1001/archpsyc.56.10.940. [DOI] [PubMed] [Google Scholar]
- 8.Bressler SL, Menon V. Large-scale brain networks in cognition: emerging methods and principles. Trends Cogn Sci. 2010;14:277–90. doi: 10.1016/j.tics.2010.04.004. [DOI] [PubMed] [Google Scholar]
- 9.Menon V. Large-scale brain networks and psychopathology: a unifying triple network model. Trends Cogn Sci. 2011;15:483–506. doi: 10.1016/j.tics.2011.08.003. [DOI] [PubMed] [Google Scholar]
- 10.Hagmann P, Sporns O, Madan N, Cammoun L, Pienaar R, Wedeen VJ, et al. White matter maturation reshapes structural connectivity in the late developing human brain. PNAS. 2010;107:9067–19072. doi: 10.1073/pnas.1009073107. [DOI] [PMC free article] [PubMed] [Google Scholar]
- 11.Seidl AH. Regulation of conduction time along axons. Neuroscience. 2014;276:126–34. doi: 10.1016/j.neuroscience.2013.06.047. [DOI] [PMC free article] [PubMed] [Google Scholar]
- 12.Lebel C, Gee M, Camicioli R, Wieler M, Martin W, Beaulieu C. Diffusion tensor imaging of white matter tract evolution over the lifespan. Neuroimage. 2012;60:340–52. doi: 10.1016/j.neuroimage.2011.11.094. [DOI] [PubMed] [Google Scholar]
- 13.Fair DA, Cohen AL, Dosenbach NU, Church JA, Miezin FM, Barch DM, et al. The maturing architecture of the brain’s default network. Proc Natl Acad Sci U S A. 2008;105:4028–32. doi: 10.1073/pnas.0800376105. [DOI] [PMC free article] [PubMed] [Google Scholar]
- 14.Fair DA, Cohen AL, Power JD, Dosenbach NU, Church JA, Miezin FM, et al. Functional brain networks develop from a “local to distributed” organization. PLoS Comput Biol. 2009;5:e1000381. doi: 10.1371/journal.pcbi.1000381. [DOI] [PMC free article] [PubMed] [Google Scholar]
- 15.Supekar K, Musen M, Menon V. Development of large-scale functional brain networks in children. PLoS Biol. 2009;7:1–15. doi: 10.1371/journal.pbio.1000157. [DOI] [PMC free article] [PubMed] [Google Scholar]
- 16.Ameis SH, Catani M. Altered white matter connectivity as a neural substrate for social impairment in autism spectrum disorder. Cortex. 2015;62C:158–81. doi: 10.1016/j.cortex.2014.10.014. [DOI] [PubMed] [Google Scholar]
- 17.Shaw P, Gogtay N, Rapoport J. Childhood psychiatric disorders as anomalies in neurodevelopmental trajectories. Hum Brain Mapp. 2010;31:917–25. doi: 10.1002/hbm.21028. [DOI] [PMC free article] [PubMed] [Google Scholar]
- 18.Gogtay N, Lu A, Leow AD, Klunder AD, Lee AD, Chavez A, et al. Three-dimensional brain growth abnormalities in childhood-onset schizophrenia visualized by using tensor-based morphometry. Proc Natl Acad Sci U S A. 2008;105:15979–84. doi: 10.1073/pnas.0806485105. [DOI] [PMC free article] [PubMed] [Google Scholar]
- 19.Sundram F, Campbell LE, Azuma R, Daly E, Bloemen OJ, Barker GJ, et al. White matter microstructure in 22q11 deletion syndrome: a pilot diffusion tensor imaging and voxel-based morphometry study of children and adolescents. J Neurodev Disord. 2010;2:77–92. doi: 10.1007/s11689-010-9043-6. [DOI] [PMC free article] [PubMed] [Google Scholar]
- 20.Kates WR, Olszewski AK, Gnirke MH, Kikinis Z, Nelson J, Antshel KM, et al. White matter microstructural abnormalities of the cingulum bundle in youths with 22q11.2 deletion syndrome: associations with medication, neuropsychological function, and prodromal symptoms of psychosis. Schizophr Res. 2015;161:76–84. doi: 10.1016/j.schres.2014.07.010. [DOI] [PMC free article] [PubMed] [Google Scholar]
- 21.Villalon-Reina J, Jahanshad N, Beaton E, Toga AW, Thompson PM, Simon TJ. White matter microstructural abnormalities in girls with chromosome 22q11.2 deletion syndrome, fragile X or Turner syndrome as evidenced by diffusion tensor imaging. Neuroimage. 2013;81:441–54. doi: 10.1016/j.neuroimage.2013.04.028. [DOI] [PMC free article] [PubMed] [Google Scholar]
- 22.da Silva Alves F, Schmitz N, Bloemen O, van der Meer J, Meijer J, Boot E, et al. White matter abnormalities in adults with 22q11 deletion syndrome with and without schizophrenia. Schizophr Res. 2011;132:75–83. doi: 10.1016/j.schres.2011.07.017. [DOI] [PubMed] [Google Scholar]
- 23.Simon TJ, Ding L, Bish JP, McDonald-McGinn DM, Zackai EH, Gee J. Volumetric, connective, and morphologic changes in the brains of children with chromosome 22q11.2 deletion syndrome: an integrative study. Neuroimage. 2005;25:169–80. doi: 10.1016/j.neuroimage.2004.11.018. [DOI] [PubMed] [Google Scholar]
- 24.Kikinis Z, Asami T, Bouix S, Finn CT, Ballinger T, Tworog-Dube E, et al. Reduced fractional anisotropy and axial diffusivity in white matter in 22q11.2 deletion syndrome: a pilot study. Schizophr Res. 2012;141:35–9. doi: 10.1016/j.schres.2012.06.032. [DOI] [PMC free article] [PubMed] [Google Scholar]
- 25.Deng Y, Goodrich-Hunsaker NJ, Cabaral M, Amaral DG, Buonocore MH, Harvey D, et al. Disrupted fornix integrity in children with chromosome 22q11.2 deletion syndrome. Psychiatry Res. 2015;232:106–14. doi: 10.1016/j.pscychresns.2015.02.002. [DOI] [PMC free article] [PubMed] [Google Scholar]
- 26.Simon TJ, Wu Z, Avants B, Zhang H, Gee JC, Stebbins GT. Atypical cortical connectivity and visuospatial cognitive impairments are related in children with chromosome 22q11.2 deletion syndrome. Behav Brain Funct. 2008;4:25. doi: 10.1186/1744-9081-4-25. [DOI] [PMC free article] [PubMed] [Google Scholar]
- 27.Radoeva PD, Coman IL, Antshel KM, Fremont W, McCarthy CS, Kotkar A, et al. Atlas-based white matter analysis in individuals with velo-cardio-facial syndrome (22q11.2 deletion syndrome) and unaffected siblings. Behav Brain Funct. 2012;8:38. doi: 10.1186/1744-9081-8-38. [DOI] [PMC free article] [PubMed] [Google Scholar]
- 28.Jalbrzikowski M, Villalon-Reina JE, Karlsgodt KH, Senturk D, Chow C, Thompson PM, et al. Altered white matter microstructure is associated with social cognition and psychotic symptoms in 22q11.2 microdeletion syndrome. Front Behav Neurosci. 2014;8:393. doi: 10.3389/fnbeh.2014.00393. [DOI] [PMC free article] [PubMed] [Google Scholar]
- 29.Barnea-Goraly N, Menon V, Krasnow B, Ko A, Reiss A, Eliez S. Investigation of white matter structure in velocardiofacial syndrome: a diffusion tensor imaging study. Am J Psychiatry. 2003;160:1863–9. doi: 10.1176/appi.ajp.160.10.1863. [DOI] [PubMed] [Google Scholar]
- 30.Barnea-Goraly N, Eliez S, Menon V, Bammer R, Reiss AL. Arithmetic ability and parietal alterations: a diffusion tensor imaging study in velocardiofacial syndrome. Brain Res Cogn Brain Res. 2005;25:735–40. doi: 10.1016/j.cogbrainres.2005.09.013. [DOI] [PubMed] [Google Scholar]
- 31.Ottet MC, Schaer M, Cammoun L, Schneider M, Debbané M, Thiran JP, et al. Reduced fronto-temporal and limbic connectivity in the 22q11.2 deletion syndrome: vulnerability markers for developing schizophrenia? PLoS One. 2013;8:e58429. doi: 10.1371/journal.pone.0058429. [DOI] [PMC free article] [PubMed] [Google Scholar]
- 32.Debbané M, Lazouret M, Lagioia A, Schneider M, Van De Ville D, Eliez S. Resting-state networks in adolescents with 22q11.2 deletion syndrome: associations with prodromal symptoms and executive functions. Schizophr Res. 2012;139:33–9. doi: 10.1016/j.schres.2012.05.021. [DOI] [PubMed] [Google Scholar]
- 33.Schreiner MJ, Karlsgodt KH, Uddin LQ, Chow C, Congdon E, Jalbrzikowski M, et al. Default mode network connectivity and reciprocal social behavior in 22q11.2 deletion syndrome. Soc Cogn Affect Neurosci. 2014;9:1261–7. doi: 10.1093/scan/nst114. [DOI] [PMC free article] [PubMed] [Google Scholar]
- 34.Greicius MD, Krasnow B, Reiss AL, Menon V. Functional connectivity in the resting brain: a network analysis of the default mode hypothesis. Proc Natl Acad Sci U S A. 2003;100:253–8. doi: 10.1073/pnas.0135058100. [DOI] [PMC free article] [PubMed] [Google Scholar]
- 35.Spreng RN, Mar RA, Kim ASN. The common neural basis of autobiographical memory, prospection, navigation, theory of mind, and the default mode: a quantitative meta-analysis. J Cognitive Neurosci. 2008;21:489–510. doi: 10.1162/jocn.2008.21029. [DOI] [PubMed] [Google Scholar]
- 36.Raichle ME, MacLeod AM, Snyder AZ, Powers WJ, Gusnard DA, Shulman GL. A default mode of brain function. PNAS. 2001;98:676–82. doi: 10.1073/pnas.98.2.676. [DOI] [PMC free article] [PubMed] [Google Scholar]
- 37.Rosazza C, Minati L. Resting-state brain networks: literature review and clinical applications. Neurol Sci. 2011;32:773–85. doi: 10.1007/s10072-011-0636-y. [DOI] [PubMed] [Google Scholar]
- 38.Tang J, Liao Y, Song M, Gao JH, Zhou B, Tan C, et al. Aberrant default mode functional connectivity in early onset schizophrenia. PLoS One. 2013;8 doi: 10.1371/journal.pone.0071061. [DOI] [PMC free article] [PubMed] [Google Scholar]
- 39.Chang X, Shen H, Wang L, Liu Z, Xin W, Hu D, et al. Altered default mode and fronto-parietal network subsystems in patients with schizophrenia and their unaffected siblings. Brain Res. 2014;1562:87–99. doi: 10.1016/j.brainres.2014.03.024. [DOI] [PubMed] [Google Scholar]
- 40.Mingoia G, Wagner G, Langbein K, Maitra R, Smesny S, Dietzek M, et al. Default mode network activity in schizophrenia studied at resting state using probabilistic ICA. Schizophr Res. 2012;138:143–9. doi: 10.1016/j.schres.2012.01.036. [DOI] [PubMed] [Google Scholar]
- 41.Orliac F, Naveau M, Joliot M, Delcroix N, Razafimandimby A, Brazo P, et al. Links among resting-state default-mode network, salience network, and symptomatology in schizophrenia. Schizophr Res. 2013;148:74–80. doi: 10.1016/j.schres.2013.05.007. [DOI] [PubMed] [Google Scholar]
- 42.Jang JH, Jung WH, Choi JS, Choi CH, Kang DH, Shin NY, et al. Reduced prefrontal functional connectivity in the default mode network is related to greater psychopathology in subjects with high genetic loading for schizophrenia. Schizophr Res. 2011;127:58–65. doi: 10.1016/j.schres.2010.12.022. [DOI] [PubMed] [Google Scholar]
- 43.Fitzsimmons J, Kubicki M, Shenton ME. Review of functional and anatomical brain connectivity findings in schizophrenia. Curr Opin Psychiatry. 2013;26:172–87. doi: 10.1097/YCO.0b013e32835d9e6a. [DOI] [PubMed] [Google Scholar]
- 44.Murdaugh DL, Shinkareva SV, Deshpande HR, Wang J, Pennick MR, Kana RK. Differential deactivation during mentalizing and classification of autism based on default mode network connectivity. PLoS One. 2012;7 doi: 10.1371/journal.pone.0050064. [DOI] [PMC free article] [PubMed] [Google Scholar]
- 45.Kennedy DP, Courchesne E. The intrinsic functional organization of the brain is altered in autism. Neuroimage. 2008;39:1877–85. doi: 10.1016/j.neuroimage.2007.10.052. [DOI] [PubMed] [Google Scholar]
- 46.Kubicki M, McCarley R, Westin CF, Park HJ, Maier S, Kikinis R, et al. A review of diffusion tensor imaging studies in schizophrenia. J Psychiatr Res. 2007;41:15–30. doi: 10.1016/j.jpsychires.2005.05.005. [DOI] [PMC free article] [PubMed] [Google Scholar]
- 47.Davenport ND, Karatekin C, White T, Lim KO. Differential fractional anisotropy abnormalities in adolescents with ADHD or schizophrenia. Psychiatry Res. 2010;181:193–8. doi: 10.1016/j.pscychresns.2009.10.012. [DOI] [PMC free article] [PubMed] [Google Scholar]
- 48.Supekar K, Uddin LQ, Prater K, Amin H, Greicius MD, Menon V. Development of functional and structural connectivity within the default mode network in young children. Neuroimage. 2010;52:290–301. doi: 10.1016/j.neuroimage.2010.04.009. [DOI] [PMC free article] [PubMed] [Google Scholar]
- 49.Greicius MD, Supekar K, Menon V, Dougherty RF. Resting-state functional connectivity reflects structural connectivity in the default mode network. Cereb Cortex. 2009;19:72–8. doi: 10.1093/cercor/bhn059. [DOI] [PMC free article] [PubMed] [Google Scholar]
- 50.Horn A, Ostwald D, Reisert M, Blankenburg F. The structural-functional connectome and the default mode network of the human brain. Neuroimage. 2014;102 Pt 1:142–51. doi: 10.1016/j.neuroimage.2013.09.069. [DOI] [PubMed] [Google Scholar]
- 51.van Oort ES, van Cappellen van Walsum AM, Norris DG. An investigation into the functional and structural connectivity of the default mode network. Neuroimage. 2013;90C:381–9. doi: 10.1016/j.neuroimage.2013.12.051. [DOI] [PubMed] [Google Scholar]
- 52.Khalsa S, Mayhew SD, Chechlacz M, Bagary M, Bagshaw AP. The structural and functional connectivity of the posterior cingulate cortex: comparison between deterministic and probabilistic tractography for the investigation of structure-function relationships. Neuroimage. 2014;102 Pt 1:118–27. doi: 10.1016/j.neuroimage.2013.12.022. [DOI] [PubMed] [Google Scholar]
- 53.Camchong J, MacDonald AW, 3rd, Bell C, Mueller BA, Lim KO. Altered functional and anatomical connectivity in schizophrenia. Schizophr Bull. 2011;37:640–50. doi: 10.1093/schbul/sbp131. [DOI] [PMC free article] [PubMed] [Google Scholar]
- 54.Skudlarski P, Jagannathan K, Anderson K, Stevens MC, Calhoun VD, Skudlarska BA, et al. Brain connectivity is not only lower but different in schizophrenia: a combined anatomical and functional approach. Biol Psychiatry. 2010;68:61–9. doi: 10.1016/j.biopsych.2010.03.035. [DOI] [PMC free article] [PubMed] [Google Scholar]
- 55.Menon V, Leroux J, White CD, Reiss AL. Frontostriatal deficits in fragile X syndrome: relation to FMR1 gene expression. Proc Natl Acad Sci U S A. 2004;101:3615–20. doi: 10.1073/pnas.0304544101. [DOI] [PMC free article] [PubMed] [Google Scholar]
- 56.Tian L, Jiang T, Wang Y, Zang Y, He Y, Liang M, et al. Altered resting-state functional connectivity patterns of anterior cingulate cortex in adolescents with attention deficit hyperactivity disorder. Neurosci Lett. 2006;400:39–43. doi: 10.1016/j.neulet.2006.02.022. [DOI] [PubMed] [Google Scholar]
- 57.Schaer M, Debbane M, Bach Cuadra M, Ottet MC, Glaser B, Thiran JP, et al. Deviant trajectories of cortical maturation in 22q11.2 deletion syndrome (22q11DS): a cross-sectional and longitudinal study. Schizophr Res. 2009;115:182–90. doi: 10.1016/j.schres.2009.09.016. [DOI] [PubMed] [Google Scholar]
- 58.Gothelf D, Hoeft F, Ueno T, Sugiura L, Lee AD, Thompson P, et al. Developmental changes in multivariate neuroanatomical patterns that predict risk for psychosis in 22q11.2 deletion syndrome. J Psychiatr Res. 2011;45:322–31. doi: 10.1016/j.jpsychires.2010.07.008. [DOI] [PMC free article] [PubMed] [Google Scholar]
- 59.Gothelf D, Penniman L, Gu E, Eliez S, Reiss AL. Developmental trajectories of brain structure in adolescents with 22q11.2 deletion syndrome: a longitudinal study. Schizophr Res. 2007;96:72–81. doi: 10.1016/j.schres.2007.07.021. [DOI] [PMC free article] [PubMed] [Google Scholar]
- 60.Shashi V, Veerapandiyan A, Keshavan MS, Zapadka M, Schoch K, Kwapil TR, et al. Altered development of the dorsolateral prefrontal cortex in chromosome 22q11.2 deletion syndrome: an in vivo proton spectroscopy study. Biol Psychiatry. 2012;72:684–91. doi: 10.1016/j.biopsych.2012.04.023. [DOI] [PMC free article] [PubMed] [Google Scholar]
- 61.Lebel C, Beaulieu C. Longitudinal development of human brain wiring continues from childhood into adulthood. J Neurosci. 2011;31:10937–47. doi: 10.1523/JNEUROSCI.5302-10.2011. [DOI] [PMC free article] [PubMed] [Google Scholar]
- 62.Blakemore SJ. Imaging brain development: the adolescent brain. Neuroimage. 2012;61:397–406. doi: 10.1016/j.neuroimage.2011.11.080. [DOI] [PubMed] [Google Scholar]
- 63.Shim G, Oh JS, Jung WH, Jang JH, Choi CH, Kim E, et al. Altered resting-state connectivity in subjects at ultra-high risk for psychosis: an fMRI study. Behav Brain Funct. 2010;6:58. doi: 10.1186/1744-9081-6-58. [DOI] [PMC free article] [PubMed] [Google Scholar]
- 64.Miller TJ, McGlashan TH, Rosen JL, Somjee L, Markovich PJ, Stein K, et al. Prospective diagnosis of the initial prodrome for schizophrenia based on the structured interview for prodromal syndromes: preliminary evidence of interrater reliability and predictive validity. Am J Psychiatry. 2002;159:863–5. doi: 10.1176/appi.ajp.159.5.863. [DOI] [PubMed] [Google Scholar]
- 65.Wechsler D. Wechsler Intelligence Scale for Children - 3. Manual San Antonio TX: The Psychological Corporation; 1991. [Google Scholar]
- 66.Wechsler D. Wechsler Adult Intelligence Scale - 3. Manual San Antonio TX: The Psychological Corporation; 1997. [Google Scholar]
- 67.Reich W. Diagnostic Interview for Children and Adolescents (DICA). J Am Acad Child Adolesc Psychiatry. 2000;39. [DOI] [PubMed]
- 68.Kaufman J, Birmaher B, Brent D, Rao U, Flynn C, Moreci P, et al. Schedule for Affective Disorders and Schizophrenia for School-Age Children-Present and Lifetime Version (K-SADS-PL): initial reliability and validity data. J Am Acad Child Adolesc Psychiatry. 1997;36:980–8. [DOI] [PubMed]
- 69.First MB, Gibbon M, Spitzer R, Williams J. Structured Clinical Interview for the DSM-IV Axis I Disorders (SCID-I). Washington, DC: American Psychiatric Association; 1996.
- 70.Scariati E, Schaer M, Richiardi J, Schneider M, Debbané M, Van De Ville D, et al. Identifying 22q11.2 deletion syndrome and psychosis using resting-state connectivity patterns. Brain Topogr. 2014;27:808–21. doi: 10.1007/s10548-014-0356-8. [DOI] [PubMed] [Google Scholar]
- 71.Calhoun VD, Liu J, Adali T. A review of group ICA for fMRI data and ICA for joint inference of imaging, genetic, and ERP data. Neuroimage. 2009;45:S163–72. doi: 10.1016/j.neuroimage.2008.10.057. [DOI] [PMC free article] [PubMed] [Google Scholar]
- 72.Tohka J, Foerde K, Aron AR, Tom SM, Toga AW, Poldrack RA. Automatic independent component labeling for artifact removal in fMRI. Neuroimage. 2008;39:1227–45. doi: 10.1016/j.neuroimage.2007.10.013. [DOI] [PMC free article] [PubMed] [Google Scholar]
- 73.Montojo CA, Jalbrzikowski M, Congdon E, Domicoli S, Chow C, Dawson C, et al. Neural substrates of inhibitory control deficits in 22q11.2 deletion syndromedagger. Cereb Cortex. 2015;25:1069–79. doi: 10.1093/cercor/bht304. [DOI] [PMC free article] [PubMed] [Google Scholar]
- 74.Joseph JE, Zhu X, Gundran A, Davies F, Clark JD, Ruble L, et al. Typical and atypical neurodevelopment for face specialization: an fMRI study. J Autism Dev Disord. 2015;45:1725–41. doi: 10.1007/s10803-014-2330-4. [DOI] [PMC free article] [PubMed] [Google Scholar]
- 75.Scherf KS, Elbich D, Minshew N, Behrmann M. Individual differences in symptom severity and behavior predict neural activation during face processing in adolescents with autism. Neuroimage Clin. 2015;7:53–67. doi: 10.1016/j.nicl.2014.11.003. [DOI] [PMC free article] [PubMed] [Google Scholar]
- 76.Hall SS, Jiang H, Reiss AL, Greicius MD. Identifying large-scale brain networks in fragile X syndrome. JAMA Psychiatry. 2013;70:1215–23. doi: 10.1001/jamapsychiatry.2013.247. [DOI] [PMC free article] [PubMed] [Google Scholar]
- 77.Tamm L, Menon V, Johnston CK, Hess DR, Reiss AL. fMRI study of cognitive interference processing in females with fragile X syndrome. J Cognitive Neurosci. 2002;14:160–71. doi: 10.1162/089892902317236812. [DOI] [PubMed] [Google Scholar]
- 78.Uddin LQ, Supekar KS, Ryali S, Menon V. Dynamic reconfiguration of structural and functional connectivity across core neurocognitive brain networks with development. J Neurosci. 2011;31:18578–89. doi: 10.1523/JNEUROSCI.4465-11.2011. [DOI] [PMC free article] [PubMed] [Google Scholar]
- 79.Shirer WR, Ryali S, Rykhlevskaia E, Menon V, Greicius MD. Decoding subject-driven cognitive states with whole-brain connectivity patterns. Cereb Cortex. 2012;22:158–65. doi: 10.1093/cercor/bhr099. [DOI] [PMC free article] [PubMed] [Google Scholar]
- 80.Smith SM. Fast robust automated brain extraction. Hum Brain Mapp. 2002;17:143–55. doi: 10.1002/hbm.10062. [DOI] [PMC free article] [PubMed] [Google Scholar]
- 81.Jenkinson M, Bannister P, Brady M, Smith S. Improved optimization for the robust and accurate linear registration and motion correction of brain images. NeuroImage. 2002;17:825–41. doi: 10.1006/nimg.2002.1132. [DOI] [PubMed] [Google Scholar]
- 82.Jenkinson M, Smith S. A global optimisation method for robust affine registration of brain images. Medical Image Anal. 2001;5:143–56. doi: 10.1016/S1361-8415(01)00036-6. [DOI] [PubMed] [Google Scholar]
- 83.Tzourio-Mazoyer N, Landeau B, Papathanassiou D, Crivello F, Etard O, Delcroix N, et al. Automated anatomical labeling of activations in SPM using a macroscopic anatomical parcellation of the MNI MRI single-subject brain. Neuroimage. 2002;15:273–89. doi: 10.1006/nimg.2001.0978. [DOI] [PubMed] [Google Scholar]
- 84.Behrens TE, Berg HJ, Jbabdi S, Rushworth MF, Woolrich MW. Probabilistic diffusion tractography with multiple fibre orientations: what can we gain? Neuroimage. 2007;34:144–55. doi: 10.1016/j.neuroimage.2006.09.018. [DOI] [PMC free article] [PubMed] [Google Scholar]
- 85.Ciccarelli O, Behrens TE, Altmann DR, Orrell RW, Howard RS, Johansen-Berg H, et al. Probabilistic diffusion tractography: a potential tool to assess the rate of disease progression in amyotrophic lateral sclerosis. Brain. 2006;129:1859–71. [DOI] [PubMed]
- 86.Quade D. Rank analysis of covariance. J Stat Assoc. 1967;62:1187–200.
- 87.Miller GA, Chapman JP. Misunderstanding analysis of covariance. J Abnorm Psych. 2001;110:40–8. doi: 10.1037/0021-843X.110.1.40. [DOI] [PubMed] [Google Scholar]
- 88.Skudlarski P, Jagannathan K, Calhoun VD, Hampson M, Skudlarska BA, Pearlson G. Measuring brain connectivity: diffusion tensor imaging validates resting state temporal correlations. Neuroimage. 2008;43:554–61. doi: 10.1016/j.neuroimage.2008.07.063. [DOI] [PMC free article] [PubMed] [Google Scholar]
- 89.Ding JR, An D, Liao W, Li J, Wu GR, Xu Q, et al. Altered functional and structural connectivity networks in psychogenic non-epileptic seizures. PLoS One. 2013;8 doi: 10.1371/journal.pone.0063850. [DOI] [PMC free article] [PubMed] [Google Scholar]
- 90.Preti MG, Makris N, Papadimitriou G, Laganà MM, Griffanti L, Clerici M, et al. A novel approach of groupwise fMRI-guided tractography allowing to characterize the clinical evolution of Alzheimer’s disease. PLoS One. 2014;9 doi: 10.1371/journal.pone.0092026. [DOI] [PMC free article] [PubMed] [Google Scholar]
- 91.Dennis EL, Thompson PM. Typical and atypical brain development: a review of neuroimaging studies. Dialogues Clin Neurosci. 2013;15:359–83. doi: 10.31887/DCNS.2013.15.3/edennis. [DOI] [PMC free article] [PubMed] [Google Scholar]
- 92.Schmithorst VJ, Yuan W. White matter development during adolescence as shown by diffusion MRI. Brain Cogn. 2010;72:16–25. doi: 10.1016/j.bandc.2009.06.005. [DOI] [PubMed] [Google Scholar]
- 93.Schaer M, Glaser B, Ottet MC, Schneider M, Bach Cuadra M, Debbané M, et al. Regional cortical volumes and congenital heart disease: a MRI study in 22q11.2 deletion syndrome. J Neurodev Disord. 2010;2:224–34. doi: 10.1007/s11689-010-9061-4. [DOI] [PMC free article] [PubMed] [Google Scholar]