Abstract
Graphene–metal composites have potential as novel catalysts due to their unique electrical properties. Here, we report the synthesis of a composite material comprised of monodispersed platinum nanoparticles on high-quality graphene obtained by using two different exfoliation techniques. The material, prepared via an easy, low-cost and reproducible procedure, was evaluated as an electrocatalyst for the hydrogen evolution reaction. The turnover frequency at zero overpotential (TOF0 in 0.1 m phosphate buffer, pH 6.8) was determined to be approximately 4600 h−1. This remarkably high value is likely due to the optimal dispersion of the platinum nanoparticles on the graphene substrate, which enables the material to be loaded with only very small amounts of the noble metal (i.e., Pt) despite the very highly active surface. This study provides a new outlook on the design of novel materials for the development of robust and scalable water-splitting devices.
Keywords: electrocatalysis, graphene, platinum nanoparticles, water reduction
Carbon allotropes have been extensively studied as nanostructured materials for electrocatalytic processes.1,2 The most recently discovered carbon allotrope, graphene, is a material composed of sp2-bonded carbon atoms, with monoatomic thickness, that displays outstanding mechanical and electrical properties.3,4 Combining graphene with catalysts is a worthwhile approach in the construction of novel materials for photo- and electrocatalytic reactions,5–7 and the development of high-quality graphene sheets, comprised of only a few layers of graphene and with a low frequency of defects, is extremely important for these applications.
In contrast, graphene oxide (GO)8 and the reduced graphene oxide (RGO)9 are readily available but don′t exhibit the typical structural and electrical properties of graphene, since oxidation and reduction steps are not able to completely restore the pristine honeycomb lattice of graphene.10 Compared with RGO, exfoliated graphene has few or no functional groups on the surface of the honeycomb lattice, making any kind of direct covalent functionalization of the material difficult. Noncovalent interactions could be an alternative way to decorate graphene with molecules, nanoparticles or other structures. The most commonly used interactions exploited for the decoration of graphene are hydrophobic interactions with aliphatic chains11 or surfactants,12 or π–π stacking between graphene and graphene-like molecules such as pyrene;13 however, other forms of interaction, such as physisorption of metal nanoparticles, can also be used to functionalize graphene.14
Colloidal platinum is one of the best catalysts for electrocatalytic water reduction;15 its use in the form of nanoparticles maximizes the active surface of the catalytic sites, while at the same time minimizing the total amount of platinum used. This feature is of particular interest once the applicability of a platinum-based catalyst is assessed. Moreover, nanoparticles require a support to be used as heterogeneous catalyst, and this support must be able both to drive the charges to the real catalytic site, and to provide mechanical and optical properties to the composite material. In this direction, graphene-metal composites have gained attention in recent years within the field of catalysis16–20 due to the combination of good electrical properties with high transmittance, allowing the material to be coupled to a photosensitizer and to study the photocatalyzed hydrogen evolution reaction (HER).21
Here, we report the synthesis of monodispersed platinum nanoparticles on high-quality graphene and the evaluation of their performance in the electrocatalytic production of H2 from water at neutral pH. For graphene preparation, two different procedures were compared to understand the effect of graphene morphology on the platinum nanoparticles decoration. The electrocatalytic activity of the two nanocomposites towards the HER was evaluated and compared to a commercial carbon-supported platinum (Pt/C) catalyst.
The first exfoliation procedure (termed PCA-G), reported by An et al.,22 exploits the functions of 1-pyrenecarboxylic acid (PCA) both as an exfoliating agent and as a stabilizer; in fact, PCA is used as a molecular wedge to cleave natural graphite, and thanks to its π–π interactions and its polar functional group, it permits the formation of stable aqueous dispersions of graphene, without breaking the sp2 structure (for the complete procedure used here, see the Supporting Information). The main advantage of the PCA-G technique lies in the compatibility of the procedure with a single-flow process for platinum nanoparticle synthesis. The Raman spectrum of the PCA-G material (see Figure S1 in the Supporting Information) reveals that the exfoliation procedure gives rise to graphene with a low number of defects; the D-band/G-band Raman peak intensity ratio (ID/IG) of 0.074 indicates that the material has low defect density.
In parallel, we exploited a more controlled exfoliation technique (termed NMP-G), developed by the Coleman group,23 based on interaction between the graphene surface and a solvent, in particular a high-boiling-point organic solvent such as 1-methyl-2-pyrrolidone (NMP). In this case, the material was transferred in an aqueous solution of PCA (2×10⁻⁵ m) by filtering on to 0.2 mm polytetrafluoroethylene (PTFE) filters and sonicating the solid cake for 20 minutes, in order to obtain a comparable starting solution to the one obtained via the PCA-assisted exfoliation method for the synthesis of platinum nanoparticles. Analysis of the final aqueous suspension after transfer from NMP suggests very good stability of the exfoliated graphene (Figure S2 in the Supporting Information), as previously reported in literature.24,25 Comparing the absorption spectra of the two solutions (Figure S2 in the Supporting Information), it was possible to determine the concentration of graphene flakes by using the Lambert–Beer equation; a higher concentration was found for the NMP-G sample (2.4 μg mL−1) compared with the concentration found for the PCA-G sample (0.089 μg mL−1).
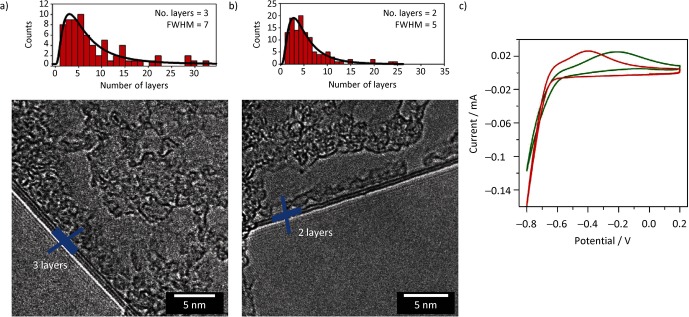
Figure 1 shows the results of high-resolution transmission electron microscopy (HR-TEM) characterization of the products of the two exfoliation techniques. Statistical analysis of the number of layers was made by directly counting the (0,0,2) fringes at the flake folding edges, which correlate directly to the number of layers. As highlighted by the example micrographs shown in Figure 1, the degree of exfoliation was found to be slightly higher, in particular in term of distribution, for the NMP-G sample.
Figure 1.

High-resolution transmission electron microscopy (HR-TEM) images of graphene sheets exfoliated by using a) the PCA-G method involving 1-pyrenecarboxylic acid (PCA) and b) the NMP-G method involving 1-methyl-2-pyrrolidone (NMP); histograms above show the corresponding distribution. c) Comparison of the cyclic voltammetries (CVs) for the PCA-G Pt (—) and NMP-G Pt (—) samples; potentials are referred versus a standard saturated calomel electrode (SCE). v=0.05 V s−1, argon-saturated phosphate buffer solution (pH 6.8).
The effect of the exfoliating method on the electrochemistry of the platinum-functionalized graphene is shown in Figure 1 c and reflects what we observed by HR-TEM; the higher degree of exfoliation in the sample prepared using the NMP-G method gives rise to a composite material with better electronic properties that result in a less resistive electron-transfer process at the electrode.
The synthesis of the nanoparticles was carried out following a procedure adapted from the literature26 and recently reported by some of us.27 The method is based on the chemical reduction of an aqueous solution of a platinum(II) salt (K2PtCl4) by sodium borohydride, in the presence of the exfoliated graphene dispersions. The complete procedure is described in the Supporting Information.
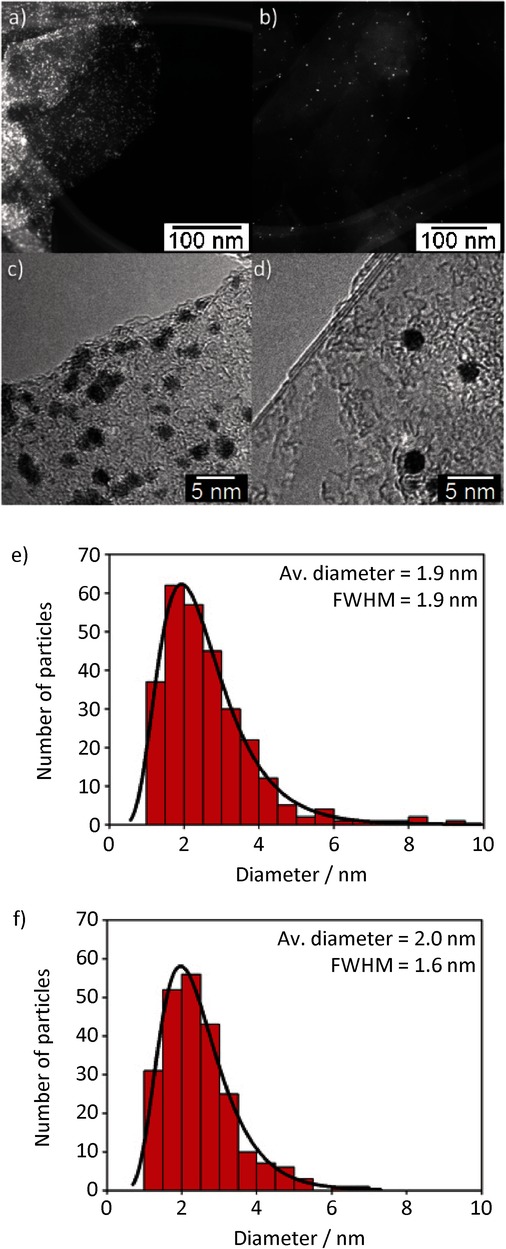
Figure 2 shows the comparison between the results of the platinum nanoparticle decoration of exfoliated graphene using the PCA-G and NMP-G methods. The scanning transmission electron microscope (STEM) and HR-TEM micrographs (Figure 2 a–d) clearly show the strong selectivity of the decoration, without any particles outside the platelets, with a slightly lower concentration of particles in the NMP-G sample. We attributed this observation to the different concentration of graphene flakes for this sample, resulting in a lower platinum nanoparticle/graphene ratio. Nevertheless, both samples are characterized by a rather negligible aggregation of nanoparticles, proving that the graphene–PCA adduct acts as a scaffold for the arrangement of the particles on graphene, preventing the typical coalescence and precipitation issues.
Figure 2.

Comparison between decoration of exfoliated graphene produced with different techniques: PCA-G using 1-pyrenecarboxylic acid (PCA) (left) and NMP-G using 1-methyl-2-pyrrolidone (NMP) (right). a,b) Low-magnification scanning transmission electron microscope (STEM) micrographs of decorated graphene flakes. c,d) High-resolution transmission electron microscopy (HR-TEM) micrographs of flake edges covered by platinum nanoparticles. e,f) Size distribution histogram of the platinum nanoparticles synthesized on graphene. The distribution was fitted by using the Lorentz function, and the average diameter is reported in the inset.
By focusing on the HR-TEM micrographs (Figure 2 a–d), it is possible to notice how the shape is more homogeneous and spherical in the NMP-G sample, while the size distribution reveals a lower degree of polydispersion despite the same average size for both samples. This could be the result of residual NMP on the surface of sample prepared using the NMP-G method; this could also explain the unexpected stability of the graphene dispersion in water. Residual NMP on the surface could also influence the morphology of the particles by confining the growth of the platinum crystal or by decreasing the graphene surface area available for interaction with PCA.
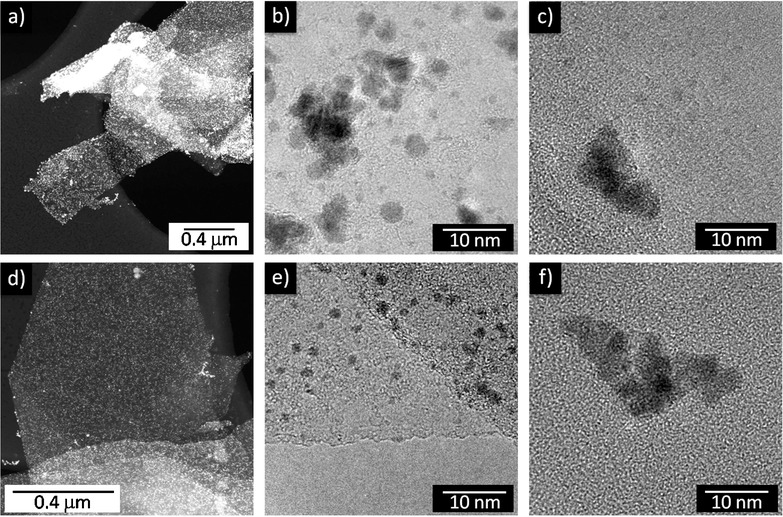
In order to evaluate the influence and the role of PCA on the selectivity of the decoration and on the morphology of the platinum nanoparticles, we prepared some water dispersions of graphite nanoplatelets, simply sonicating a 2 mg mL−1 solution of graphite powder in distilled water for 24 hours. This dispersion was characterized by a very low degree of exfoliation of graphite; however, it allowed us to investigate decoration with platinum nanoparticles in the absence of any secondary variables, such as the influence of an exfoliating agent or a stabilizer. Using these samples, we performed the synthesis of platinum-nanoparticles, following the same method previously reported, with or without the addition of PCA. In both cases, the TEM images demonstrated a strongly selective decoration of the graphite flakes, as showed in Figure 3 a,d. The sample prepared without PCA shows very nonhomogeneous size and shape distributions for the platinum nanoparticles (Figure 3 b), whereas the sample prepared with PCA displays spherical and well-dispersed particles on the graphite platelets (Figure 3 e). Magnification of the sporadic platinum nanoparticles outside the graphene show in both cases dishomogeneous distributions of size and shape due to aggregation of the particles, emphasizing the differences between nanoparticles on and outside the graphene surface for the sample prepared with PCA (Figure 3 c,f).
Figure 3.

Comparison between platinum nanoparticles decoration of graphite platelets in the absence (a,b,c) and in the presence (d,e,f) of 1-pyrenecarboxylic acid (PCA). a,d) Low-magnification scanning transmission electron microscope (STEM) micrographs showing the very selective decoration. b,e) High-resolution transmission electron microscopy (HR-TEM) micrographs of platelets surfaces. c,f) Morphology of the particles outside graphene, which are usually aggregated into clusters.
The results of the latter experiment seem to confirm the hypothesis, formulated by Qian et al.,28 that there is a direct electronic interaction between platinum atoms and graphene. Using density functional theory (DFT) calculations, Qian and co-workers estimated the binding energy. The obtained value of 1.39 eV is not so strong so as to profoundly modify the electronic structure of graphene; however, it is only slightly weaker than a typical chemical bond and thus sufficiently strong enough to selectively decorate the graphene sheets. These evidences suggest that the presence of PCA does not have a significant effect on the binding energy between graphene and colloidal platinum; however, PCA does control the morphology of the nanoparticles and favors their homogeneous dispersion on graphene surface.29
The electrochemistry of the two graphene composites prepared with the PCA-G and NMP-G methods was investigated to test the catalytic activity towards the HER and to gain further information on the properties of our materials. To characterize the two samples, we drop-casted 100 μL of the aqueous suspensions on a screen-printed electrode (SPE) that was used as the working electrode and placed at the bottom of an airtight single-compartment cell, described elsewhere.30 A silver chloride electrode (Ag/AgCl) (3 m) and a platinum spiral were used as a reference and counter electrode, respectively; the potential of the Ag/AgCl electrode was measured before and after every experiment with respect to a standard saturated calomel electrode (SCE). Phosphate buffer solution at pH 6.8 was specifically prepared by commercially available salts, saturated with argon before each measurement and kept under argon at atmospheric pressure.
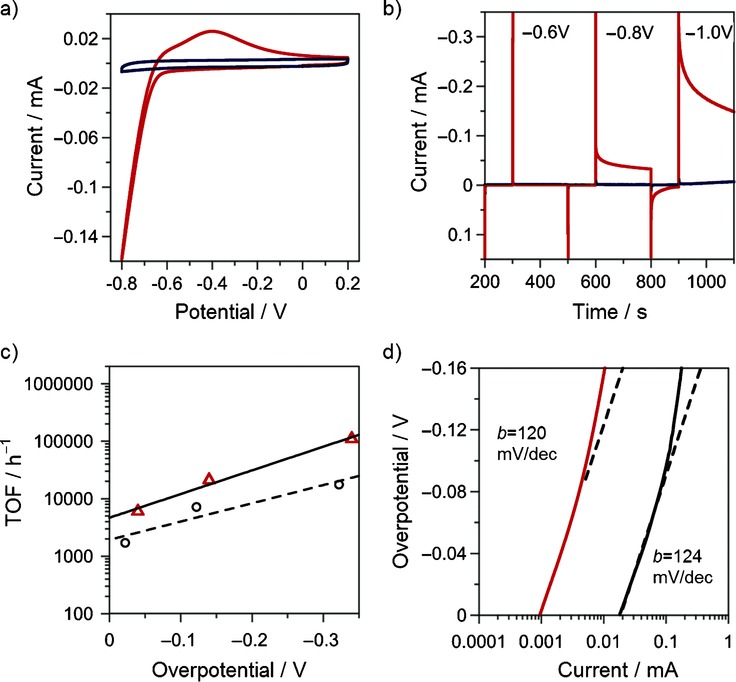
The activity towards the HER was evaluated for the best performing material, NMP-G decorated with platinum nanoparticles (NMP-G Pt) and compared with the model system NMP-G (without metal nanoparticles). The cyclic voltammetries (CVs) are reported in Figure 4 a. The catalytic cathodic current of NMP-G Pt clearly shows the high activity of this material for HER, while the parent system NMP-G is inactive up to large overpotentials (for chronoamperometries over a long time scale, see Figure S2 in the Supporting Information).
Figure 4.

Electrochemical characterization of the various materials, dropcasted on a commercial screen-printed electrode (SPE) (diameter: 2 mm). All measurements were performed at 25 °C in phosphate buffer solution (pH 6.8). a) Cyclic voltammetries (CVs) of NMP-G Pt (red line) and NMP-G (blue line). v=0.05 V s−1, Ar-saturated solution. b) Chronoamperometries for NMP-G Pt (—) and NMP-G (—); potentials are referred versus a standard saturated calomel electrode (SCE). c) The linear relationship of turnover frequency (TOF) versus overpotential (η) for NMP-G Pt (▵/—) and Pt/C (○/– – –); η is calculated as η=E−E0−is*R, where E0 is the thermodynamic potential for the H+/H2 couple (vs SCE): E0(V)=−0.24–0.06*pH=−0.64 V and is*R is the correction for the ohmic drop. d) Tafel plot for NMP-G Pt (—) and Pt/C (—), v=2 mV s−1.
Quantification of the catalytic efficiency of the graphene-based catalyst was performed by the combination of chronoamperometric experiments carried out at various negative potentials (−0.7, −0.8, −1.0 V versus Ag/AgCl; Figure 4 b) and cyclic voltammetry (see Supporting Information). Indeed the turnover number (TON; moles of product per moles of catalyst) and turnover frequencies (TOF; TON per time unit) with this approach were calculated according to Equations (1) and (2), where QNMP−GPt is the integrated charge recorded at the electrode and related to the amount of evolved hydrogen (2H++2e−→H2) for the sample NMP-G Pt, QNMP−G is the contribution of the carbon-based substrate NMP-G (see Figure S3 in the Supporting Information), and QPt is the charge referred to the electroactive platinum present in the composite (Figure S4 in the Supporting Information) and t is the duration of the applied potential step.
| 1 |
| 2 |
The QPt factor is obtained by measuring the charges of the bielectronic oxidation process (Pt+H2O→PtO+2e−+2H+) that occurs at the surface of the platinum nanoparticles upon application of a positive potential in sulfuric acid (see the Supporting Information).31 In this way, we were able to normalize the efficiencies for the amount of electroactive platinum, having a precise quantification of the TON and TOF values in our experimental condition (0.1 m phosphate buffer solution, pH 6.8). The linear relationship between TOF and overpotential (η) (Figure 4 c) enables the extrapolation of the TOF0 value, the turnover frequency at zero overpotential, which was proposed by Savéant and co-workers as an optimal way to describe the intrinsic catalytic activity of different electrocatalysts.32 The TOF0 value of approximately 4600 h−1 obtained for NMP-G Pt confirms the efficiency of our system and the usefulness of this approach towards the realization of high-performance carbon-based materials, functionalized with small amounts of active catalyst (e.g., noble metals).
The lower turnover frequencies measured for the commercial Pt/C catalyst (TOF0 ∼1900 h−1, phosphate buffer solution 0.1 m, pH 6.8) are probably due to a different surface morphology for this material, which results in a relatively poorer accessibility to the catalytic sites as compared with the graphene–platinum nanoparticle composite. Support of this hypothesis could be found in a Tafel analysis, which should be able to point out some possible differences in the mechanism of the HER due to a different availability of catalytic sites. However, Tafel plots of the low overpotential region for NMP-G Pt and Pt/C give the same slope of 120 mV dec−1 (Figure 4 d), indicating the same reaction mechanism in both cases. This suggests that the surface morphology does not control the HER mechanism, but at the same time, the NMP-G Pt material is somehow able to maximize the catalysis, probably due to the coupling of electronic effects between the platinum nanoparticles and the graphene substrate.
In conclusion, we have prepared a graphene composite by means of an easy, low-cost and reproducible procedure that involves an NMP-based exfoliation process, enabling the formation of two-layer graphene flakes (NMP-G) that were selectively functionalized with platinum nanoparticles (NMP-G Pt). The electrochemical characterization of the material revealed that it is a promising electrocatalyst for the hydrogen evolution reaction (HER) in light of its high frequencies of turnover; these values were obtained thanks to the optimal dispersion of the platinum nanoparticles onto the graphene substrate that enabled us to load the material with very small amounts of noble metal.
Experimental Section
All chemicals were bought from Sigma–Aldrich: graphite powder <150 μm (CAS 7782–42–5), 1-methyl-2-pyrrolidinone ACS reagent >99.0 % (CAS 872–50–4), 1-pyrenecarboxylic acid 97 % (CAS 19694–02–1), potassium tetrachloroplatinate (II) 98 % (CAS 10025–99–7), sodium borohydride >96 % (CAS 16940–66–2), potassium phosphate dibasic ≥98 % (CAS 7758–11–4), sodium phosphate monobasic dehydrate ≥99 % (CAS 13472–35–0). Polytetrafluoroethylene (PTFE) membranes 0.2 μm × 13 mm were used in a homemade vacuum filtration system.
Photophysical measurements were performed on a PerkinElmer LS55 UV/vis double-beam spectrophotometer. HR-TEM and STEM micrographs were taken on a FEI Tecnai F20 transmission electron microscope equipped with a Schottky emitter operating at 120 kV. The nanoparticle size and number of graphene layers were determined manually based on the obtained HR-TEM images. The chemical composition was verified by means of energy dispersive spectrometry (EDS) by using an EDAX Phoenix spectrometer equipped with an ultra-thin window detector. Cyclic voltammetry and chronoamperometry experiments were carried out with a Biologic SP300 potentiostat using a custom-made electrochemical cell described elsewhere.30 Thin films were formed on a carbon screen-printed electrode (carbon-SPE; model DS110, DropSens S.L., Oviedo, Spain). An aqueous suspension of NMP-G Pt (100 μL) was deposited on the electrodes in small aliquots (10 μL) at 25 °C. All experiments were carried out in a PTFE cell with a 6 mm diameter aperture; an O-ring was placed on top of the drop-casted SPE and tightened using two connecting screws. The cell was also equipped with a platinum wire as a counter electrode and with an Ag/AgCl (3 m KCl) reference electrode.
Acknowledgments
The authors gratefully acknowledge Dr. Alain Pénicaud and Dr. Wang Yu from the Paul Pascal Research Center (CRPP), Bordeaux (France) for analysis of the Raman spectroscopy results and useful discussions. This work was supported through a European Research Council Starting Grant (ERC–StG) (PhotoSi 278912) and by the Italian Ministry of Education, University and Research (MIUR) (FIRB RBAP11C58Y, PRIN 2010N3T9M4, PRIN-2009Z9ASCA). F.P. and G.B. thank the Interuniversity Consortium for Science and Technology of Materials (INSTM)–Regione Lombardia.
Supporting Information
As a service to our authors and readers, this journal provides supporting information supplied by the authors. Such materials are peer reviewed and may be re-organized for online delivery, but are not copy-edited or typeset. Technical support issues arising from supporting information (other than missing files) should be addressed to the authors.
Supplementary
References
- 1.Su DS, Perathoner S, Centi G. Chem. Rev. 2013;113:5782–5816. doi: 10.1021/cr300367d. [DOI] [PubMed] [Google Scholar]
- 2.Serp P, editor; Figueiredo JL, editor. Carbon Materials for Catalysis. Hoboken: John Wiley & Sons; 2008. [Google Scholar]
- 3.Allen MJ, Tung VC, Kaner RB. Chem. Rev. 2010;110:132–145. doi: 10.1021/cr900070d. [DOI] [PubMed] [Google Scholar]
- 4.Gengler RYN, Spyrou K, Rudolf P. J. Phys. D: Appl. Phys. 2010;43:374015. [Google Scholar]
- 5.Toma FM, Sartorel A, Iurlo M, Carraro M, Parisse P, Maccato C, Rapino S, Rodriguez Gonzalez B, Amenitsch H, Da Ros T, Casalis L, Goldoni A, Marcaccio M, Scorrano G, Scoles G, Paolucci F, Prato M, Bonchio M. Nat. Chem. 2010;2:826–831. doi: 10.1038/nchem.761. [DOI] [PubMed] [Google Scholar]
- 6.Quintana M, Montellano Lopez A, Rapino S, Toma FM, Iurlo M, Carraro M, Sartorel A, Maccato C, Ke X, Bittencourt C, Da Ros T, Van Tendeloo G, Marcaccio M, Paolucci F, Prato M, Bonchio M. ACS Nano. 2013;7:811–817. doi: 10.1021/nn305313q. [DOI] [PubMed] [Google Scholar]
- 7.Yan Y, Xia B, Qi X, Wang H, Xu R, Wang J-Y, Zhang H, Wang X. Chem. Commun. 2013;49:4884–4886. doi: 10.1039/c3cc41031e. [DOI] [PubMed] [Google Scholar]
- 8a.Yang L, Wang G, Liu Y. Anal. Biochem. 2013;437:144–149. doi: 10.1016/j.ab.2013.03.004. [DOI] [PubMed] [Google Scholar]
- 8b.Seger B, Kamat PV. J. Phys. Chem. C. 2009;113:7990–7995. [Google Scholar]
- 9.Li Y, Gao W, Ci L, Wang C, Ajayan PM. Carbon. 2010;48:1124–1130. [Google Scholar]
- 10.Pénicaud A, Drummond C. Acc. Chem. Res. 2013;46:129–137. doi: 10.1021/ar300141s. [DOI] [PubMed] [Google Scholar]
- 11.Haar S, Ciesielski A, Clough J, Yang H, Mazzaro R, Richard F, Conti S, Merstorf N, Cecchini M, Morandi V, Casiraghi C, Samorì P. Small. 2015;11:1691–1702. doi: 10.1002/smll.201402745. [DOI] [PubMed] [Google Scholar]
- 12.Seo J, Green A, Antaris A, Hersam M. J. Phys. Chem. Lett. 2011;2:1004–1008. [Google Scholar]
- 13.Schlierf A, Yang H, Gebremedhn E, Treossi E, Ortolani L, Chen L, Minoia A, Morandi V, Samorì P, Casiraghi C, Beljonne D, Palermo V. Nanoscale. 2013;5:4205–4216. doi: 10.1039/c3nr00258f. [DOI] [PubMed] [Google Scholar]
- 14.Khomyakov PA, Giovannetti G, Rusu PC, Brocks G, van den Brink J, Kelly PJ. Phys. Rev. B. 2009;79:195425. [Google Scholar]
- 15.Sheng W, Myint M, Chen JG, Yan Y. Energy Environ. Sci. 2013;6:1509. [Google Scholar]
- 16.Muszynski R, Seger B, Kamat PV. J. Phys. Chem. C. 2008;112:5263–5266. [Google Scholar]
- 17.Hong W, Bai H, Xu Y, Yao Z, Gu Z, Shi G. J. Phys. Chem. C. 2010;114:1822–1826. [Google Scholar]
- 18.Xu C, Wang X, Zhu J. J. Phys. Chem. C. 2008;112:19841–19845. [Google Scholar]
- 19.Zhuo Q, Ma Y, Gao J, Zhang P, Xia Y, Tian Y, Sun X, Zhong Y, Sun X. Inorg. Chem. 2013;52:3141–3147. doi: 10.1021/ic302608g. [DOI] [PubMed] [Google Scholar]
- 20.Qin W, Li X. J. Phys. Chem. C. 2010;114:19009–19015. [Google Scholar]
- 21.Li Z, Chen Y, Du Y, Wang X, Yang P, Zheng J. Int. J. Hydrogen Energy. 2012;37:4880–4888. [Google Scholar]
- 22.An X, Simmons T, Shah R, Wolfe C, Lewis KM, Washington M, Nayak SK, Talapatra S, Kar S. Nano Lett. 2010;10:4295–4301. doi: 10.1021/nl903557p. [DOI] [PubMed] [Google Scholar]
- 23.Hernandez Y, Nicolosi V, Lotya M, Blighe FM, Sun Z, De S, McGovern IT, Holland B, Byrne M, Gun′Ko YK, Boland JJ, Niraj P, Duesberg G, Krishnamurthy S, Goodhue R, Hutchinson J, Scardaci V, Ferrari AC, Coleman JN. Nat. Nanotechnol. 2008;3:563–568. doi: 10.1038/nnano.2008.215. [DOI] [PubMed] [Google Scholar]
- 24.Khan U, ONeill A, Lotya M, De S, Coleman JN. Small. 2010;6:864–871. doi: 10.1002/smll.200902066. [DOI] [PubMed] [Google Scholar]
- 25.Yi M, Shen Z, Liang S, Liu L, Zhang X, Ma S. Chem. Commun. 2013;49:11059–11061. doi: 10.1039/c3cc46457a. [DOI] [PubMed] [Google Scholar]
- 26.Chen A, Holt-Hindle P. Chem. Rev. 2010;110:3767–3804. doi: 10.1021/cr9003902. [DOI] [PubMed] [Google Scholar]
- 27.Ravotto L, Mazzaro R, Natali M, Ortolani L, Morandi V, Ceroni P, Bergamini G. J. Phys. Chem. Lett. 2014;5:798–803. doi: 10.1021/jz500160w. [DOI] [PubMed] [Google Scholar]
- 28.Qian W, Hao R, Zhou J, Eastman M, Manhat BA, Sun Q, Goforth AM, Jiao J. Carbon. 2013;52:595–604. [Google Scholar]
- 29.Xia G, Huang C, Wang Y. Int. J. Hydrogen Energy. 2013;38:13754–13761. [Google Scholar]
- 30.Zamolo VA, Valenti G, Venturelli E, Chaloin O, Marcaccio M, Boscolo S, Castagnola V, Sosa S, Berti F, Fontanive G, Poli M, Tubaro A, Bianco A, Paolucci F, Prato M. ACS Nano. 2012;6:7989–7997. doi: 10.1021/nn302573c. [DOI] [PubMed] [Google Scholar]
- 31.Birss VI, Chan M, Phan T, Vanysek P, Zhang A. J. Chem. Soc. Faraday Trans. 1996;92:4041–4047. [Google Scholar]
- 32.Costentin C, Drouet S, Robert M, Savéant J-M. J. Am. Chem. Soc. 2012;134:11235–11242. doi: 10.1021/ja303560c. [DOI] [PubMed] [Google Scholar]
Associated Data
This section collects any data citations, data availability statements, or supplementary materials included in this article.
Supplementary Materials
Supplementary


