

Abstract
The prominent morphometric alterations of Alzheimer's disease (AD) occur both in grey matter and in white matter. Multimodal fusion can examine joint information by combining multiple neuroimaging datasets to identify the covariant morphometric alterations in AD in greater detail. In the current study, we conducted a multimodal canonical correlation analysis and joint independent component analysis to identify the covariance patterns of the grey and white matter by fusing structural magnetic resonance imaging and diffusion tensor imaging data of 39 AD patients (23 males and 16 females, mean age: 74.91±8.13 years) and 41 normal controls (NCs) (20 males and 21 females, mean age: 73.97±6.34 years) derived from the Alzheimer's Disease Neuroimaging Initiative database. The results revealed 25 joint independent components (ICs), of which three joint ICs exhibited strong links between the grey matter volume and the white matter fractional anisotropy and significant differences between the AD and NC group. The joint IC maps revealed that the simultaneous changes in the grey matter and FA values primarily involved the following areas: (1) the temporal lobe/hippocampus-cingulum, (2) the frontal/cingulate gyrus-corpus callosum, and (3) the temporal/occipital/parietal lobe-corpus callosum/corona radiata. Our findings suggest that grey matter atrophy is associated with reduced white matter fiber integrity in AD and possibly expand the understanding of the neuropathological mechanisms in AD.
Keywords: Alzheimer's disease, structural MRI and DTI, grey matter, fractional anisotropy, CCA and ICA
Graphical Abstract

Introduction
Alzheimer's disease (AD) is a common progressive neurodegenerative disease that is clinically characterized by cognitive impairments, such as declines in memory (Cummings et al., 1998, Dartigues, 2009). The prominent morphological alterations of AD occur both in grey matter and in white matter. Using structural magnetic resonance imaging (MRI), numerous studies have identified grey matter volume reductions that primarily occur in the medial temporal structures, the insular, the thalamus, cingulate areas, and the parietal and frontal areas (Baron et al., 2001, Frisoni et al., 2002, Zhang et al., 2009, Yang et al., 2012, Margarida Matos et al., 2013); for review, see (Frisoni et al., 2010, Yang et al., 2012). The decreases in white matter volume primarily occur in the corpus callosum, the cingulum, the parahippocampal, the uncinated fasciculus, the superior longitudinal fasciculus, the frontal lobe and the temporal lobe in AD patients compared to normal controls (NCs) (Salat et al., 2009, Yoon et al., 2011, Li et al., 2012a).
Multiple diffusion tensor imaging (DTI) indices, such as fractional anisotropy (FA), radial diffusivity, axial diffusivity and mean diffusivity, can detect abnormalities in the white matter fibers in AD (Oishi et al., 2011, Shu et al., 2011, Bosch et al., 2012, Li et al., 2012b, Kincses et al., 2013). Among these indices, FA, which represents the degree of anisotropy of water diffusion, is one of the most important parameters that are commonly used to characterize the microstructural characteristics of white matter fibers in AD (Medina et al., 2006, Zhang et al., 2009, Liu et al., 2011, Oishi et al., 2011). FA is sensitive to white matter integrity and most probably reflects changes in white matter integrity but could not always provide specifically such measure for all circumstances (Jones et al., 2013). Earlier DTI studies have applied univariate methods that focus on differences in the FA and found significant FA reductions that involved the majority of white matter tracts, including the body, genu and splenium of the corpus callosum, the cingulum, the superior longitudinal fasciculus and the corona radiata (Zhang et al., 2009, Oishi et al., 2011, Shu et al., 2011); for review, see (Chua et al., 2008, Oishi et al., 2011, Clerx et al., 2012, Amlien and Fjell, 2014).
Structural MRI can be used to examine changes in grey matter, and DTI can detect the diffusion characteristics that reflect the connectivity of white matter fibers. Most of the previously published studies only utilized one imaging modality and used univariate approaches such as region of interest, voxel-based morphometry (VBM) or tract-based spatial statistics (TBSS) to analyze structural MRI or DTI data. More recently, a number of studies employed different imaging modalities but analyzed each imaging dataset separately to investigate the fundamental pathology of AD (Wang et al., 2013, Balachandar et al., 2014, Racine et al., 2014). In contrast, multimodal fusion methods can extract simultaneous information by combining multiple neuroimaging datasets into one joint analysis to better identify the hidden covariant relationships among multiple morphological measurements in AD. To date, few studies have applied multimodal fusion approaches to explore the covariant morphological differences between AD and NCs (Guo et al., 2012, Kincses et al., 2013, Teipel et al., 2014). However, these published studies only focused on the different indices of one modality. The combination of structural MRI and DTI can effectively provide information about the covariance patterns of grey matter volume and white matter FA that are associated with AD.
The combination of multimodal canonical correlation analysis (mCCA) and joint independent component analysis (jICA) is a user-independent data-driven approach that was proposed by Sui et al. (Sui et al., 2011). MCCA and jICA feature the advantages of both mCCA and jICA as well as flexible model association and source separation (Sui et al., 2011). MCCA can be used to examine the inter-subject covariation across the two imaging modalities by providing a linear mixing model (Correa et al., 2008). JICA is an extension of ICA that fuses different neuroimaging datasets from the same subject and then decomposes the linear mixing signals into maximally joint independent components and examines the inter-subject covariances and the between-group differences (Calhoun et al., 2006). Different from the multi-modal techniques, multivariate but single-modal techniques such as scaled subprofile modeling (SSM) can only identify the uncorrelated sources based on single modal imaging data. MCCA and jICA have been validated and applied to identify the structural and functional abnormalities in the brain patterns of patients with schizophrenia (Sui et al., 2011, Sui et al., 2012b). The results showed that mCCA and jICA method is effective to find the function-structure correlation via the strong connection between joint components of the two modalities (Sui et al., 2011).
In the current study, we performed mCCA and jICA to identify the covariance patterns of the grey and white matter by fusing the structural MRI and DTI data of AD patients and NCs derived from the Alzheimer's Disease Neuroimaging Initiative (ADNI) database.
Materials and Methods
Data used in the preparation of this article were obtained from the Alzheimer's Disease Neuroimaging Initiative (ADNI) database (adni.loni.usc.edu). The ADNI was launched in 2003 by the National Institute on Aging (NIA), the National Institute of Biomedical Imaging and Bioengineering (NIBIB), the Food and Drug Administration (FDA), private pharmaceutical companies and non-profit organizations, as a $60 million, 5-year public-private partnership. The primary goal of ADNI has been to test whether serial magnetic resonance imaging (MRI), positron emission tomography (PET), other biological markers, and clinical and neuropsychological assessment can be combined to measure the progression of mild cognitive impairment (MCI) and early Alzheimer's disease (AD). Determination of sensitive and specific markers of very early AD progression is intended to aid researchers and clinicians to develop new treatments and monitor their effectiveness, as well as lessen the time and cost of clinical trials.
The Principal Investigator of this initiative is Michael W. Weiner, MD, VA Medical Center and University of California – San Francisco. ADNI is the result of efforts of many co-investigators from a broad range of academic institutions and private corporations, and subjects have been recruited from over 50 sites across the U.S. and Canada. The initial goal of ADNI was to recruit 800 subjects but ADNI has been followed by ADNI-GO and ADNI-2. To date these three protocols have recruited over 1500 adults, ages 55 to 90, to participate in the research, consisting of cognitively normal older individuals, people with early or late MCI, and people with early AD. The follow up duration of each group is specified in the protocols for ADNI-1, ADNI-2 and ADNI-GO. Subjects originally recruited for ADNI-1 and ADNI-GO had the option to be followed in ADNI-2. For up-to-date information, see www.adni-info.org.
Subjects
All participants were obtained from the ADNI database. According to the ADNI protocols, AD was diagnosed based on the National Institute of Neurological and Communicative Disorders and Stroke/Alzheimer's Disease and Related Disorders Association (NINCDS/ADRDA) criteria, and the severity of cognitive impairment was assessed based on the Mini-Mental State Examination (MMSE) (Folstein et al., 1975) and Clinical Dementia Rating (CDR) (Morris, 1993) scores. To minimize the effect of the scanner systems, we added the constraint that the Structural MRI and DTI data should be acquired on 3T GE Medical Systems scanners. This study included 39 AD patients (23 males and 16 females, mean age: 74.91±8.13 years, range: 60-90; mean MMSE: 22.87±2.32, range:18-27; CDR: 0.5 or 1) and 41 NCs (20 males and 21 females, mean age: 73.97±6.34 years, range: 60-90; mean MMSE: 29.07±0.96, range: 27-30; CDR: 0). The sexes and ages of the AD group and NC group were matched, and the sex ratio and age did not significantly differ ( = 0.836, p = 0.361 and t(78) = 0.575, p = 0.567 , respectively); however, the MMSE scores of the AD group were significantly lower (t(78) = −15.768, p = 5.693e-026). The sample descriptions are presented in Table 1.
Table 1.
The demographic information of the subjects
| Group | AD | NC |
|---|---|---|
| Number | 39 | 41 |
| Gender (F/M) | 23/16 | 20/21 |
| age | 74.91 ± 8.13 | 73.97 ± 6.34 |
| age range | (60-90) | (60-90) |
| MMSE | 22.87 ± 2.32 | 29.07 ± 0.96 |
| MMSE range | (18-27) | (27-30) |
| CDR | 0.5 or 1 | 0 |
*AD=Alzheimer's Disease, NC=Normal Control, MMSE= Mini-Mental State Examination, CDR=Clinical Dementia Rating
The ADNI study was approved by the Institutional Review Boards (IRBs) of each participating site and was conducted in accordance with Federal Regulations, the Internal Conference on Harmonization (ICH) and Good Clinical Practices (GCP). The study subjects provided written informed consent at the time of enrollment for imaging and completed questionnaires that were approved by each participating site's IRB.
Structural MRI data acquisition
All structural MRI scans were acquired with 3T GE Medical Systems scanners. The scanning parameters of T1-weighted 3D anatomical imaging data were defined as follows: pulse sequence=GR; matrix size = 256 × 256; voxel size = 1.0 × 1.0 mm2; flip angle = 11°; slice thickness= 1.2 mm; number of slices=196. The other parameters such as TE/TR differed across scanning sites. Additionally, the images had undergone pre-processing including non-uniformity correction and gradwarp correction to avoid the possible differences among different scans according to the ADNI protocol (http://www.loni.ucla.edu/ADNI/Data/ADNI_Data.shtml).
DTI data acquisition
For each subject, high-resolution DTI scans were acquired on 3T GE Medical Systems scanners. The scans were collected according to the standard ADNI MRI protocol. The following parameters were used: pulse sequence=EP/SE; matrix size = 256× 256; voxel size = 1.4 × 1.4 mm2; flip angle = 90°; slice thickness=2.7 mm; number of slices=59; gradient directions=41 (b=1000 s/mm2) and five acquisitions without diffusion weighting (b=0 s/mm2). The other parameters such as TE/TR differed across scanning sites.
Structural MRI data preprocessing
The structural MRI data were preprocessed using the VBM8 Toolbox (http://dbm.neuro.uni-jena.de/vbm8) in Statistical Parametric Mapping (SPM8, http://www.fil.ion.ucl.ac.uk/spm). This process primarily consisted of segmentation and normalization. First, each subject's MRI data were segmented into grey matter, white matter and cerebrospinal fluid (CSF) images using adaptive maximum a posteriori (MAP) (Rajapakse et al., 1997) and partial volume estimations (PVE) (Tohka et al., 2004). Subsequently, the diffeomorphic anatomical registration using exponential lie algebra (DARTEL) (Ashburner, 2007) was applied to normalize the grey matter images and iteratively create the template. A single-constant velocity field was used in the DARTEL to generate the diffeomorphic and invertible deformations. The subjects’ grey matter images were registered to new templates for each iteration. Next, the normalized grey matter images were multiplied by the Jacobian determinants from the nonlinear deformations to preserve the absolute volume of grey matter in the subjects’ native spaces. Finally, all grey matter images were smoothed with an 8-mm full-width at half-maximum (FWHM) Gaussian kernel and entered into the mCCA and jICA procedure.
DTI data preprocessing and tract-based spatial statistics
The DTI data were preprocessed in the FMRIB's Software Library (FSL) software (FSL 5.0, http://www.fmrib.ox.ac.uk/fsl). After correcting the eddy current and head motion with the affine registrations of each subject's diffusion-weighted images to the non-diffusion-weighted images in the FMRIB's Diffusion Toolbox (FDT) 2.0, the non-brain structures were removed using the Brain Extraction Tool, and the FA maps were generated based on the diffusion tensors reconstructed with the DTIfit program. Next, the TBSS (Smith et al., 2006, Smith et al., 2007) procedure was implemented on all subjects’ FA images to obtain the FA skeleton images. First, each subject's FA image was nonlinearly normalized to the MNI space. Second, the mean FA image was calculated and thinned to create the mean FA skeleton image (FA > 0.2), which represents the center of the white matter tract. Third, each subject's aligned FA image was projected onto the mean FA skeleton image by calculating the maximum FA values from the nearest tract center and filling the corresponding position in the skeleton. Finally, all subjects’ skeletonized FA images were calculated in the standard 1 × 1 × 1 mm3 MNI152 atlas space, smoothed with a 4-mm FWHM Gaussian kernel, and then entered into the mCCA and jICA procedure.
Multimodal CCA and joint ICA
The mCCA and jICA were performed for the multivariate analysis in the Fusion ICA toolbox (FIT v2.0c; http://icatb.sourceforge.net). Each subject's grey matter volume image and skeletonized FA image was separately converted to a one-dimensional row vector. The initial data matrix was formed by arraying 39 grey matter volume and FA vectors of AD and 41 grey matter and FA vectors of NCs into an 80 row subjects by voxels matrix. A minimum description length (MDL) criterion was used to estimate the number of independent components for each dataset and dimension reduction was performed using the singular value decomposition (SVD) of the initial data matrix (Li et al., 2007). Second, mCCA was performed on the dimensionally reduced matrix to obtain the canonical variants matrix (D1/D2) and the associated components matrix (C1/C2) for each modality. The jICA based on the Infomax algorithm was then applied to the associated components matrix ([C1,C2]) to obtain the maximized joint independence components ([S1,S2]) (the joint source matrix (sources by voxels)) and the mixing coefficient matrix of the jICA (W−1) (subjects by sources). The final mixing coefficient matrixes were calculated by obtaining the product of the canonical variants matrix and the mixing coefficient matrix of the jICA (D1 × W−1 for grey matter (GM), D2 × W−1 for FA), which represent the source differences between the AD and NC group for each modality, respectively. Figure 1 shows the of flowchart mCCA and jICA procedure.
Figure 1.
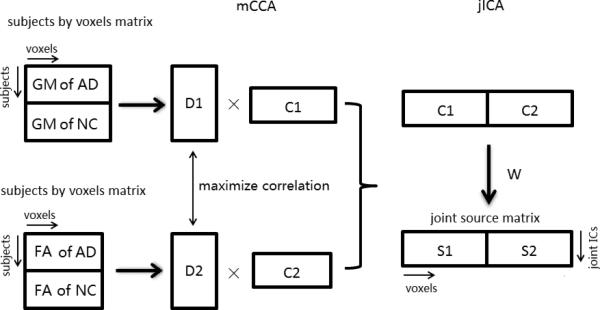
The flowchart of mCCA and jICA procedures.
Statistical analyses
We performed a two-sample t-test on the column of the mixing coefficient matrixes of the jICA to compare the differences between AD/NC groups (P<0.001, Bonferroni correction) (Bland and Altman, 1995). The significant joint sources (the row of the joint source matrix) were converted to units of standard deviations (Z-scores) and then reshaped to two 3D brain maps (grey matter regions and white matter regions). We set the threshold at Z ≥3 to reflect the statistically significant independent components of the grey matter covariant patterns and a threshold of Z ≥2 to reflect the statistically significant independent components of the white matter covariant patterns.
To statistically characterize the sensitivity and specificity (Wu et al., 2013), a multivariate receiver operating characteristic (multiV-ROC) was applied to the combination of the two indices (i.e., the mixing coefficient matrixes) for each joint independent component (joint IC): First, a logistic regression was applied on the ICA weights of grey matter and white matter in one component to calculate a column of predicted value. Then, the predicted values entered the ROC procedure. Additionally, Pearson's correlation coefficients were calculated between the subjects’ MMSE scores and each column of the predicted values of the joint ICs.
Results
Twenty-five joint ICs were extracted according to the MDL criterion, and a two-sample t-test with Bonferroni correction on each column of these mixing coefficients revealed significant differences between the AD patients and the NCs in the jICA weights for three interpretable ICs. These three significant joint ICs also exhibited strong correlations (r>0.6) between grey matter volumes and white matter FA values.
Figs. 2, 3 and 4 illustrate the spatial maps of the joint covariant reductions of the grey matter volumes (left) and the FA values (right) in the AD patients compared to the NCs for 3 joint ICs. The middle panels show the corresponding scatter-plots of the mixing coefficient differences between the AD patients and the NCs. The positively-weighted coefficients in the joint IC spatial maps illustrate decreases in the grey matter volumes and FA values in the AD patients compared to the NCs.
Figure 2.

Significance maps illustrating the spatial maps of the joint covariant reductions in grey matter volume (left) and FA value (right) in the AD patients compared to the NCs for joint IC 1. The color bar represents the Z-scores. The middle panels show the corresponding scatter-plots of the mixing coefficient differences between the AD patients and the NCs.
Figure 3.

Significance maps illustrating the spatial maps of the joint covariant reductions in grey matter volume (left) and FA value (right) in the AD patients compared to the NCs for joint IC 2. The color bar represents the Z-scores. The middle panels show the corresponding scatter-plots of the mixing coefficient differences between the AD patients and the NCs.
Figure 4.

Significance maps illustrating the spatial maps of the joint covariant reductions in grey matter volume (left) and FA value (right) in the AD patients compared to the NCs for joint IC 3. The color bar represents the Z-scores. The middle panels show the corresponding scatter-plots of the mixing coefficient differences between the AD patients and the NCs.
For joint IC 1, the grey matter atrophy occurred mainly in the superior/middle/inferior temporal gyrus, parahippocampal area and the hippocampus, and the FA value generally decreased in the cingulum (hippocampus, Fig. 2). For joint IC 2, the grey matter volume reductions occurred in the superior/middle/inferior frontal gyri, whereas the FA reductions occurred mainly of the genu and body of the corpus callosum, cingulum (cingulate gyrus), external capsule and superior longitudinal fasciculus (Fig. 3). Regarding joint IC 3, the decreases in the grey matter volumes primarily involved the middle occipital gyrus, middle temporal gyrus, and precuneus, and the FA reductions predominantly included the body/splenium of the corpus callosum (Fig. 4).
Table 2 shows the locations of the covariant decreases in the grey matter volume and white matter FA in the AD patients compared to the NCs for joint ICs 1 to 3. We used the AAL mask in the WFU_PickAtlas toolbox for grey matter regions and the ICBM DTI-81 Atlas in the FSL toolbox for white matter regions when we obtained the MNI coordinates and cluster size. Table 3 shows the correlation coefficients between the grey matter volumes and white matter FAs and the multiV-ROC results for the mixing coefficients of the two modalities for each joint IC. Pearson's correlation coefficients between the subjects’ MMSE scores and the predicted values of the joint ICs were −0.746 (p=2.01E-15), −0.632 (p=3.10E-10) and −0.651 (p=6.54E-11), respectively for joint IC 1, 2 and 3.
Table 2.
Locations of the covariant decreases in grey matter volume and FA value in the AD patients compared to the NCs for joint ICs 1-3.
| Brain regions | Peak coordinates MNI (X,Y,Z) | Z | Cluster size (mm3) | Overlap ratio (%) | ||
|---|---|---|---|---|---|---|
| Joint IC 1, Grey matter (volume) | ||||||
| L Middle temporal gyrus | −43.5 | 12 | −36 | 12.71 | 17,814 | 39.1% |
| R Middle temporal gyrus | 36 | 9 | −42 | 11.30 | 11,485 | 25.8% |
| L Inferior temporal gyrus | −43.5 | 10.5 | −37.5 | 12.87 | 11,158 | 12.8% |
| R Inferior temporal gyrus | 36 | 7.5 | −42 | 11.62 | 9,163 | 9.3% |
| L Superior temporal gyrus | −27 | 10.5 | −34.5 | 9.56 | 5,738 | 16.3% |
| R Superior temporal gyrus | 28.5 | 12 | −34.5 | 8.45 | 3,584 | 10.0% |
| L Parahippocampal gyrus | −27 | −3 | −36 | 8.07 | 2,629 | 10.1% |
| R Parahippocampal gyrus | 24 | 3 | −30 | 7.52 | 3,949 | 13.1% |
| L Hippocampus | −24 | −6 | −22.5 | 8.63 | 2,079 | 8.3% |
| R Hippocampus | 24 | −1.5 | −24 | 8.74 | 1,492 | 5.9% |
| L Amygdala | −24 | −4.5 | −24 | 8.48 | 1,306 | 23.2% |
| R Amygdala | 24 | −3 | −22.5 | 8.70 | 1,239 | 18.8% |
| Joint IC 1, white matter (FA) | ||||||
| Cingulum (hippocampus) | −26 | −22 | −25 | 4.25 | 396 | 16.6% |
| L External capsule | −25 | 17 | 8 | 2.68 | 169 | 3.0% |
| L Anterior limb of internal capsule | −22 | 17 | 11 | 2.76 | 159 | 5.3% |
| L Anterior corona radiata | −24 | 18 | 10 | 2.70 | 80 | 1.2% |
| Joint IC 2, grey matter (volume) | ||||||
| L Middle frontal gyrus | −25.5 | 49.5 | 7.5 | 7.26 | 10,291 | 14.7% |
| R Middle frontal gyrus | 28.5 | 51 | 6 | 5.98 | 11,927 | 24.5% |
| L Superior frontal gyrus | −24 | 51 | 4.5 | 6.68 | 5,417 | 15.0% |
| R Superior frontal gyrus | 7.5 | 48 | −24 | 6.22 | 6,574 | 3.0% |
| L Inferior frontal gyrus | −30 | 39 | −15 | 6.38 | 3,216 | 7.0% |
| L Anterior cingulate gyrus | −7.5 | 48 | 3 | 7.03 | 3,952 | 10.6% |
| R Anterior cingulate gyrus | 7.5 | 33 | 21 | 5.44 | 4,823 | 13.3% |
| L Rectus | 0 | 37.5 | −18 | 6.17 | 3,173 | 13.5% |
| R Rectus | 6 | 46.5 | −24 | 6.37 | 3,203 | 15.5% |
| Joint IC 2, white matter (FA) | ||||||
| Body of corpus callosum | −7 | 17 | 19 | 4.76 | 1,891 | 13.8% |
| Genu of corpus callosum | −7 | 20 | 19 | 4.56 | 529 | 6.0% |
| Cingulum (cingulated gyrus) | −9 | 18 | 25 | 3.20 | 226 | 4.4% |
| R External capsule | 32 | 8 | −9 | 2.84 | 123 | 2.2% |
| Superior longitudinal fasciculus | −34 | −43 | 31 | 2.79 | 58 | 0.4% |
| Joint IC 3, grey matter (volume) | ||||||
| L Middle occipital gyrus | −36 | −78 | 39 | 10.39 | 10,301 | 39.3% |
| R Middle occipital gyrus | 40.5 | −73.5 | 39 | 11.62 | 8,188 | 48.9% |
| L Middle temporal gyrus | −43.5 | −66 | 18 | 9.32 | 9,005 | 22.7% |
| R Middle temporal gyrus | 45 | −69 | 22.5 | 8.85 | 5,130 | 14.6% |
| L Angular | −40.5 | −75 | 37.5 | 9.92 | 7,641 | 80.7% |
| R Angular | 39 | −70.5 | 43.5 | 12.34 | 7,911 | 56.0% |
| L Precuneus | 1.5 | −55.5 | 33 | 6.62 | 5,437 | 19.2% |
| R Precuneus | 6 | −52.5 | 36 | 7.43 | 7,155 | 27.6% |
| L Inferior parietal gyrus | −34.5 | −78 | 40.5 | 10.15 | 3,942 | 20.2% |
| L Superior parietal gyrus | −36 | −70.5 | 49.5 | 7.51 | 2,241 | 13.6% |
| R Middle frontal gyrus | 42 | 10.5 | 46.5 | 6.22 | 2,217 | 5.4% |
| L Post cingulate gyrus | −6 | −49.5 | 33 | 6.29 | 1,472 | 39.4% |
| Joint IC 3, white matter (FA) | ||||||
| Body of corpus callosum | −6 | −20 | 26 | 4.10 | 1,403 | 10.2% |
| Superior corona radiata | 17 | 13 | 31 | 3.19 | 641 | 4.3% |
| Posterior thalamic radiation | 28 | −55 | 16 | 2.94 | 401 | 5.0% |
| Superior longitudinal fasciculus | −40 | −42 | 12 | 4.27 | 387 | 2.9% |
| Posterior corona radiata | −27 | −30 | 30 | 3.46 | 189 | 2.5% |
| R Anterior corona radiata | 17 | 16 | 29 | 3.00 | 104 | 1.5% |
| Splenium of corpus callosum | 27 | −55 | 16 | 2.94 | 94 | 0.7% |
*L: left; R: right; MNI: Montreal Neurological Institute; Overlap ratio: the number of voxels in ROI of Atlas divided by that of suprathreshold voxels in the corresponding brain regions of significance maps.
Table 3.
The correlation coefficients between the grey matter volumes and white matter FA values and the indices of the multivariate ROC analysis from the mixing coefficients of the two modalities for each joint IC.
| Joint IC | p-value |
correlation r(p) | Multivariate ROC |
|||
|---|---|---|---|---|---|---|
| GM | FA | Area | Sensitivity | Specificity | ||
| Joint IC 1 | 4.46e-12 | 1.55e-10 | 0.708(2.05e-13) | 0.928 | 89.7% | 90.2% |
| Joint IC 2 | 3.41e-06 | 4.05e-08 | 0.682(3.18e-12) | 0.841 | 87.2% | 75.6% |
| Joint IC 3 | 8.75e-06 | 2.78e-09 | 0.636(2.31e-10) | 0.862 | 74.4% | 90.2% |
Discussion
In the current study, we performed mCCA and jICA, an effective multimodal fusion approach, on structural MRI and DTI data from both AD patients and NCs to investigate the shared alterations in the grey and white matter associated with AD. The priori hypothesis about what regions (based on the existing literatures) are involved in AD was also considered in the proper selection of the relevant ICs. We found that three significant joint ICs revealed atrophy in the grey matter volumes and decreases in the white matter FA values in the AD patients compared to the NCs. Additionally, the multiV-ROC analysis revealed the high sensitivity and specificity of the discrimination.
For joint IC 1, the reduction in grey matter volume occurred mainly in the temporal lobe, particularly the hippocampus and parahippocampal gyrus, which generally agrees with previous reports (Frisoni et al., 2002, Guo et al., 2010, Guo et al., 2012). The majority of the FA decreases were located in the cingulum (hippocampus), which coincides with the findings of most DTI studies of AD (Liu et al., 2011, Guo et al., 2012). Killiany et al. found that AD patients with only mild symptoms show significant atrophy in the temporal lobe (Killiany et al., 1993) including brain areas that are essential to memory function (Dickerson et al., 2004). Stoub et al. also found that grey matter volume atrophy in the hippocampus and white matter volume atrophy in the parahippocampal gyrus lead to memory declines in people with mild cognitive impairment (MCI) (Stoub et al., 2006), which implies that grey matter volume atrophy in the hippocampus could be considered one of the most valuable biomarkers for the diagnosis of AD (Stoub et al., 2006, Guo et al., 2012). The white matter fibers in the cingulum connect the prefrontal lobes to the posterior cortices, including the hippocampal formation (Bürgel et al., 2006). Villain et al. also found that hippocampal atrophy is related to the cingulum bundle (Villain et al., 2008). These findings suggest that the reduced fiber integrity of the white matter in the cingulum (hippocampus) may also affect the grey matter reduction observed in joint IC 1, particularly in the hippocampus, and thus lead to memory impairment in AD.
Regarding joint IC 2, the majority of the reductions in the grey matter volume were found in the frontal lobe and the anterior cingulate gyrus, which agrees with the findings of previous studies (Frisoni et al., 2002, Hämäläinen et al., 2007, Guo et al., 2010, Guo et al., 2012); however, the reduction in FA primarily involved the genu and body of the corpus callosum (Zhang et al., 2009, Guo et al., 2012). The regions found in joint IC 2 primarily agree with a report by Guo et al.; who detected grey/white matter volume differences by performing joint ICA to construct covariant networks. They found grey matter volume reductions in the frontal lobe, cingulate gyrus, hippocampus and parahippocampal gyrus as well as white matter volume covariant decreases in the related superior longitudinal fasciculus, corpus callosum and corona radiata (Guo et al., 2012). The genu of the corpus callosum has been found to connect the left and right prefrontal cortical regions (van den Heuvel et al., 2009), and the grey matter reductions observed in the frontal lobes of AD patients primarily occur in the anterior frontal lobe (Whitwell et al., 2007). Moreover, the corpus callosum, which connects the hemispheres, has been reported to play a vital role in higher order cognitive functions (Schulte and Müller-Oehring, 2010, Li et al., 2012a), and the majority of the corpus callosum exhibited reduced integrity of white matter regions in the current study. The above reports suggest that the weakened integrity of the white matter fibers in the corpus callosum might be associated with the atrophy of the grey matter regions and thus might influence functional networks and affect the cognitive abilities of AD patients.
Regarding joint IC 3, the reductions in the grey matter volumes primarily involved the occipital/temporal/parietal/frontal lobes, the precuneus, the angular and posterior cingulate gyri; these results are similar to those reported in previous studies (Guo et al., 2010, Guo et al., 2012). The FA reductions predominantly involved the body/splenium of the corpus callosum and the corona radiate, which agrees with previously published studies of white matter in AD (Liu et al., 2011, Oishi et al., 2011, Li et al., 2012a, Kincses et al., 2013). Chaim et al. reported that the atrophy of the splenium of the corpus callosum can reflect neuronal loss in the parieto-temporal neocortical regions (Chaim et al., 2007), which indicates that abnormal white matter fibers in the corpus callosum might have influenced the grey matter in joint IC 3. More importantly, most of the grey matter regions that were involved in joint IC 3 are associated with the default mode network (DMN), and the white matter fibers in the corpus callosum and corona radiate are essential for connecting the regions of the DMN (Luo et al., 2012). Additionally, Rombouts et al. found that altered activity in the DMN represents a potential early biomarker of AD pathology (Rombouts et al., 2005), which suggests that the structural covariance patterns of joint IC 3 might be associated with the DMN in AD.
Joint IC 1 had the significant statistical power (p=4.46e-12 for the grey matter volumes and p=1.55e-10 for the white matter FA values) in the between-group comparisons. Moreover, the grey matter volume and FA value in joint IC 1 were the most relevant (r=0.708) among the three joint components. The grey matter volume and white matter FA value also exhibited greater relevance for joint IC 2 (r=0.682) and joint IC 3 (r=0.636). The multiV-ROC analysis revealed discriminabilities with 89.7% sensitivity and 90.2% specificity for joint IC 1, 87.2% sensitivity and 75.6% specificity for joint IC 2 and 74.4% sensitivity and 90.2% specificity for joint IC 3. Multivariate jICA is available to examine the correlation of the neuropsychological scores or other scores and the expression of joint ICs. The subjects’ MMSE scores and the predicted values of the joint ICs were significantly correlated for three joint ICs. Each joint IC might reflect a different aspect of the pathological abnormalities in AD, and these joint ICs might serve as potential biomarkers for the prediction of AD pathology.
We found that four significant ones out of the twenty-five joint ICs with Bonferroni multiple comparisons for two-sample t-test. We noted the existence of additional one significant joint IC with scattered spatial distributions primarily involving the periventricular regions. Like many multivariate techniques, the proper selection of IC components is always a problem in the ICA-related literatures (Xu et al., 2009, Caprihan et al., 2011). To examine the consistency and stability of three significant joint sources reported in our study, we evaluated the results in different number of ICs (the number of ICs is more or less than 25 including 21, 23, 27 and 29) and confirmed that these three joint sources are significant and consistently exist in varying IC numbers.
Other multivariate techniques investigating for the covariant patterns include Bayesian network (BN), structural equation modelling (SEM), SSM and partial least squares (PLS). The first three methods can only analyze single modal imaging data. BN and SEM are for effective connectivity in the fMRI literature. SSM is based on a modified principal component analysis (PCA). PLS has the feature of PCA and regression analysis and form a latent variable that maximizes the covariance among multi-modal imaging data (McIntosh et al., 2004). The sources identified by SSM or PLS are uncorrelated, but those identified by ICA are independent. Moreover, jICA, as an extension of ICA, can combine two neuroimaging datasets to find joint sources. Regarding the methodology we adopted herein, the combination of mCCA and jICA is an effective multimodal fusion method that allowed us to detect the source components that improved the identification of the covariant patterns of the brain. Sui et al. applied this method to fuse fMRI and DTI data in order to discriminate the different morphological abnormalities of the brain patterns of patients with schizophrenia and bipolar disorder (Sui et al., 2011). Additionally, jICA assumes that all modalities have the common mixing matrix. CCA can maximize the correlation in two datasets. Combining mCCA and jICA better estimates the source and mixing matrices to obtain higher and even weaker correlation within joint sources than does mCCA or jICA alone (Sui et al., 2012a). Sui et al. also reported that this method is flexible and can be applied to three or more imaging modalities by extending the multi-modal CCA to a multi-set CCA (Sui et al., 2012b).
In the current study, all data were from ADNI. ADNI has already performed some MRI image corrections to make quality assurance. We performed two-sample t-test to examine between-group differences in head motion parameters for DTI data. The results showed that most head motion measures did not significantly differ between the AD group and NC group with multiple comparison corrections (All Ps ≥ 0.024). The spatial preprocessing steps of structural MRI and DTI reduced the positional difference between individual image and the template, and the effect of head motion to a lesser extent in this study. The effect of head motion was investigated in several univariate studies (Yendiki et al., 2014, Reuter et al., 2015), and such potential effect should also be considered in the future multivariate study. In addition, we considered data from two modalities, only focusing on structural or morphological differences in AD. In fact, functional MRI can provide useful information for our understanding of the neuropathological mechanisms of AD. With the use of multi-set CCA (Sui et al., 2012b) in place of mCCA, it becomes possible to investigate simultaneous differences in grey matter volumes, white matter integrity and functional connectivity for more comprehensive grasp of multi-aspects of AD. Lastly, we are interested in applying the same technique to mild cognitive impairment (MCI), a preclinical prior to the onset of AD to investigate the predictability for the progression to AD with possible increased statistical power.
In summary, we performed mCCA and jICA to identify the covariances of grey matter and white matter that were associated with AD. The mCCA and jICA method for creating grey matter volume maps and FA value maps effectively detects the underlying grey matter atrophies that are associated with white matter connectivity in the corresponding brain areas. The results of this study predominantly correspond to those of earlier studies, which suggest that our findings are reliable. These findings could elucidate the neuropathological mechanisms of AD from a covariance patterns perspective.
Highlight.
mCCA and jICA identified covariance patterns of grey and white matter changes in AD.
3/25 joint independent components displayed covariant changes in AD.
Simultaneous changes significantly distinguished the AD/NC group membership.
Acknowledgments
This work was also supported by the National Natural Science Foundation (NNSF), China (81000603), the Funds for International Cooperation and Exchange of NNSF, China (61210001), Key Program of NNSF, China (91320201), the Fundamental Research Funds for the Central Universities, China, the National Institute of Mental Health, US (RO1 MH57899), the National Institute on Aging, US (9R01AG031581-10, P30 AG19610), and the State of Arizona.
Data collection and sharing for this project was funded by the Alzheimer's Disease Neuroimaging Initiative (ADNI) (National Institutes of Health Grant U01 AG024904) and DOD ADNI (Department of Defense award number W81XWH-12-2-0012). ADNI is funded by the National Institute on Aging, the National Institute of Biomedical Imaging and Bioengineering, and through generous contributions from the following: Alzheimer's Association; Alzheimer's Drug Discovery Foundation; Araclon Biotech; BioClinica, Inc.; Biogen Idec Inc.; Bristol-Myers Squibb Company; Eisai Inc.; Elan Pharmaceuticals, Inc.; Eli Lilly and Company; EuroImmun; F. Hoffmann-La Roche Ltd and its affiliated company Genentech, Inc.; Fujirebio; GE Healthcare; IXICO Ltd.; Janssen Alzheimer Immunotherapy Research & Development, LLC.; Johnson & Johnson Pharmaceutical Research & Development LLC.; Medpace, Inc.; Merck & Co., Inc.; Meso Scale Diagnostics, LLC.; NeuroRx Research; Neurotrack Technologies; Novartis Pharmaceuticals Corporation; Pfizer Inc.; Piramal Imaging; Servier; Synarc Inc.; and Takeda Pharmaceutical Company. The Canadian Institutes of Health Research is providing funds to support ADNI clinical sites in Canada. Private sector contributions are facilitated by the Foundation for the National Institutes of Health (www.fnih.org). The grantee organization is the Northern California Institute for Research and Education, and the study is coordinated by the Alzheimer's Disease Cooperative Study at the University of California, San Diego. ADNI data are disseminated by the Laboratory for Neuro Imaging at the University of Southern California.
Footnotes
Publisher's Disclaimer: This is a PDF file of an unedited manuscript that has been accepted for publication. As a service to our customers we are providing this early version of the manuscript. The manuscript will undergo copyediting, typesetting, and review of the resulting proof before it is published in its final citable form. Please note that during the production process errors may be discovered which could affect the content, and all legal disclaimers that apply to the journal pertain.
References
- Amlien I, Fjell A. Diffusion tensor imaging of white matter degeneration in Alzheimer's disease and mild cognitive impairment. Neuroscience. 2014 doi: 10.1016/j.neuroscience.2014.02.017. [DOI] [PubMed] [Google Scholar]
- Ashburner J. A fast diffeomorphic image registration algorithm. Neuroimage. 2007;38:95–113. doi: 10.1016/j.neuroimage.2007.07.007. [DOI] [PubMed] [Google Scholar]
- Bürgel U, Amunts K, Hoemke L, Mohlberg H, Gilsbach JM, Zilles K. White matter fiber tracts of the human brain: three-dimensional mapping at microscopic resolution, topography and intersubject variability. Neuroimage. 2006;29:1092–1105. doi: 10.1016/j.neuroimage.2005.08.040. [DOI] [PubMed] [Google Scholar]
- Balachandar R, John J, Saini J, Kumar K, Joshi H, Sadanand S, Aiyappan S, Sivakumar P, Loganathan S, Varghese M. A study of structural and functional connectivity in early Alzheimer's disease using rest fMRI and diffusion tensor imaging. International journal of geriatric psychiatry. 2014 doi: 10.1002/gps.4168. [DOI] [PubMed] [Google Scholar]
- Baron J, Chételat G, Desgranges B, Perchey G, Landeau B, de la Sayette V, Eustache F. In vivo mapping of gray matter loss with voxel-based morphometry in mild Alzheimer's disease. NeuroImage. 2001;14:298. doi: 10.1006/nimg.2001.0848. [DOI] [PubMed] [Google Scholar]
- Bland JM, Altman DG. Multiple significance tests: the Bonferroni method. Bmj. 1995;310:170. doi: 10.1136/bmj.310.6973.170. [DOI] [PMC free article] [PubMed] [Google Scholar]
- Bosch B, Arenaza-Urquijo EM, Rami L, Sala-Llonch R, Junqué C, Solé-Padullés C, Peña-Gómez C, Bargalló N, Molinuevo JL, Bartrés-Faz D. Multiple DTI index analysis in normal aging, amnestic MCI and AD. Relationship with neuropsychological performance. Neurobiology of aging. 2012;33:61–74. doi: 10.1016/j.neurobiolaging.2010.02.004. [DOI] [PubMed] [Google Scholar]
- Calhoun V, Adali T, Liu J. A feature-based approach to combine functional MRI, structural MRI and EEG brain imaging data.. Engineering in Medicine and Biology Society; 2006 EMBS'06 28th Annual International Conference of the IEEE; IEEE; 2006. pp. 3672–3675. [DOI] [PubMed] [Google Scholar]
- Caprihan A, Abbott C, Yamamoto J, Pearlson G, Perrone-Bizzozero N, Sui J, Calhoun VD. Source-based morphometry analysis of group differences in fractional anisotropy in schizophrenia. Brain connectivity. 2011;1:133–145. doi: 10.1089/brain.2011.0015. [DOI] [PMC free article] [PubMed] [Google Scholar]
- Chaim TM, Duran FL, Uchida RR, Périco CA, de Castro CC, Busatto GF. Volumetric reduction of the corpus callosum in Alzheimer's disease in vivo as assessed with voxel-based morphometry. Psychiatry Research: Neuroimaging. 2007;154:59–68. doi: 10.1016/j.pscychresns.2006.04.003. [DOI] [PubMed] [Google Scholar]
- Chua TC, Wen W, Slavin MJ, Sachdev PS. Diffusion tensor imaging in mild cognitive impairment and Alzheimer's disease: a review. Current opinion in neurology. 2008;21:83–92. doi: 10.1097/WCO.0b013e3282f4594b. [DOI] [PubMed] [Google Scholar]
- Clerx L, Visser PJ, Verhey F, Aalten P. New MRI markers for Alzheimer's disease: a meta-analysis of diffusion tensor imaging and a comparison with medial temporal lobe measurements. Journal of Alzheimer's Disease. 2012;29:405–429. doi: 10.3233/JAD-2011-110797. [DOI] [PubMed] [Google Scholar]
- Correa NM, Li Y-O, Adali T, Calhoun VD. Canonical correlation analysis for feature-based fusion of biomedical imaging modalities and its application to detection of associative networks in schizophrenia. Selected Topics in Signal Processing, IEEE Journal of. 2008;2:998–1007. doi: 10.1109/JSTSP.2008.2008265. [DOI] [PMC free article] [PubMed] [Google Scholar]
- Cummings JL, Vinters HV, Cole GM, Khachaturian ZS. Alzheimer's disease Etiologies, pathophysiology, cognitive reserve, and treatment opportunities. Neurology. 1998;51:S2–S17. doi: 10.1212/wnl.51.1_suppl_1.s2. [DOI] [PubMed] [Google Scholar]
- Dartigues JF. Alzheimer's disease: a global challenge for the 21st century. The Lancet Neurology. 2009;8:1082–1083. doi: 10.1016/S1474-4422(09)70298-4. [DOI] [PubMed] [Google Scholar]
- Dickerson BC, Salat DH, Bates JF, Atiya M, Killiany RJ, Greve DN, Dale AM, Stern CE, Blacker D, Albert MS. Medial temporal lobe function and structure in mild cognitive impairment. Annals of neurology. 2004;56:27–35. doi: 10.1002/ana.20163. [DOI] [PMC free article] [PubMed] [Google Scholar]
- Folstein MF, Folstein SE, McHugh PR. “Mini-mental state”: a practical method for grading the cognitive state of patients for the clinician. Journal of psychiatric research. 1975;12:189–198. doi: 10.1016/0022-3956(75)90026-6. [DOI] [PubMed] [Google Scholar]
- Frisoni G, Testa C, Zorzan A, Sabattoli F, Beltramello A, Soininen H, Laakso M. Detection of grey matter loss in mild Alzheimer's disease with voxel based morphometry. Journal of Neurology, Neurosurgery & Psychiatry. 2002;73:657–664. doi: 10.1136/jnnp.73.6.657. [DOI] [PMC free article] [PubMed] [Google Scholar]
- Frisoni GB, Fox NC, Jack CR, Scheltens P, Thompson PM. The clinical use of structural MRI in Alzheimer disease. Nature Reviews Neurology. 2010;6:67–77. doi: 10.1038/nrneurol.2009.215. [DOI] [PMC free article] [PubMed] [Google Scholar]
- Guo X, Han Y, Chen K, Wang Y, Yao L. Mapping joint grey and white matter reductions in Alzheimer's disease using joint independent component analysis. Neuroscience letters. 2012;531:136–141. doi: 10.1016/j.neulet.2012.10.038. [DOI] [PMC free article] [PubMed] [Google Scholar]
- Guo X, Wang Z, Li K, Li Z, Qi Z, Jin Z, Yao L, Chen K. Voxel-based assessment of gray and white matter volumes in Alzheimer's disease. Neuroscience letters. 2010;468:146–150. doi: 10.1016/j.neulet.2009.10.086. [DOI] [PMC free article] [PubMed] [Google Scholar]
- Hämäläinen A, Tervo S, Grau-Olivares M, Niskanen E, Pennanen C, Huuskonen J, Kivipelto M, Hänninen T, Tapiola M, Vanhanen M. Voxel-based morphometry to detect brain atrophy in progressive mild cognitive impairment. Neuroimage. 2007;37:1122–1131. doi: 10.1016/j.neuroimage.2007.06.016. [DOI] [PubMed] [Google Scholar]
- Jones DK, Knösche TR, Turner R. White matter integrity, fiber count, and other fallacies: the do's and don'ts of diffusion MRI. Neuroimage. 2013;73:239–254. doi: 10.1016/j.neuroimage.2012.06.081. [DOI] [PubMed] [Google Scholar]
- Killiany RJ, Moss MB, Albert MS, Sandor T, Tieman J, Jolesz F. Temporal lobe regions on magnetic resonance imaging identify patients with early Alzheimer's disease. Archives of Neurology. 1993;50:949–954. doi: 10.1001/archneur.1993.00540090052010. [DOI] [PubMed] [Google Scholar]
- Kincses ZT, Hořínek D, Szabó N, Tóth E, Csete G, Štěpán-Buksakowska I, Hort J, Vécsei L. The Pattern of Diffusion Parameter Changes in Alzheimer's Disease, Identified by Means of Linked Independent Component Analysis. Journal of Alzheimer's Disease. 2013;36:119–128. doi: 10.3233/JAD-122431. [DOI] [PubMed] [Google Scholar]
- Li J, Pan P, Huang R, Shang H. A meta-analysis of voxel-based morphometry studies of white matter volume alterations in Alzheimer's disease. Neuroscience & Biobehavioral Reviews. 2012a;36:757–763. doi: 10.1016/j.neubiorev.2011.12.001. [DOI] [PubMed] [Google Scholar]
- Li YO, Adalı T, Calhoun VD. Estimating the number of independent components for functional magnetic resonance imaging data. Human brain mapping. 2007;28:1251–1266. doi: 10.1002/hbm.20359. [DOI] [PMC free article] [PubMed] [Google Scholar]
- Li YO, Yang FG, Nguyen CT, Cooper SR, LaHue SC, Venugopal S, Mukherjee P. Independent component analysis of DTI reveals multivariate microstructural correlations of white matter in the human brain. Human brain mapping. 2012b;33:1431–1451. doi: 10.1002/hbm.21292. [DOI] [PMC free article] [PubMed] [Google Scholar]
- Liu Y, Spulber G, Lehtimäki KK, Könönen M, Hallikainen I, Gröhn H, Kivipelto M, Hallikainen M, Vanninen R, Soininen H. Diffusion tensor imaging and Tract-Based Spatial Statistics in Alzheimer's disease and mild cognitive impairment. Neurobiology of aging. 2011;32:1558–1571. doi: 10.1016/j.neurobiolaging.2009.10.006. [DOI] [PubMed] [Google Scholar]
- Luo L, Xu L, Jung R, Pearlson G, Adali T, Calhoun VD. Constrained source-based morphometry identifies structural networks associated with default mode network. Brain Connectivity. 2012;2:33–43. doi: 10.1089/brain.2011.0026. [DOI] [PMC free article] [PubMed] [Google Scholar]
- Margarida Matos A, Faria P, Patricio M. Voxel-based morphometry analyses in Alzheimer's disease.. Bioengineering (ENBENG); 2013 IEEE 3rd Portuguese Meeting in; IEEE; 2013. pp. 1–4. [Google Scholar]
- McIntosh AR, Lobaugh NJ. Partial least squares analysis of neuroimaging data, applications and advances. Neuroimage. 2004;23(Suppl 1):S250–S263. doi: 10.1016/j.neuroimage.2004.07.020. [DOI] [PubMed] [Google Scholar]
- Medina D, deToledo-Morrell L, Urresta F, Gabrieli JD, Moseley M, Fleischman D, Bennett DA, Leurgans S, Turner DA, Stebbins GT. White matter changes in mild cognitive impairment and AD: A diffusion tensor imaging study. Neurobiology of aging. 2006;27:663–672. doi: 10.1016/j.neurobiolaging.2005.03.026. [DOI] [PubMed] [Google Scholar]
- Morris JC. The Clinical Dementia Rating (CDR): current version and scoring rules. Neurology. 1993 doi: 10.1212/wnl.43.11.2412-a. [DOI] [PubMed] [Google Scholar]
- Oishi K, Mielke MM, Albert M, Lyketsos CG, Mori S. DTI analyses and clinical applications in Alzheimer's disease. Journal of Alzheimer's Disease. 2011;26:287–296. doi: 10.3233/JAD-2011-0007. [DOI] [PMC free article] [PubMed] [Google Scholar]
- Racine AM, Adluru N, Alexander AL, Christian BT, Okonkwo OC, Oh J, Cleary CA, Birdsill A, Hillmer AT, Murali D. Associations between white matter microstructure and amyloid burden in preclinical Alzheimer's disease: A multimodal imaging investigation. NeuroImage: Clinical. 2014;4:604–614. doi: 10.1016/j.nicl.2014.02.001. [DOI] [PMC free article] [PubMed] [Google Scholar]
- Rajapakse JC, Giedd JN, Rapoport JL. Statistical approach to segmentation of single-channel cerebral MR images. Medical Imaging, IEEE Transactions on. 1997;16:176–186. doi: 10.1109/42.563663. [DOI] [PubMed] [Google Scholar]
- Reuter M, Tisdall MD, Qureshi A, Buckner RL, van der Kouwe AJ, Fischl B. Head motion during MRI acquisition reduces gray matter volume and thickness estimates. NeuroImage. 2015;107:107–115. doi: 10.1016/j.neuroimage.2014.12.006. [DOI] [PMC free article] [PubMed] [Google Scholar]
- Rombouts SA, Barkhof F, Goekoop R, Stam CJ, Scheltens P. Altered resting state networks in mild cognitive impairment and mild Alzheimer's disease: an fMRI study. Human brain mapping. 2005;26:231–239. doi: 10.1002/hbm.20160. [DOI] [PMC free article] [PubMed] [Google Scholar]
- Salat DH, Greve DN, Pacheco JL, Quinn BT, Helmer KG, Buckner RL, Fischl B. Regional white matter volume differences in nondemented aging and Alzheimer's disease. Neuroimage. 2009;44:1247–1258. doi: 10.1016/j.neuroimage.2008.10.030. [DOI] [PMC free article] [PubMed] [Google Scholar]
- Schulte T, Müller-Oehring EM. Contribution of callosal connections to the interhemispheric integration of visuomotor and cognitive processes. Neuropsychology review. 2010;20:174–190. doi: 10.1007/s11065-010-9130-1. [DOI] [PMC free article] [PubMed] [Google Scholar]
- Shu N, Wang Z, Qi Z, Li K, He Y. Multiple diffusion indices reveals white matter degeneration in Alzheimer's disease and mild cognitive impairment: A tract-based spatial statistics study. Journal of Alzheimer's Disease. 2011;26:275–285. doi: 10.3233/JAD-2011-0024. [DOI] [PubMed] [Google Scholar]
- Smith SM, Jenkinson M, Johansen-Berg H, Rueckert D, Nichols TE, Mackay CE, Watkins KE, Ciccarelli O, Cader MZ, Matthews PM. Tract-based spatial statistics: voxelwise analysis of multi-subject diffusion data. Neuroimage. 2006;31:1487–1505. doi: 10.1016/j.neuroimage.2006.02.024. [DOI] [PubMed] [Google Scholar]
- Smith SM, Johansen-Berg H, Jenkinson M, Rueckert D, Nichols TE, Miller KL, Robson MD, Jones DK, Klein JC, Bartsch AJ. Acquisition and voxelwise analysis of multi-subject diffusion data with tract-based spatial statistics. Nature protocols. 2007;2:499–503. doi: 10.1038/nprot.2007.45. [DOI] [PubMed] [Google Scholar]
- Stoub TR, Stebbins GT, Leurgans S, Bennett DA, Shah RC. Hippocampal disconnection contributes to memory dysfunction in individuals at risk for Alzheimer's disease. Proceedings of the National Academy of Sciences. 2006;103:10041–10045. doi: 10.1073/pnas.0603414103. [DOI] [PMC free article] [PubMed] [Google Scholar]
- Sui J, Adali T, Yu Q, Chen J, Calhoun VD. A review of multivariate methods for multimodal fusion of brain imaging data. Journal of neuroscience methods. 2012a;204:68–81. doi: 10.1016/j.jneumeth.2011.10.031. [DOI] [PMC free article] [PubMed] [Google Scholar]
- Sui J, He H, Pearlson GD, Adali T, Kiehl KA, Yu Q, Clark VP, Castro E, White T, Mueller BA. Three-way (N-way) fusion of brain imaging data based on mCCA+ jICA and its application to discriminating schizophrenia. Neuroimage. 2012b;66:119–132. doi: 10.1016/j.neuroimage.2012.10.051. [DOI] [PMC free article] [PubMed] [Google Scholar]
- Sui J, Pearlson G, Caprihan A, Adali T, Kiehl KA, Liu J, Yamamoto J, Calhoun VD. Discriminating schizophrenia and bipolar disorder by fusing fMRI and DTI in a multimodal CCA+ joint ICA model. Neuroimage. 2011;57:839–855. doi: 10.1016/j.neuroimage.2011.05.055. [DOI] [PMC free article] [PubMed] [Google Scholar]
- Teipel SJ, Grothe MJ, Filippi M, Fellgiebel A, Dyrba M, Frisoni GB, Meindl T, Bokde AL, Hampel H, Klöppel S. Fractional Anisotropy Changes in Alzheimer's Disease Depend on the Underlying Fiber Tract Architecture: A Multiparametric DTI Study using Joint Independent Component Analysis. Journal of Alzheimer's Disease. 2014 doi: 10.3233/JAD-131829. [DOI] [PubMed] [Google Scholar]
- Tohka J, Zijdenbos A, Evans A. Fast and robust parameter estimation for statistical partial volume models in brain MRI. Neuroimage. 2004;23:84–97. doi: 10.1016/j.neuroimage.2004.05.007. [DOI] [PubMed] [Google Scholar]
- van den Heuvel MP, Mandl RC, Kahn RS, Pol H, Hilleke E. Functionally linked resting‐state networks reflect the underlying structural connectivity architecture of the human brain. Human brain mapping. 2009;30:3127–3141. doi: 10.1002/hbm.20737. [DOI] [PMC free article] [PubMed] [Google Scholar]
- Villain N, Desgranges B, Viader F, De La Sayette V, Mézenge F, Landeau B, Baron J-C, Eustache F, Chételat G. Relationships between hippocampal atrophy, white matter disruption, and gray matter hypometabolism in Alzheimer's disease. The Journal of neuroscience. 2008;28:6174–6181. doi: 10.1523/JNEUROSCI.1392-08.2008. [DOI] [PMC free article] [PubMed] [Google Scholar]
- Wang D, CN Hui S, Shi L, Huang W-h, Wang T, CT Mok V, CW Chu W, T Ahuja A. Application of Multimodal MR Imaging on Studying Alzheimer's Disease: A Survey. Current Alzheimer Research. 2013;10:877–892. doi: 10.2174/15672050113109990150. [DOI] [PubMed] [Google Scholar]
- Whitwell JL, Przybelski SA, Weigand SD, Knopman DS, Boeve BF, Petersen RC, Jack CR. 3D maps from multiple MRI illustrate changing atrophy patterns as subjects progress from mild cognitive impairment to Alzheimer's disease. Brain. 2007;130:1777–1786. doi: 10.1093/brain/awm112. [DOI] [PMC free article] [PubMed] [Google Scholar]
- Wu X, Li J, Ayutyanont N, Protas H, Jagust W, Fleisher A, Reiman E, Yao L, Chen K. The Receiver Operational Characteristic for Binary Classification with Multiple Indices and Its Application to the Neuroimaging Study of Alzheimer's Disease. IEEE/ACM Transactions on Computational Biology and Bioinformatics (TCBB) 2013;10:173–180. doi: 10.1109/TCBB.2012.141. [DOI] [PMC free article] [PubMed] [Google Scholar]
- Xu L, Pearlson G, Calhoun VD. Joint source based morphometry identifies linked gray and white matter group differences. Neuroimage. 2009;44:777–789. doi: 10.1016/j.neuroimage.2008.09.051. [DOI] [PMC free article] [PubMed] [Google Scholar]
- Yang J, Pan P, Song W, Huang R, Li J, Chen K, Gong Q, Zhong J, Shi H, Shang H. Voxelwise meta-analysis of gray matter anomalies in Alzheimer's disease and mild cognitive impairment using anatomic likelihood estimation. Journal of the neurological sciences. 2012;316:21–29. doi: 10.1016/j.jns.2012.02.010. [DOI] [PubMed] [Google Scholar]
- Yendiki A, Koldewyn K, Kakunoori S, Kanwisher N, Fischl B. Spurious group differences due to head motion in a diffusion MRI study. Neuroimage. 2014;88:79–90. doi: 10.1016/j.neuroimage.2013.11.027. [DOI] [PMC free article] [PubMed] [Google Scholar]
- Yoon B, Shim Y-S, Hong Y-J, Koo B-B, Kim Y-D, Lee K-O, Yang D-W. Comparison of diffusion tensor imaging and voxel-based morphometry to detect white matter damage in Alzheimer's disease. Journal of the neurological sciences. 2011;302:89–95. doi: 10.1016/j.jns.2010.11.012. [DOI] [PubMed] [Google Scholar]
- Zhang Y, Schuff N, Du A-T, Rosen HJ, Kramer JH, Gorno-Tempini ML, Miller BL, Weiner MW. White matter damage in frontotemporal dementia and Alzheimer's disease measured by diffusion MRI. Brain. 2009;132:2579–2592. doi: 10.1093/brain/awp071. [DOI] [PMC free article] [PubMed] [Google Scholar]