

Abstract
Imaging flow cytometry is a particularly powerful analytical approach for the study of megakaryopoiesis. It can utilize well-defined immunophenotypic markers as well as assess maturation of megakaryocytes by their increasing ploidy as they endoreplicate. Imaging flow cytometry can also assess morphometric cell characteristics of size and nuclear to cytoplasmic ratio, which are informative indications of maturation. However, megakaryopoiesis is challenging for flow cytometric analysis, particularly in vivo, because megakaryocytes are very rare in the bone marrow and their odd shape, high DNA content and cell size are similar to clumps of cells. Additionally, both megakaryocytes and immunophenotypically similar platelets are frequently found associated with other cells. Due to these challenges, imaging flow cytometry of megakaryopoiesis exemplifies several strengths of this approach in utilizing fluorescent signal's shape, texture and overlap with other fluorescent signals to distinguish megakaryocytes from a variety of contaminants and to restrict analysis to megakaryocytes, even when associated with other cells. Presented here is a strategy for imaging flow cytometric analysis of rare murine megakaryocytes directly from the bone marrow as well those grown in vitro and analyzed as live cells, or after fixation and permeabilization.
Keywords: Megakaryocyte, Platelet, Imaging flow cytometry, Bone marrow
1. Introduction
Platelets are small enucleate cells in our bloodstream with important roles in preserving vascular integrity as well as in mediation of innate and reactive immunity (Morrell et al., 2014 for review). Adult humans have over one trillion circulating platelets whose short lifespan requires synthesis of over two million platelets every second. Ironically, this smallest of blood cells is derived from the largest blood cell in the bone marrow, the megakaryocyte (Mk). Megakaryopoiesis begins with specified progenitors that can be functionally defined using colony-forming assays and prospectively identified by immunophenotype (Pronk et al., 2007; Weissman and Shizuru, 2008). Mk progenitors generate maturing Mks, which undergo incomplete cell divisions that result in cells with increased ploidy. During maturation, Mk cytoplasm grows dramatically and includes production of platelet-specific granules and excess membrane needed for platelet generation. Ultimately, it is this cytoplasm that is pinched off as pro-platelets during thrombopoiesis, leaving behind the “exhausted megakaryocyte” consisting of the nucleus surrounded by a thin layer of cytoplasm.
In many ways, the features of megakaryopoiesis make it well suited for analysis by flow cytometry. Mks are very rare in the bone marrow, only 0.1 to 0.5% of bone marrow cells in the mouse, and benefit from analysis of large numbers of cells (Corash et al., 1989). There are many flow cytometric markers associated with Mk lineage and maturation (Tomer, 2004). Furthermore, quantitation of ploidy is a powerful tool to gauge the maturational status of Mks. However, analysis of megakaryopoiesis also poses significant challenges for flow cytometry. The large size of maturing MKs, their frequent amorphous shape, and their high ploidy result in light scatter characteristics that are similar to cell clumps, preventing standard gating out of doublets and debris. The rarity of Mks also means that limited sources of contamination can significantly affect quantitation. Additionally, both platelets and Mks are frequently found physically associated with other cells (Niswander et al., 2014b). Platelets have the same immunophenotype as Mks, so when platelets are attached to other cells it creates false positives when gating DNA+Mk marker+ cells. These false positives can be removed with additional negative lineage markers to remove non-Mks, but this approach results in false negatives by eliminating Mks associated with other cells.
We have previously shown that imaging flow cytometry is particularly well suited to enumerate Mks in murine bone marrow (Niswander et al., 2014b). Imaging flow cytometry generated reproducible gating with in vivo Mk frequencies that correlate well with reported values determined using other approaches suchasmicroscopy (Corash et al., 1989; Niswander et al., 2014b). The analysis of Mks also provides an excellent example of the powerof imaging flow cytometry in identifying problematic populations by employing quantitation of fluorescent levels, shape, texture and density, as well as coincidence with other fluorescent signals. This paper presents an adaptation and extension of our previous quantitative strategy of live bone marrow samples that has been optimized for ploidy determination, as well as adapted for use with in vitro cultured Mk and fixed, permeabilized cells.
2. Analysis of megakaryopoiesis in live bone marrow samples
Murine bone marrow cells derived from the femur were prepared and stained as previously described, with three changes to the staining panel (Niswander et al. (2014b) and Fig. 1 legend). Originally, a more minimal DRAQ5 staining method was used, which allowed gating of nuclear areas but did not produce clear ploidy delineations. Trials with increased DRAQ5 concentrations, greater dilution of cells and increased time and/or temperature determined that diluting samples of 5 × 10⁶ cells into 1 ml of 10 μM DRAQ5 for 30 min at room temperature produced better discrimination of DNA levels. Vybrant Violet (Invitrogen) produced similar results and can be used in these assays, although signals were not as strong as DRAQ5 (data not shown). The label for kit (CD117) was changed from PE-Cy7 to PE-CF594 because it gave better discrimination with less compensation issues with DRAQ5. Additionally, kit labeling is more stable after fixation and methanol permeabilization. Finally, CD9 was not included in the revised strategy. In the previous strategy (Niswander et al., 2014b), cell clumps with non-overlapping CD9 and CD41 stained areas (both present on Mk) were removed, but it was found that these contaminants are already removed in earlier gating in the revised strategy presented here. Thus, three stains were sufficient to specifically gate cells of the Mk lineage. The first is CD41, which identifies the full range of megakaryocyte intermediates from progenitors to exhausted nuclei and platelets. The second is kit, which discriminates between CD41+ progenitors and maturing Mks. The third is DRAQ5, which stains DNA. This minimal panel leaves room for inclusion of additional stains to analyze maturational characteristics. GP1bβ was included in these analyses as an example of a maturational marker since it is known to increase during Mk maturation (Tomer, 2004).
Fig. 1.

Gating strategy for analysis of megakaryopoiesis of live bone marrow cells. Isolation and staining of murine femoral bone marrow cells were performed similarly as described by Niswander et al. (2014a). In brief, 5 × 10⁶ cells per sample were stained with PE-CF594-kit (CD117, clone 2B8, BDbiosciences), EF450-CD41 (eBioMWReg30, eBioscience), FITC-GP1bβ (clone Xia.C3, Emfret), and DRAQ5 (eBioscience), except that DRAQ5 staining utilized 10 μM concentration in 1 ml total volume for 30 min at room temperature. Cells were analyzed on an ISX imaging flow cytometer (Amnis, Merck) and data processed with IDEAS 6.1 software. A. Initial gating of CD41 positive cells. Cells are plotted based on CD41 intensity (Intensity_MC_CD41) versus median pixel CD41 (Median Pixel_MO7_CD41). Boundary of intensity can be set by FMO as well as visual examination of the dim progenitors cells. In this example (see insert of FMO + isotype for comparison) lower limit of median pixel is set at 40, which is approximately twice background. Images of a progenitor cell (#1) and excluded object with a platelet and defuse staining (#2). Numbered cell locations in this plot and through this figure are indicated by an x. B. Mks are gated based on having 2N or greater DNA intensity within a CD41 mask (Object (MO7, CD41, tight)). 2N levels are determined by plotting DNA intensity of single cells within the sample. On the y-axis a ratio of DNA intensity in a CD41 halo mask versus the CD41 mask is graphed. The halo mask is made by dilating the CD41 mask 2 pixels (1 μm) and then subtracting the CD41 mask from it, leaving the dilated rim (see diagram and the masks indicated by shading on the images to the right). The upper limit on the y-axis was set at 0.2. Examples of an excluded platelet attached to a cell (#3) with less than2N level of DNA as well as a cell clump (#4) and Mk overlapping other cells (#5, 6) are shown. Mks with other cells associated, but without significant overlap of nuclei are included (#7, 8). C. Continued gating of Mks is based on our previous work (Niswander et al., 2014b) by size and aspect ratio of the CD41 mask, distinguishing small kit+ progenitors from Mk, removing fragments of Mk with dim large DNA, selection ofround cells and reclaimed large asymmetric Mk based on circularity of an eroded default mask of CD41. Images of cells excluded (# 9, 10, 12, and 14) as well as included Mk (#11, 13). #1 on the plot refers to the progenitor in panel A. D. Gating of ExMk from the Mk population based on low cytoplasm (Area CD41 mask–Area DNA object mask) relative to cell size. Examples of ExMk are shown with ploidy indicated. E. Analysis of identified Mk. Images of Mk at specific ploidy are on the left including signal for the maturational marker GP1bβ. Gating of Mk by ploidy is shown on the histogram and the average ± SEM of three independent experiments is presented in the graph below. A graph of other Mk maturation characteristics (GP1bβ intensity and cell size) is shown in the upper right. Mks of different ploidy (not including ExMk) are plotted using the same colors for populations as in the graph below. (For interpretation of the references to color in this figure legend, the reader is referred to the web version of this article.)
Fig. 1 presents an overview analysis of live bone marrow cells. Initially, CD41+ cells are pooled from four files of 50,000 total bone marrow cells. The numbers of nucleated cells are also determined from these original files to be used in calculating Mk frequency. In addition to using intensity of CD41, a minimum median pixel value for CD41 was also employed in selecting cells (Fig. 1A). The lower limit of 40 median pixels represents approximately two times background levels and was found to discriminate true positive cell signals from the clumps of cells or debris with low levels of signal or autofluorescence (Fig. 1A, cell #1 and #2 respectively). The pooled CD41+ populations are plotted to select for cells with at least 2N level of DNA within the CD41-positive region or mask. Ultimately, it is the use of this Mk masked DNA intensity that allows accurate ploidy to be determined, even when Mks are associated with other cells. For this specification to work, it is important that the nuclei of other cells do not significantly overlap the CD41 mask. To address this issue, a mask that delineated the area just outside of the CD41 mask was created (Fig. 1B, CD41 halo mask). Because an overlap with other nuclei could significantly change perceived ploidy of a 2N cell, but have minimal numerical impact on the ploidy of a larger Mk, the ratio of DNA staining intensity in the halo mask versus inside the CD41 mask was determined. An upper limit of 0.2 for this ratio was determined to eliminate larger platelet containing debris and Mks with other cells overlapping the CD41 mask (Fig. 1B #4, 5 and 6).
The remainder of the gating strategy is similar to what was previously reported (Fig. 1C, Niswander et al., 2014b). Cells are gated by CD41 mask area and aspect ratio to exclude remaining single platelets and elongated clumps of cells (#9 and #10, respectively). Kit+ hematopoietic progenitors are removed with an added parameter of cell size on the y-axis to improve gating of single small progenitors. This progenitor population is helpful in setting the lower limits of some gates, as Mk progenitors are small, CD41-dim and have normal 2N and 4N ploidy. In experiments where the number of Mk progenitors needs to be quantitated, additional markers can be included to confirm the identity of these cells and to exclude possible CD41+ hematopoietic stem cell subsets (CD150+ and Sca1− for example, Gekas and Graf, 2013; Pronk et al., 2007). The other addition to the gating strategy was to distinguish small, dim 2N and 4N nuclei from larger diffuse DNA fragments in degraded Mks, sometimes found in these preparations, that can contaminate the final 2N gated population (third graph, Fig. 1C, compare #11 and #12 cells). Setting the bottom left corner of the gated region on this plot to include 2N cells is a good example of when it is helpful to use the hematopoietic progenitor population. Finally, Mks are gated based on shape. Round Mks are selected based on circularity and aspect ratio of the CD41 mask. Within the odd shaped cells, there are larger Mks that are sometimes asymmetric or have cytoplasmic extensions which are reclaimed utilizing the circularity of an eroded CD41 mask (Niswander et al., 2014b; Fig. 1C #13, 14). The Mk population includes the exhausted megakaryocytes (ExMks) representing the final stage of megakaryopoiesis. They can be distinguished by having a thin rim of cytoplasm relative to other cells of the same size (Fig. 1D). The DNA content of ExMks is of particular interest as it represents final ploidy of the Mk at the time of platelet generation.
An example of the results of this analysis is shown in Fig. 1E. The region of DNA intensity for each ploidy class was calculated by multiplying the 2N values of single cells or progenitors in that sample. As reported by others, the most common ploidy of cells above 4N was 16N and 32N (Arnold et al., 1997; Hill et al., 1991; Jackson et al., 1990). The ploidy distribution was similar in three independent experiments. Most ExMks were 16N and 32N, indicating that this is a common endpoint of endoreplication in vivo. Other changes associated with maturation, including increased cell size and GP1bβ expression, correlated well with Mk ploidy. The frequency of Mk in the bone marrow was also consistent between the three experiments with an average of 0.18% ± 0.01 SEM and agrees with the 0.1 to 0.5% previously published (Corash et al., 1989). However, this frequency is also about 30% lower than we obtained with our previously published imaging flow cytometry approach (Niswander et al., 2014b). Reanalysis of previous stained samples, as well as gating bone marrow samples using both procedures, confirmed this difference and showed that it is predominately due to the exclusion of MK that have overlapping nuclei from other cells (example #5 and 6 in Fig. 1B). Thus, both imaging flow cytometric protocols produce similar results, but with different strengths. Our previous procedure (Niswander et al., 2014b) more fully captures the total Mk population in the bone marrow, but the procedure outlined in Fig. 1, more accurately determines the ploidy of the gated Mk. One hybrid approach would be to independently gate cells above the “DNA in Mk” region through the remaining plots, and include those in Mk frequency, although not for ploidy analysis.
3. Analysis of in vitro cultures of megakaryocytes
In order to better understand the regulation of megakaryopoiesis, it will be necessary to combine studies of the in vivo maturation in native microenvironments with in vitro assays that allow for controlled experimental manipulation. In addition, due to the rarity of Mk in vivo, the maturation of Mk in vitro serves as an important approach to generate larger numbers of cells. However, few studies have compared the Mks generated by in vitro cultures with those in vivo using the same analytical procedures. We compared Mks derived from bone marrow kit+ cells after three days of in vitro culture, when the cultures contained Mks of a variety of sizes. The same imaging flow cytometry-based analysis was performed on these samples as was employed for samples derived directly from the bone marrow. Overall, the in vitro samples revealed a similar gating pattern as seen in the strategy described in Fig. 1, although differences in the proportions of gated populations were observed. Unlike the bone marrow, the in vitro cultures are highly enriched for Mks and generate many fewer platelets, so platelets or Mks in association with other cells were less significant. Thus, few cells were eliminated as having too high a ratio of DNA intensity in the CD41 halo versus internal mask. Additionally, more fragments of cells were present that predominately fell outside the intact nuclei gate. However, some of these fragments remained in the final Mk population along with clumps of Mks that were a new contaminant not observed in in vivo samples (Fig. 2A, cells #1–4). By eye, it was evident that these clumps and fragments had different contrast and shape characteristics than true Mks, but there are many features available in the IDEAS analysis software that quantitate these properties and it wasn't clear, a priori, which would be best. Therefore, the “Feature Finder Wizard” subprogram in the IDEAS analysis software was utilized to test all available shape or texture features of brightfield or CD41 images to determine which features gave the highest significant separation of hand-selected populations of cells versus clumps and fragments. Modulation brightfield and shape ratio of CD41 feature both, within the default M07 mask for the CD41, were highly ranked. This mask identifies a broader area than the tighter object mask, and likely was optimal because it also included dim associated cells. Plotting these two features in combination was used to a refine the final Mk population (Fig. 2A). The resultant population of in vitro Mks had a similar appearance to in vivo Mks, with a range of ploidy consistent with the variety of Mk sizes observed by microscopy at this time point in culture (Fig. 2B). Interestingly, the range of ploidy and size of the Mk were broader than that found in vivo, with a population of over 64N Mk not observed in the bone marrow (Fig. 2C). Similar to primary bone marrow Mk, the other maturational characteristics of size and GP1bβ intensity increased with ploidy, although with broader variability within ploidy populations.
Fig. 2.
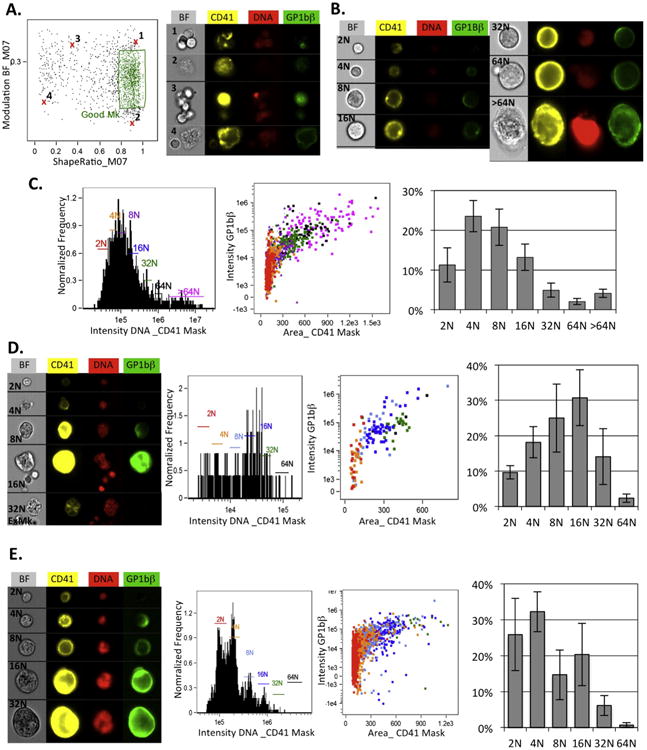
Imaging flow cytometric analysis of cultured and fix/permed megakaryocytes. Cultured Mks were derived from kit+ bone marrow cells grown for three days in IMEM, 10% serum, BIT (StemCell Technologies) with 100 ng/ml SCF for the first day only and 50 ng/ml thrombopoietin throughout. For fix/perm experiments, stained washed cells were fixed in 1% formaldehyde for 10 min on ice, washed and then permeabilized for 10 min on ice with 70% methanol. For live cells, the stain was the same as for Fig. 1. For fix/permed cells, kit and GP1bβ were stained as before but CD41 was visualized with PE-CD41 (Ebioscience clone eBioMWReg30) DNA detected by addition of concentration 1 μg/ml DAPI (Molecular Probes). Panels A, B and C are results of analysis of live cultured cells. Panel D is analysis of fix/permed bone marrow cells. Panel E is analysis of fix/permed cultured cells. A. Additional gating of Mks utilized in analysis of cultured cells. Images of removed contamination on right correlate to the Xs in the graph to the left. B. Images of cultured megakaryocytes with ploidy indicated. C. Ploidy and maturational characteristics of Mks from one experiment. Ploidy of cells on the dot plot is indicated by the same colors as gates in the histogram. This color scheme is also used in D and E. On the right is the average ploidy distribution of Mks from three experiments with error bars indicating SEM. D. Fix/permed bone marrow cells were gated as in Fig. 1. Left are examples of Mk in the final gating. Cells with higher than 16N were mainly ExMk as shown in the example of 32N. Middle graphs show an example of the ploidy histogram and maturation characteristics from one experiment. The average ± SEM distribution of Mk ploidy of three experiments is plotted on the right. E. Similar to D, analysis of Mks from cultured cells after fix/perming is shown. For this analysis the additional gating shown in A, with live cultured cells, was also performed on these experiments. (For interpretation of the references to color in this figure legend, the reader is referred to the web version of this article.)
4. Modification of imaging flow cytometry analysis for megakaryocytes following fixation and permeabilization
Powerful flow cytometric tools for studying intracellular processes such as cell cycle and signaling exist and would be helpful to explore regulation of megakaryopoiesis. In order to study cellular processes utilizing intracellular flow, cells must first undergo fixation and permeabilization (fix/perm). There are a variety of fix/perm procedures, each with different advantages for specific assays and epitopes. Each procedure also can cause cell losses and different cell types may have varied rates of loss. Initial trials comparing 1% and 2% formaldehyde fixation and triton or methanol permeabilization all succeeded in the identification of stained Mks by imaging flow cytometry, but 1% formaldehyde and 70% methanol had the lowest cell losses and thus was further examined. The staining panel was altered to use DAPI for DNA and PE as the fluor conjugated to CD41 (See Fig. 2 legend). The original staining with DRAQ5 and EF450-CD41 also worked in these assays, but DAPI gave very clear nuclear areas on fixed cells and PE-CD41 was somewhat brighter in the fixed samples. The same gating strategy as in Fig. 1 could be used for bone marrow samples and similar Mk per total nucleated cell frequencies were obtained, although since the total cell numbers were less that means Mks were lost as well. While Mk with similar appearance to in vivo cells was observed, there were also more odd shaped and fragmented cells and a preferential loss of higher ploidy Mks (compare Figs. 2D and 1E). The few remaining Mks over 16N were usually ExMk, which appear to better tolerate these fix/perm conditions. In vitro cultured Mks were more resistant to fix/perm with less cell loss and more visibly intact cells (Fig. 2E). The larger numbers of in vitro Mks produced significant numbers of all ploidy classes up to 32N, however, as observed with in vivo Mks there was a preferential loss of the highest ploidy cells (compare Fig. 2E and C).
These results suggest that the use of fix/permed cells for quantification of Mk frequency or ploidy distribution is not ideal. Even though similar frequencies of Mks seen were seen in live and fix/permed normal bone marrow samples, experimental conditions may alter the proportions of differentially sensitive cells could change the denominator of these values. To circumvent these issues, parallel live samples could be analyzed to quantitate Mk populations, while fix/permed cells can used to analyze intracellular functions of identified ploidy subclasses of Mks. The results presented here are certainly dependent on the fix/perm technique employed, and additional optimization of these conditions may help with some of these issues in the future. Having parallel analysis protocols for live and treated cells should be useful for optimization as well as important for identifying remaining caveats.
5. Discussion
The study of megakaryopoiesis poses many challenges to flow cytometric analysis. Available cell surface markers as well as Mk ploidy are powerful tools to delineate progressive stages of their maturation. Yet the rarity of this lineage in the bone marrow and its overlapping characteristics with multiple sources of contamination makes it difficult to identify pure Mk populations, particularly in vivo, using standard flow cytometry. Imaging flow cytometry allows us to meet these challenges because it combines flow cytometric markers with morphometric parameters. In this analysis, Mks are identified based on classic immunophenotyping as CD41+DNA+kit−. However, the refinement of these measurements to not just total intensity, but appropriate density of signal over the cell and coincidence of intensities, such as DNA or kit overlapping with CD41, allow much more accurate and precise cell identification. Size and shape of fluorescence were also used at multiple steps. This analytical approach was greatly strengthened by localizing quantitation to masked regions using Boolean logic. Comparing DNA signal at the edge of the cell to the inside of the cell identified overlap with nuclei of other cells. The area of the cytoplasmic rim of the cell helped identify ExMks. This highlights a fundamental principle of imaging flow cytometry: the investigator's knowledge of what to look for and where to look allows the great potential of imaging flow cytometry to be realized. Additionally, there are instances where there is an observed change in shape or texture of a signal, but not clear a priori choice for which of the many shape and texture features would be best to distinguish these changes. Combining hand selected populations based on visual examination with the analytical software's ability to simultaneously test a large numbers of features can rapidly establish the optimal diagnostic feature for that observed trait. The discrimination of clumps of Mk cells or low contrast fragments of Mk found in the in vitro analyses serve as good examples of this analytical approach. On the whole, imaging flow cytometric analysis of megakaryopoiesis is complicated, but exemplifies how quantitation can be achieved by the sequential process of finding the best features to plot the observed differences between signal versus noise.
The origins of flow cytometry are connected to the study of immune cells that express discrete combinations of cells surface markers as they mature. However, it is far more common in biology to find populations of cells that vary characteristics along a continuum. This creates concerns of how the boundaries of gated populations should be determined. In some cases controls, like FMO, can be used to set the limit of positivity. Absolute characteristics, such as the size of a cell versus a platelet size are also straight forward to determine. The question arises though, within a range of positivity in signal, size or shape, where should the gate be drawn? This is why it is critical to have a morphometrically relevant biologic control for studies of imaging flow cytometry (Filby and Davies, 2012). In this analysis, wherever possible, known biological limits are used, for example setting 2N on single cells or using Mk progenitors known to be small and CD41 dim to represent the edge population for gates of these features. However, even for absolute values, such at the ratio of 0.2 for DNA intensity in the halo versus internal CD41 masks, it was observations of cellular overlap that helped determine what value to choose. We have found in our studies of both megakaryopoiesis and erythropoiesis using imaging flow cytometry, that once a template is established, it can be applied with very little refinement to our control tissue, in this case bone marrow, in each experiment. Then by applying this template to the experimental samples, robust quantitation can be achieved, as we have shown for changes in erythropoiesis and megakaryopoiesis after radiation and drug treatments, or during embryonic development (Malik et al., 2013; McGrath et al., 2008a,b; Niswander et al., 2014a,b; Peslak et al., 2011, 2012).
Ultimately, understanding megakaryopoiesis will require combining multiple forms of analysis. In vitro studies will provide the quantities of Mks necessary for biochemical assays as well as controlled testing of perturbations to growth conditions. Analysis of Mk in vivo can confirm insights obtained from in vitro cultures, as well as study megakaryopoiesis in the context of normal and damaged microenvironments. Exploration of Mks by intracellular flow cytometry or immunohisto-chemical detection of subcellular components will allow studies of signaling systems and changes in the cytoplasm and nucleus, such as granule accumulation and chromatin changes. Imaging flow cytometry will be animportant addition to the tools already beingemployedtostudy megakaryopoiesis, becauseit can beapplied in multiple experimental systems and generates highly quantitative data, which can facilitate integrating the information from these different approaches.
Acknowledgments
The author gratefully acknowledges Seana Catherman for her technical expertise as well as the Flow Cytometry Core Facility at the University of Rochester Medical Center for technical support. Funding for these studies was provided by R01 DK098251 (J. Palis), U01 AI107276 (J. Palis), and the Michael Napoleone Memorial Foundation.
References
- Arnold JT, Daw NC, Stenberg PE, Jayawardene D, Srivastava DK, Jackson CW. A single injection of pegylated murine megakaryocyte growth and development factor (MGDF) into mice is sufficient to produce a profound stimulation of megakaryocyte frequency, size, and ploidization. Blood. 1997;89:823. [PubMed] [Google Scholar]
- Corash L, Levin J, Mok Y, Baker G, McDowell J. Measurement of megakaryocyte frequency and ploidy distribution in unfractionated murine bone marrow. Exp Hematol. 1989;17:278. [PubMed] [Google Scholar]
- Filby A, Davies D. Reporting imaging flow cytometry data for publication: why mask the detail? Cytometry A. 2012;81:637. doi: 10.1002/cyto.a.22091. [DOI] [PubMed] [Google Scholar]
- Gekas C, Graf T. CD41 expression marks myeloid-biased adult hematopoietic stem cells and increases with age. Blood. 2013;121:4463. doi: 10.1182/blood-2012-09-457929. [DOI] [PubMed] [Google Scholar]
- Hill RJ, Warren MK, Stenberg P, Levin J, Corash L, Drummond R, Baker G, Levin F, Mok Y. Stimulation of megakaryocytopoiesis in mice by human recombinant interleukin-6. Blood. 1991;77:42. [PubMed] [Google Scholar]
- Jackson CW, Steward SA, Chenaille PJ, Ashmun RA, McDonald TP. An analysis of megakaryocytopoiesis in the C3H mouse: an animal mode whose megakaryocytes have 32N as the modal DNA class. Blood. 1990;76:690. [PubMed] [Google Scholar]
- Malik J, Kim AR, Tyre KA, Cherukuri AR, Palis J. Erythropoietin critically regulates the terminal maturation of murine and human primitive erythroblasts. Haematologica. 2013;98:1778. doi: 10.3324/haematol.2013.087361. [DOI] [PMC free article] [PubMed] [Google Scholar]
- McGrath KE, Bushnell TP, Palis J. Multispectral imaging of hematopoietic cells: where flow meets morphology. J Immunol Methods. 2008a;336:91. doi: 10.1016/j.jim.2008.04.012. [DOI] [PMC free article] [PubMed] [Google Scholar]
- McGrath KE, Kingsley PD, Koniski AD, Porter RL, Bushnell TP, Palis J. Enucleation of primitive erythroid cells generates a transient population of “pyrenocytes” in the mammalian fetus. Blood. 2008b;111:2409. doi: 10.1182/blood-2007-08-107581. [DOI] [PMC free article] [PubMed] [Google Scholar]
- Morrell CN, Aggrey AA, Chapman LM, Modjeski KL. Emerging roles for platelets as immune and inflammatory cells. Blood. 2014;123:2759. doi: 10.1182/blood-2013-11-462432. [DOI] [PMC free article] [PubMed] [Google Scholar]
- Niswander LM, Fegan KH, Kingsley PD, McGrath KE, Palis J. SDF-1 dynamically mediates megakaryocyte niche occupancy and thrombopoiesis at steady state and following radiation injury. Blood. 2014a;124:277. doi: 10.1182/blood-2014-01-547638. [DOI] [PMC free article] [PubMed] [Google Scholar]
- Niswander LM, McGrath KE, Kennedy JC, Palis J. Improved quantitative analysis of primary bone marrow megakaryocytes utilizing imaging flow cytometry. Cytometry A. 2014b;85:302. doi: 10.1002/cyto.a.22438. [DOI] [PMC free article] [PubMed] [Google Scholar]
- Peslak SA, Wenger J, Bemis JC, Kingsley PD, Frame JM, Koniski AD, Chen Y, Williams JP, McGrath KE, Dertinger SD, et al. Sublethal radiation injury uncovers a functional transition during erythroid maturation. Exp Hematol. 2011;39:434. doi: 10.1016/j.exphem.2011.01.010. [DOI] [PMC free article] [PubMed] [Google Scholar]
- Peslak SA, Wenger J, Bemis JC, Kingsley PD, Koniski AD, McGrath KE, Palis J. EPO-mediated expansion of late-stage erythroid progenitors in the bone marrow initiates recovery from sublethal radiation stress. Blood. 2012;120:2501. doi: 10.1182/blood-2011-11-394304. [DOI] [PMC free article] [PubMed] [Google Scholar]
- Pronk CJ, Rossi DJ, Mansson R, Attema JL, Norddahl GL, Chan CK, Sigvardsson M, Weissman IL, Bryder D. Elucidation of the phenotypic, functional, and molecular topography of a myeloerythroid progenitor cell hierarchy. Cell Stem Cell. 2007;1:428. doi: 10.1016/j.stem.2007.07.005. [DOI] [PubMed] [Google Scholar]
- Tomer A. Human marrow megakaryocyte differentiation: multiparameter correlative analysis identifies von Willebrand factor as a sensitive and distinctive marker for early (2N and 4N) megakaryocytes. Blood. 2004;104:2722. doi: 10.1182/blood-2004-02-0769. [DOI] [PubMed] [Google Scholar]
- Weissman IL, Shizuru JA. The origins of the identification and isolation of hematopoietic stem cells, and their capability to induce donor-specific transplantation tolerance and treat autoimmune diseases. Blood. 2008;112:3543. doi: 10.1182/blood-2008-08-078220. [DOI] [PMC free article] [PubMed] [Google Scholar]