Abstract
Objective
In mammalian cells the rate-limiting step in heme biosynthesis is the formation of δ-aminolevulinic acid (ALA). The reaction intermediates, porphyrins and iron and the final product, heme can be highly cytotoxic if allowed to accumulate. The importance of maintaining the levels of metabolic intermediates and heme within a narrow range is apparent based on the complex homeostatic system(s) that have developed. Ultimately, determining the enzymatic activity of ALA synthase (ALAS) present in the mitochondria is highly beneficial to confirm the effects of the transcriptional, translational and post-translational events. The aim of this study was to develop a highly sensitive assay for ALAS that could be used on whole tissue or cellular homogenates.
Design and methods
A systematic approach was used to optimize steps in formation of ALA by ALAS. Reducing the signal to noise ratio for the assay was achieved by derivatizing the ALA formed into a fluorescent product that could be efficiently separated by ultra performance liquid chromatography (UPLC) from other derivatized primary amines. The stability of whole tissue homogenate and cellular homogenate was determined after extended storage at −80°C.
Conclusions
A method for assaying ALAS has been developed that can be used with tissue homogenates or cellular lysates. There is no need to purify mitochondria and radiolabeled substrates are not needed for this assay. General laboratory reagents can be used to prepare the samples. Standard UPLC chromatography will resolve the derivatized ALA peak. Samples of tissue homogenate can be stored for approximately one year without significant loss of enzymatic activity.
Graphical Abstract
BACKGROUND
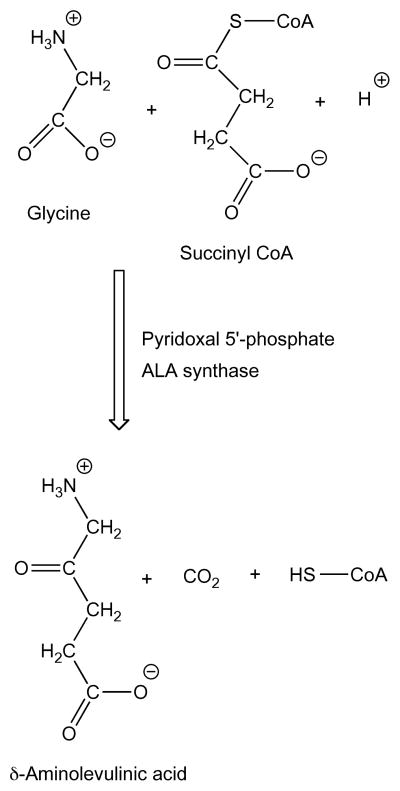
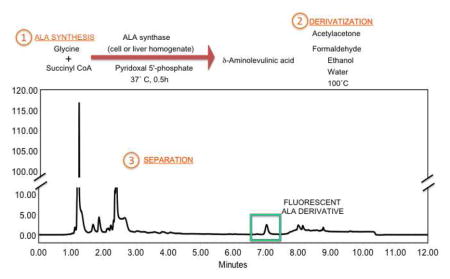
The heme biosynthetic pathway begins with the enzymatic synthesis of δ-aminolevulinic acid (ALA) by ALA synthase (ALAS). The enzyme catalyzes the condensation of glycine and succinyl coenzyme A (succinyl CoA) to yield ALA, CoA-SH and carbon dioxide (Scheme 1). The enzyme requires pyridoxal 5′-phosphate (PLP, Vitamin B6) as a cofactor. In vertebrate species there are two genes encoding similar ALA synthases. One, which is ubiquitous, is designated ALAS1 (E.C. 2.3.1.37). The other is expressed only in developing red blood cells and is designated ALAS2 (E.C. 2.3.1.27). The proteins have a 71% similarity at the amino acid level, with the majority of the differences located at the amino terminal end. The enzymatic mechanisms are identical even though the genes for the two isoforms of ALAS are regulated differently [1].
Scheme 1.
Enzymatic synthesis of δ-aminolevulinic acid. Many ALAS assays have been described in the past few decades, but progress in chemical methods coupled with more recent instrumentation technology can give faster, simpler and more sensitive assays. Newer methods for quantification of ALA have also been published, but many of these are suboptimal for use in conjunction with an ALAS assay.
The rate of heme biosynthesis depends primarily on the level of ALAS activity, which is tightly controlled by levels of intracellular iron and heme [2]. The heme biosynthetic pathway can be affected by genetic defects, availability of certain minerals and vitamins (e.g. vitamin B6, zinc), exposure to toxins (e.g. aluminum, lead), anoxia, fever, level of certain steroid hormones (e.g. estrogen), and other factors [2–6]. Decreased heme biosynthesis can cause anemia as well as neuronal cell dysfunction [7, 8]. Heme has been shown to be critical for the growth, differentiation and survival of mammalian adipose, erythroid and neuronal cells [9–11]. Additionally, inhibition of heme synthesis causes programmed cell death in the human epithelial cervix carcinoma HeLa cells [12]. Alternatively, increased heme biosynthesis plays an important role in the progression of certain cancers [13] and in precipitating attacks of acute neurovisceral porphyrias [14]. Therefore, determining the heme biosynthetic rate in various cells under various conditions is important for studying etiology and progression of many diseases.
Many methods have been developed to measure ALAS activity but all have been hampered by the difficulty in quantifying the reaction product, namely ALA. ALA has been derivatized with acetyl acetone to yield a pyrrole, which can be reacted with Erlich’s aldehyde. This produces a chromogen that can be quantified colorimetrically [15]. Others have used coupled assays to enzymatically convert ALA to PBG [16]. Radiolabeled glycine has also been employed to generate labeled ALA [17]. ALA synthases are mitochondrial enzymes and some methods to assay activity have necessitated isolating mitochondrial fractions from tissues of interest in order to maximize the amount of ALA generated. All of these methods have been hampered by the difficulty in isolating ALA from tissue extracts free of interfering contaminants.
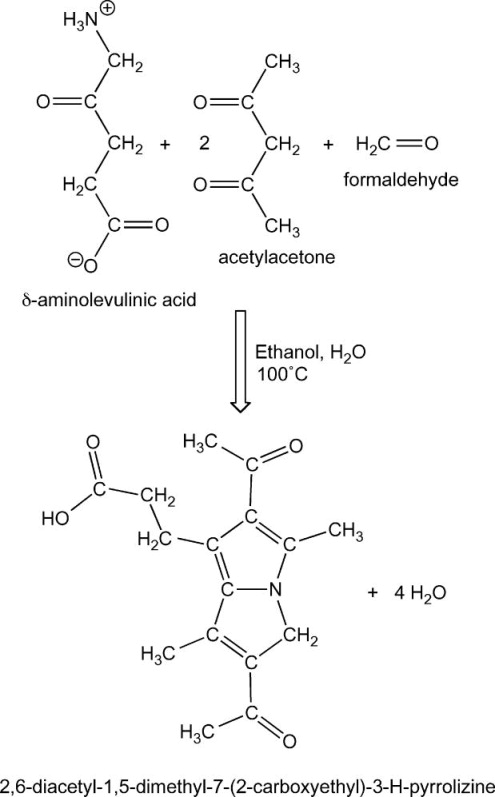
Here we provide a method for assaying ALAS activity without the need to isolate mitochondria, or to utilize radiolabeled substrates. The method can be adapted to cultured cell lysates or tissue homogenates. Sensitivity of the assay is enhanced by generating a fluorescent derivative of ALA through the Hantzsch reaction and by optimizing chromatography conditions to separate the derivatized ALA. The Hantzsch reaction involves condensation of an amine, ALA in this case, with acetylacetone and formaldehyde to yield a fluorescent product (Scheme 2) [18]. We have optimized the acetylacetone/ formaldehyde derivatization to maximize the sensitivity of the ALAS assay in whole cell or tissue homogenates.
Scheme 2.
Hantzsch derivatization of δ-aminolevulinic acid. δ-Aminolevulinic acid reacts with 2 molecules of acetylacetone and 1 molecule of formaldehyde to form the fluorescent derivative 2,6-diacetyl-1,5-dimethyl-7-(2-carboxyethyl)-3-pyrrolizine with an excitation maximum of 370 nm and an emission peak at 460 nm.
In complex samples such as tissue homogenates, the abundance of reactive amines often interferes with the fluorescence of the Hantzsch ALA derivative. Since ALA is present in minuscule amounts relative to the other amines, a UPLC method was developed to separate its fluorescent derivative from the unwanted products, especially that of derivatized glycine.
METHODS
Reagents
All of the chemicals used were obtained either from Fisher Scientific (Fair Lawn, NJ) or Sigma-Aldrich (St. Louis, MO) unless otherwise specified below. All of the water used was double distilled deionized.
Mouse liver homogenate
C57Bl/6J mice were given daily injections of phenobarbital 80 mg/kg to induce heme biosynthesis [19]. After three days of treatment, the mice were euthanized by cervical dislocation and the livers were quickly excised. A liver piece weighing approximately 100 mg was removed, added to four volumes (400 μL) of ice-cold 0.25 M sucrose, and homogenized with ten up- and -down strokes in a 2-mL glass-Teflon tissue homogenizer in an ice bath. The resulting 20% w/v homogenate was stored at −80°C until needed.
Cultured cell homogenate
Mouse erythroleukemia cells DS19 (MEL) were grown in Dulbecco’s Modified Eagle Medium (DMEM) with nonessential amino acids supplemented with 10% fetal bovine serum, 2 mM L-glutamine, 1 mM sodium pyruvate, 50 U/mL penicillin and 50 μg/mL streptomycin. The cultures were incubated at 37°C in 5% CO2 and passaged 1:10 three times per week. MEL cells were induced to differentiate along the reticulocyte pathway by adding 1.5% dimethylsulfoxide (DMSO) to the growth media. Cells were seeded at 5×10⁵/mL in 50 mL media and grown for 24, 48, 72 or 96 hrs. Cultures were harvested by pelleting cells at 1,700 rpm for 10 min. The pellet was washed with 10 mL phosphate buffered saline (PBS) pH 7.4. The cell pellet was resuspended in 50 μL PBS, homogenized by freeze thawing and brief sonication, followed by centrifugation at 5,000 rpm for 5 min in a microcentrifuge. The protein concentration of the supernatant was determined and used for all subsequent measurements.
Protein assay
The homogenates were assayed for protein content using a Pierce BCA Protein Assay Kit by Thermo Scientific (Rockford, IL). Each sample was diluted 100x, 150x and 200x with water and each dilution was assayed in duplicate to give a total of 6 readings. The albumin standard supplied with the kit was diluted with water to give a quantitation range of 0.0 to 0.8 mg/mL. A 200 μL aliquot of working reagent was placed into each well of a 96-well microplate and then mixed with 10 μL of diluted sample or albumin standard solution. The microplate was then incubated at 37°C for 0.5 h and allowed to stabilize to room temperature for about 15 min. The absorbance at 490 nm was measured in a SpectraMax 190 microplate reader paired with SoftMax Pro v5.0b7 software, both from Molecular Devices Corp. (Sunnyvale, CA).
Succinyl coenzyme A
Succinyl CoA was prepared by combining the methods used by Lawrence [20] and Simon and Shemin [21]. Three aqueous solutions were prepared and kept on ice: 7.95 mg/mL coenzyme A, 3.50 mg/mL succinic anhydride and 12.50 mg/mL NaHCO3. Equal volumes of these solutions were mixed and incubated on ice for 30 min and then used in the ALAS assay. The resulting succinyl CoA solution may also be aliquoted and stored for up to one month at − 80°C. Succinic anhydride must be dissolved in ice-cold water to minimize conversion to succinic acid before reacting with coenzyme A. The reaction was maintained at pH 7–7.5 with the NaHCO3 solution. Succinyl CoA formation was checked by the hydroxamic acid method (disappearance of succinic anhydride) of Lippman and Tuttle [22] and the nitroprusside method for acyl mercaptans of Cinnard and Hellerman [23].
ALAS assay
ALAS activity was assayed using a method modified from that of Aoki et al. [24]. The 20% w/v liver homogenate was adjusted to 12 mg protein/mL (about 10% w/v liver) in 0.125 M sucrose and 50 μM succinylacetone (4,6-dioxoheptanoic acid) unless otherwise specified. Succinylacetone is a potent inhibitor of ALA dehydratase (ALAD), and prevents conversion of ALA to porphobilinogen [1]. A 25 μL aliquot of the resulting 12 mg/mL homogenate was mixed with 25 μL ALAS assay buffer, 50 mM potassium phosphate pH 7.4, such that the 50 μL mixture contained 50 mM glycine, 100 μM succinyl CoA, 40 μM pyridoxal 5′-phosphate and 50 μM succinylacetone. The mixture was incubated at 37 °C for 30 min, and then diluted with 450 μL of ice-cold water. The diluted sample was kept on ice or stored frozen until the ALA was derivatized.
Derivatization of ALA
The derivatizing agent (DA) for ALA quantitation was a mixture modified from Giuntini et al. [25]. All steps in this procedure were performed under minimal lighting. DA was prepared for each sample by mixing water, 37% formaldehyde, ethanol and acetylacetone in a separate tube (107:5:15:23 by volume). The mixture was vortexed vigorously for 3 min or more until a clear colorless solution was obtained. The DA had to be held at about 30°C, approximately the lowest temperature at which it could remain as a true solution. A 50 μL aliquot of the diluted ALAS assay sample (above) was mixed with 150 μL DA, incubated in a covered heat block at 100–103°C for 5 min and then placed in an ice bath for one to six hours. The sample was centrifuged for 10 min at 14,000 rpm in a microfuge at 4°C. The supernatant was collected and kept at 4°C for a minimum of 1 h, or until injection into the UPLC.
The interfering effects on the formation of the ALA derivative by the various reagents in the ALAS assay were examined. The effect of up to 1 M sucrose, and those of 50 mM candidate buffers such as potassium phosphate, Tris, HEPES or PBS (phosphate buffered saline) to keep the enzyme reaction at or near pH 7.4 were observed. Measures to mitigate any deleterious effect were determined and incorporated in the formulation of the overall ALAS activity assay procedure.
The stability of the ALA derivative under various conditions was also examined. Fifty-microliter aliquots of ALAS assay buffer (50 mM potassium phosphate pH 7.4, 50 mM glycine, 100 μM succinyl CoA, 40 μM 5′-pyridoxal phosphate and 50 μM succinylacetone) were spiked with either 0.1 or 1.0 μM ALA, and then diluted with 450 μL ice-cold water. A 50 μL aliquot from each of the 10x diluted ALAS assay samples was then derivatized. The resulting mixtures were kept for 1, 6 and 48 h and at −80, −20, 0, and 25°C, and under various lighting conditions, dark, ambient, and UV. The baseline or reference point (sample labeled as ‘0 h, direct inject’) was assigned 100% to the sample that was cooled on ice for one min after removal from the 100°C heat block, centrifuged at 4°C for 14,000 rpm for 10 min and the supernatant immediately injected into the UPLC.
Ultra performance liquid chromatography (UPLC) quantitation
Ten microliters of supernatant containing the derivatized ALA (2,6-diacetyl-1,5-dimethyl-7-(2-carboxyethyl)-3-pyrrolizine) was injected into a Waters Acquity UPLC system which included a binary solvent manager, sample manager, photodiode array detector (PDA), fluorescence detector, column heater and an Acquity UPLC BEH C18, 1.7 μM, 2.1 × 100 mm column. The derivative was separated based on a modification of the method of Tomokuni et.al. [26]. The fluorescence detector was set to excite at 370 nm and monitor emission at 460 nm, while the PDA scanned from 210 to 500 nm. The sample chamber was kept dark and maintained at 5°C. Solvent A was 0.2% aqueous formic acid while Solvent B was 100% methanol. The flow rate was constant at 0.3 mL/min at 50°C for the total run time of 12 min. The following gradient schedule was used and the percent Solvent A at each step was as follows: 0 min, 80%; 6 min, 60%; 7 min, 1%; 9 min, 1%; 9.5 min, 80%. The gradient for solvent composition from 0–6 min was Waters Gradient 5 (convex with a higher slope at 0 min compared to that at 6 min), while that from 6–7 min was set at Waters Gradient 7, concave. All other gradients in the method were linear.
ALA assay optimization
The manipulation steps and buffers used for ALA quantitation were modified step-wise to obtain the greatest sensitivity in the UPLC. The duration of the derivatization reaction, at 100 °C, was varied from 0 to 20 min. Solutions of ALA, in the following buffers at pH 7.4 were tested: 5 and 50 mM potassium phosphate (KPi), 5 and 50 mM Tris, 5 and 50 mM HEPES, water, and phosphate buffered saline (PBS, 137 mM NaCl, 10 mM Na2HPO4, 2.7 mM KCl). Solutions of ALA from 0.0 to 2.0 μM were prepared in each buffer and water. The effect on the fluorescence signal detected for 1 μM aqueous ALA when varying amounts of homogenate, ALAS assay reagent, sucrose (0 to 0.5 M) and glycine from (0 to 150 mM) were also examined.
Limits of detection (LOD) and quantitation (LOQ)
LOD and LOQ were calculated based on the standard error of the y-intercept (SEy) of the calibration curves for standard solution. The standard deviation (SDy) was taken as the SEy multiplied by the square root of the number of points on the calibration curve. The LOD was 3.3 times SDy divided by the slope of the standard calibration, while LOQ was 10 times SDy divided by the slope. The SEy value was one of the set of values calculated using the Microsoft Excel function LINEST. Calibration curves were made with every replicate of every batch of samples assayed for activity. These consisted of mouse liver homogenates with protein concentrations adjusted to the same level as that of the actual samples but spiked with increasing amounts of commercially obtained authentic ALA. Other calibration curves were also made on samples that contained no liver homogenate but only ALA in 0.125 M sucrose and 50 μM succinylacetone.
RESULTS
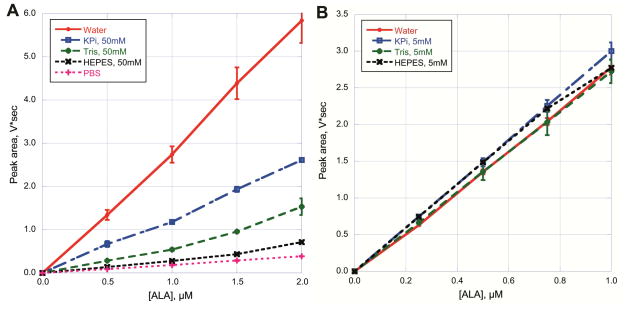
Many assays for ALAS activity require that mitochondria be purified from the starting material to ensure that the specific activity of the enzyme is high enough to be measured over the background noise. Our goal was to develop an assay for ALAS that could be used with a mouse liver homogenate as the starting material. Most liver homogenates use an isotonic solution of buffer and sucrose to prevent excessive fragmentation of subcellular organelles and denaturation of proteins. Our initial ALA synthase assays were successful but quantifying the ALA produced was problematic due to peak interference from other cellular components. To increase the signal to noise ratio for ALA we derivatized ALA to a fluorescent product. We determined the factors that influence efficiency of derivatization and separation of the final product, 2,6-diacetyl-1,5-dimethyl-7-(2-carboxyethyl)-3-pyrrolizine (Scheme 2). Sucrose was tested up to 1 M and did not affect the signal intensity (data not shown). The buffering capacity was tested to provide an optimum pH, 7.4, for the ALAS reaction [27]. Various buffers were then tested for the ability to interfere with the assay, and all showed a major reduction in fluorescence (Figure 1a). However, the interference could be minimized when the sample is diluted 10x with ice-cold water prior to derivatization (Figure 1b). Continued ALA synthesis was rendered insignificant after addition of ice -cold water at the end of the required incubation time (data not shown).
Figure 1.
Influence of buffers on derivatization of ALA. The area under the curve (V*sec) is plotted against ALA concentration in μM. (A) Buffers at a 50 mM concentration are optimal for the initial ALAS reaction, potassium phosphate (KPi). Tris, HEPES and phosphate buffered saline (PBS) were titrated to pH 7.4 and tested to determine if there was any effect on the ability to convert ALA (0.5, 1.0, 1.5 and 2.0 μM) to 2,6-diacetyl-1,5-dimethyl-7-(2-carboxyethyl)-3-pyrrolizine. (B) Assay mixtures from (A) were diluted 10X with water and then derivatized.
Representative fluorescence UPLC chromatograms are shown in Figure 2. Glycine, which also formed a fluorescent product with the ALA derivatization reagent, eluted at ~1.0 min. The identification of the derivatized ALA peak was based on a parallel run where ALA was spiked into the homogenate at 0.5 μM. The chromatographic trace from the sample that was not spiked with ALA (0.0 μM added) has activity characteristic of a control mouse liver homogenate. The activity assay mixtures were diluted 10x before derivatization and subsequent UPLC analysis.
Figure 2.
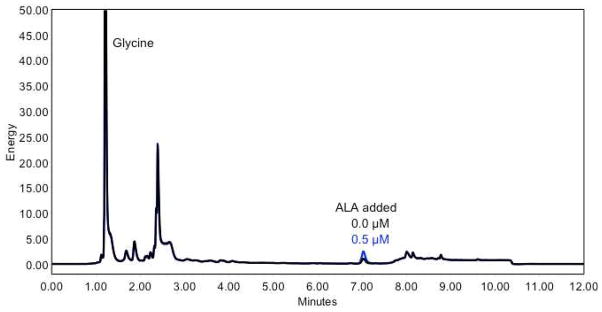
Fluorescence UPLC chromatograms of ALA derivative with and without addition of 0.5 μM authentic ALA. The energy of the truncated glycine derivative peak was 121 (Y axis). The energy peak heights for 0.0 and 0.5 μM ALA were at 1.1 and 2.5, respectively.
Samples were tested for degradation of ALA prior to derivatization when kept on ice for up to 4 hours or frozen for 7 days. No loss of signal was observed in samples that were derivatized after storage when compared to freshly derivatized samples (data not shown). The derivatization reaction gave a maximal signal after 5 min of heating at 100°C. The derivatized mixture required a 60-min cooling period at 4°C before a reproducible fluorescence reading could be obtained.
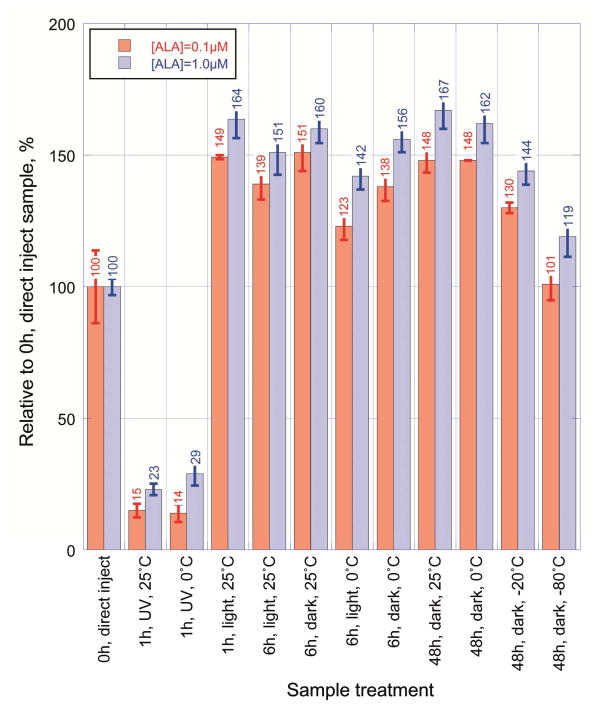
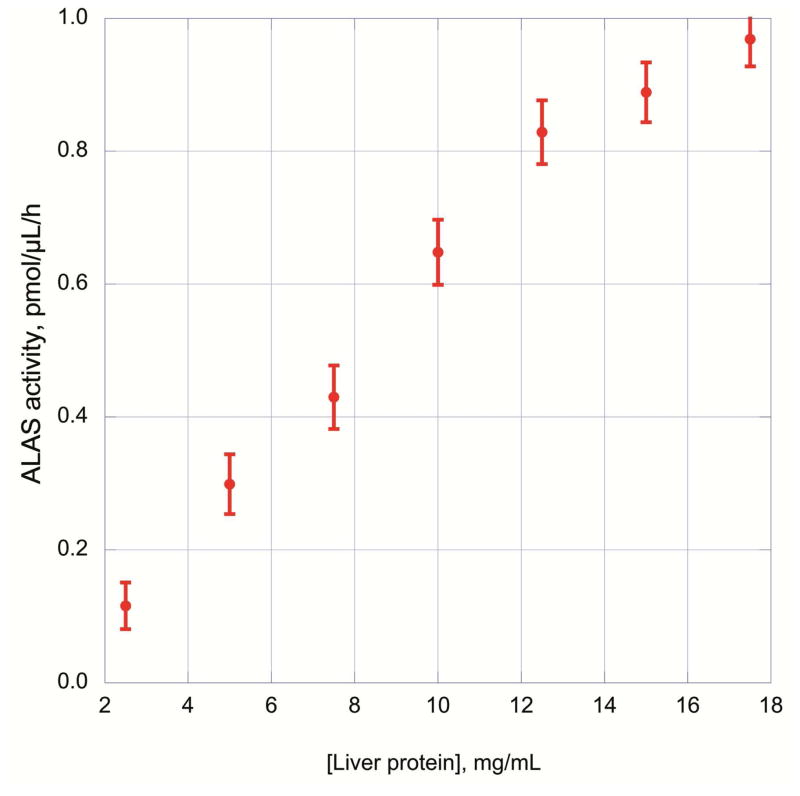
The derivatized sample was also subjected to various conditions prior to separation by UPLC to check the stability of the 2,6-diacetyl-1,5-dimethyl-7-(2-carboxyethyl)-3-pyrrolizine formed (Figure 3). Early experiments suggested that exposure of the sample to UV light was a significant variable that needed to be minimized to obtain consistent fluorescent readings. The reaction mixture was tested for light stability by exposing to room light, UV light and darkness for various periods of time before injecting into the UPLC. The 0 time point sample (100% relative fluorescence, 0 h, direct inject) was cooled on ice for a minute, centrifuged and an aliquot was immediately injected into the UPLC. UV exposure readily destroyed the derivative, while all the other treatments gave a higher fluorescence signal than the untreated sample at time 0 h. A more detailed examination of the derivatized samples kept in the dark, on ice or frozen showed no more than 5% difference in signal intensity from 1 h to 15 hrs. These times were tested to ensure that no significant signal change was occurring while the samples were in the auto-sampler awaiting UPLC injection and separation. Based on the results of these ALA assay optimization experiments, the conditions for the ALAS activity assay were also examined. A range of protein concentrations, which could conveniently be used in the assay, showed a linear correlation with the amount of ALA synthesized (Figure 4). Activity of ALAS was linear relative to the amount of liver homogenate added. The linear regression coefficient calculated was 0.998 for protein concentrations up to 12.5 mg/mL, and then decreased overall to 0.987 upon including the results up to 17.5 mg/mL. The size of the liver piece used to make the homogenate could be as small as 10 mg and the homogenate volume used in the activity assay could be scaled down to 10 μL instead of 25 μL, while still yielding similar activity results (data not shown).
Figure 3.
Stability of the ALA derivative under various conditions between formation and UPLC. Assays for activity of ALAS were set up with a volume of 50 μL ALAS assay buffer (50 mM potassium phosphate pH 7.4, 50 mM glycine, 100 μM succinyl CoA, 40 μM 5′-pyridoxal phosphate and 50 μM succinylacetone). The mixture was spiked with either 0.1 or 1.0 μM ALA, and then diluted with 450 μL ice-cold water. A 50 μL aliquot of the diluted ALAS assay sample was derivatized analyzed by UPLC as described above.
Figure 4.
Dependence of ALA synthesis on total liver protein. Livers were homogenized in 0.25 M sucrose and then diluted, 2.5 to 17.5 mg protein/mL. Samples were then analyzed for ALAS activity with the optimal concentrations of reactants (50 mM glycine, 50 μM succinylacetone, 100 μM succinyl CoA, 40 μM pyridoxal 5′-phosphate, 50 mM potassium phosphate pH 7.4).
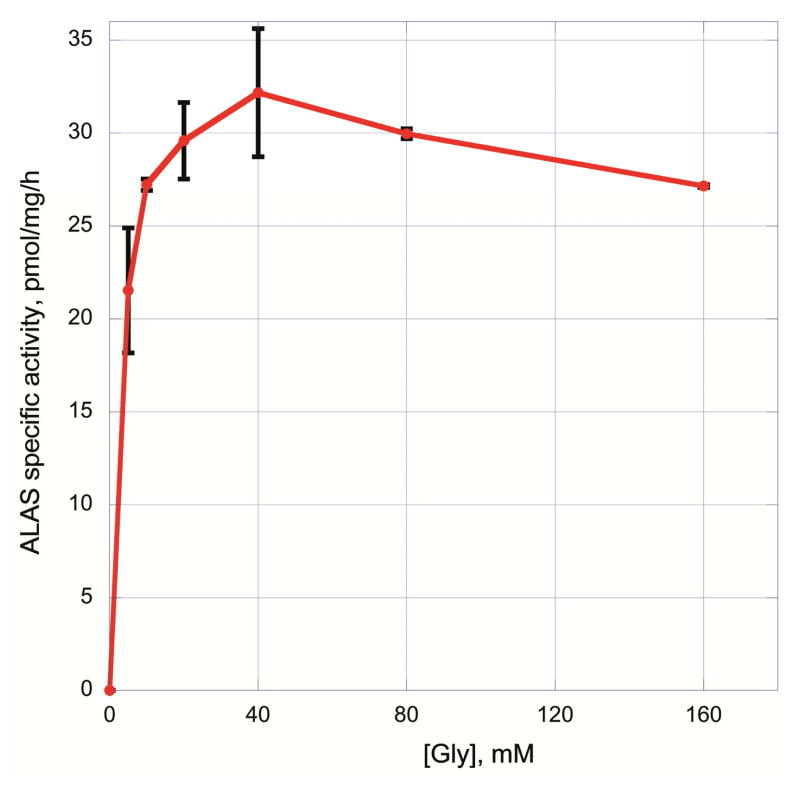
Previous studies suggested a wide range of glycine concentrations, up to 200 mM, were required to reach the Km for ALAS [27, 28]. Since glycine also formed a fluorescent product with the ALA derivatization reagent, ALAS activity was measured at different glycine concentrations in order to reduce its potential for interference with the ALA quantitation. Glycine at 50 mM proved sufficient for maximal ALAS activity in mouse liver homogenates (Figure 5).
Figure 5.
ALAS activity assay at different concentrations of glycine. Activity of ALAS was measured with 0 mM, 10 mM, 20 mM 40 mM and 80 mM 160 mM added glycine in the reaction mixture. Activity was maximal at 40 mM glycine, with a declining rate after that.
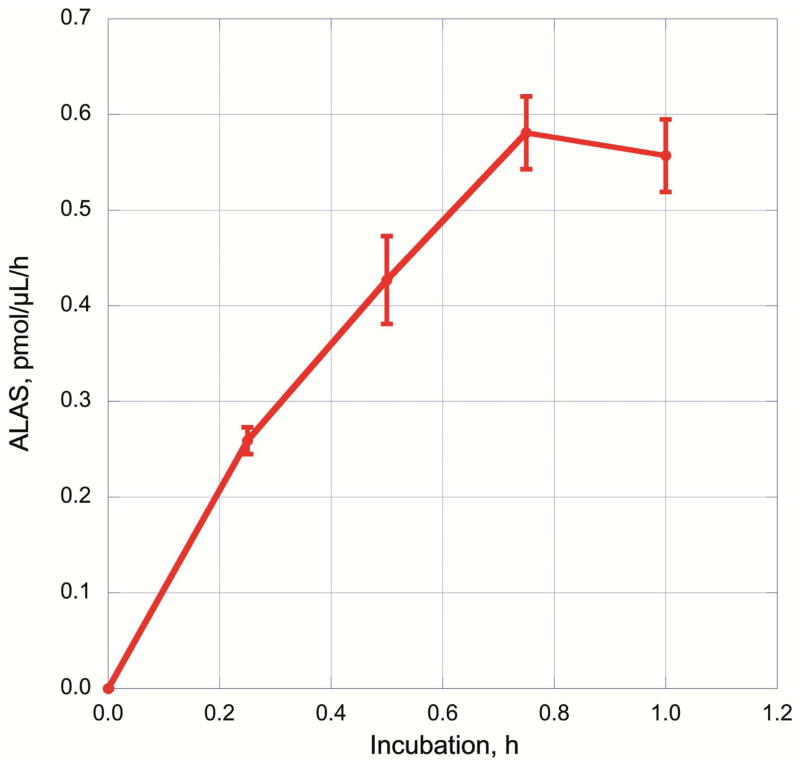
The progress of ALA synthesis was also measured at different time points. The rate of ALA production was approximately linear, up to 45 min of incubation at 37°C (Figure 6). The 30 min incubation time for measuring ALA activity was sufficient to yield a readily quantifiable amount of ALA.
Figure 6.
Time course for ALA production by ALAS present in a mouse liver homogenate. ALAS activity was measured with the optimal concentrations of reactants (50 mM glycine, 50 μM succinylacetone, 100 μM succinyl-CoA, 40 μM pyridoxal 5′-phosphate, 50 mM potassium phosphate pH 7.4, 12 mg/mL protein) for 0, 15, 30, 45 and 60 min.
The addition of 50 μM succinylacetone to inhibit the activity of ALAD in the enzyme assay mixture was necessary, since it was observed early in the optimization process that ALA produced in the homogenate was present at very low levels unless succinylacetone was added. Homogenates were also spiked with 0.5 μM ALA and assayed at 0, 25, 50, 75,100, and 125 μM succinylacetone. Only the sample that contained 0 μM succinylacetone exhibited loss of ALA. All of the homogenate samples had approximately the same fluorescence peak area for the spiked 0.5 μM ALA when succinylacetone was present at 25 to 125 μM. The area of the spiked ALA peak at 0 μM succinylacetone was only 21%, relative to that of the ALA peak in any sample with succinylacetone (25–125 μM). In other words, 79% of the 0.5 μM ALA had been metabolized in 0.5 h of incubation at 37°C.
The limits of detection (LOD) and limits of quantitation (LOQ) for derivatized ALA were determined in three different ways. First, samples of ALA in an aqueous solution were directly derivatized and separated by UPLC. The LOD and LOQ were 5.5 and 16.7 pM respectively. When ALA in solution was added to the buffers used in the ALA assay and processed with the same protocol the LOD and LOQ were 152 and 461 pM respectively. When the mouse liver homogenate was spiked with ALA, derivatized and separated by UPLC the LOD and LOQ were 1.3 and 3.9 nM, respectively.
The activity of ALAS from livers of mice treated with phenobarbital was tested at the time of preparation and the samples were then frozen at −80°C. After 16 months the identical samples were thawed and retested for ALAS activity (Table 1). In the control group activity declined 24% while in the phenobarbital treated group activity decreased 14%. The calculated induction by phenobarbital was approximately the same, 12.2 vs. 13.7, between the samples assayed approximately a year apart.
Table 1.
ALAS activity from fresh and frozen samples
| ALAS Activity* pmol/mg protein/h | ||
|---|---|---|
| Months of Storage | 0 | 16 |
| No Treatment | 56 ±5 | 43±16 |
| Phenobarbital | 684±316 | 588±278 |
4 mice per group
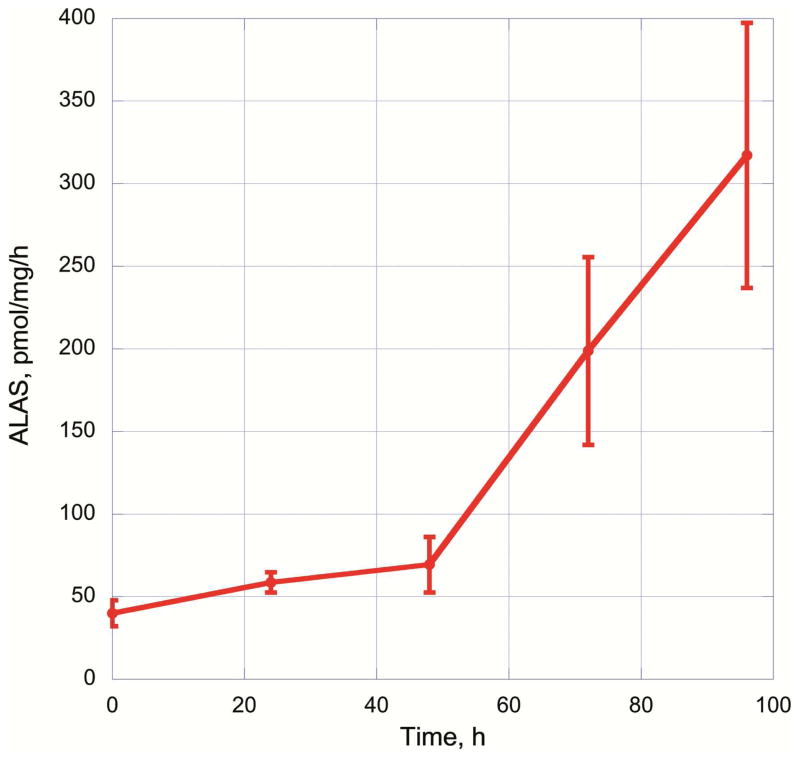
ALAS activity was also measured in cultured cells. MEL cells were induced to differentiate along the red cell lineage by induction with 1.5% DMSO. Cells were harvested at 24 h intervals. Cells were pelleted and washed with PBS and frozen at −20°C until all time points had been collected. The activity was measured at each of the time points to follow induction of the heme biosynthetic pathway. There was minimal induction of ALAS even out to 48 hours but by 96 h a 6.5-fold induction in ALAS activity was observed. Each of the time points utilized approximately 5 × 10⁷ cells and there was sufficient protein extract to assay each sample a minimum of ten times. The increasing variability at later times of the induction process may be due to the cultural variability of the MEL cells with respect to time.
CONCLUSIONS
Our goal was to develop an assay for ALAS that was sensitive, reproducible and did not require either radiolabeled precursors or purification of the reaction product ALA. This required optimization of each step in the process from tissue homogenization to the final UPLC method. Previous methods for determining ALAS activity have shown that assaying for ALAS activity was straightforward but a major problem was detecting and quantifying the amount ALA produced in the reaction [29]. Most techniques readily allow ALA quantification but only when ALA is present at higher concentrations and without the interference of reagents required for optimal ALAS activity.
We developed a method suitable for measuring the total ALAS activity in whole tissue or cultured cells, with no need to fractionate them to obtain ALAS-enriched fractions to suit less sensitive assay methods. The reported values for ALAS activity in mouse liver homogenate varies widely from about 30 to 330 pmol/mg/h [30] [29] without succinyl CoA supplementation. Bonkowsky et al. [31] showed the need for an exogenous succinyl CoA generating system to maximize measurable ALAS activity in human and mouse but not in rat liver homogenates. This manuscript suggested that the endogenous succinyl CoA might be labile to freeze thawing. This report it suggests that ALAS activity in a control mouse liver homogenate approximately doubled to 380 pmol/mg/h with addition of a succinyl CoA generating system [31]. We added 100 μM succinyl CoA to our 30 min assay and the maximal specific activity reached 56 pmol/mg/h with this new method.
We optimized the quantitation of ALA by derivatizing to a fluorescent compound to give a highly sensitive, specific assay that was simple to perform. The components of enzyme assay mixture; the buffers and even the homogenate sample itself were shown to interfere with the formation of the fluorescent ALA derivative. Simple dilution seemed to solve these interference problems with the ALA derivatization, as Tomokuni et al. [26] found earlier. After enzymatic formation of ALA, dilution with water allowed derivatization of the formed ALA that was readily quantifiable. In samples that initially contained 12 mg protein/mL the homogenate was effectively diluted a total of 80x upon injection into the UPLC. Although, the glycine added for the activity assay was diluted 40x (water and then derivatization reagents) it still produced a significant fluorescence signal. Development of a UPLC method for able to separate the non-specific derivatized amines from the very small amount of ALA derivative provided the necessary advancement to permit this method to be used in whole liver/cell homogenates, rather than purified mitochondria. This derivative peak can be baseline resolved with the current UPLC method. The ALA derivative was also separated from other very strongly UV-absorbing substances. Moreover, it was found that the endogenous ALAS in the samples could be saturated with glycine at concentrations as low as 40 mM [27, 28].
The protein concentration used in the assay was easily within the linear range of dependence of activity versus amount of sample present. This was taken, as a further indication that the fluorescence signal obtained was specific for ALA synthesis. Also, in some samples having insufficient volume for the 12 mg/mL requirement, we found that sample protein concentration as low as 5.0 mg/mL yielded reliable results. Mouse liver samples as small as 10 mg could be homogenized using freeze/thaw and minimal sonication to obtain a homogeneous suspension.
The derivatized ALA had been reported to be sensitive to UV light [32]. The present observations confirmed this, thereby requiring every derivatized sample to be kept on ice or colder and protected from light. The derivatizing agent also contained volatile organic solvents so the samples awaiting UPLC injection were also kept cold and in covered sample tubes in the darkened sample chamber to minimize evaporation of sample and exposure to light. The derivitized samples also needed about an hour at 4°C to stabilize to give more consistent UPLC readings.
The limits of detection (LOD) and quantitation (LOQ) for ALA in the derivatized UPLC sample were about 1.3 and 3.9 nM, respectively. These represented 13 and 39 fmol of ALA derivative per 10 μL injection. The equivalent concentrations in the original 80-fold enzyme assay sample were 102 and 309 nM, respectively. Donelly [32] reported corresponding values of 298 nM (0.05 μg/mL) and 835 nM (0.14 μg/mL), respectively, before derivatization. However, since the derivatization reagent in their method also diluted samples 80-fold, the LOD and LOQ in their HPLC injection represented 3.7 and 10.4 nM of ALA derivative, respectively. These are very similar to values we obtained from samples spiked with progressively increasing concentrations of ALA. The values of LOD and LOQ were affected by the actual samples used. They were over eight times lower when the ALA spiked homogenate was replaced with ALA in water. The ALA quantitation method was over 27 times more sensitive when the ALA was directly treated with acetylacetone/formaldehyde compared to when it went through the enzyme activity process. This illustrates the importance of calibrating the assay for the type and amount of standard sample matrix to come as close as possible to that of the actual sample matrix to be assayed.
Use of the fluorescence derivative of ALA provides an increased sensitivity to the assay relative to colorimetric methods. The Hantzsch reaction product from the condensation reaction of an amine, ALA in this case (Scheme 2), acetylacetone and formaldehyde has been reported to give a very high fluorescence yield [33]. The use of o-phthaldialdehyde (OPA) as a derivatization agent required several hours to prepare and three hours of boiling for the reaction itself [34]. Donelly et al. [32] examined several ALA quantitation methods and performed validation studies on the two methods above. Fluorescamine is highly reactive and not as sensitive as the Hantzsch derivatization [18]. All of these derivatization reagents react with the amino groups of all compounds present to give fluorescent derivatives. Since the assay of ALAS requires glycine in high concentrations, the subsequent chromatographic method must be able to separate the ALA derivative from the other derivatized amines and the rest of the ALAS activity assay components. In this study, we optimized the acetylacetone/formaldehyde derivatization as part of our method development for the determination of ALAS activity in mouse liver. This is the first reported time course of ALAS activity in MEL cells induced with DMSO (Figure 7). There is a biphasic increase in ALAS activity with a clear inflection point change at 48 h. We did not assay activity past 96 h, however, it is possible that the rate of change at the later time points may be maximal.
Figure 7.
Activity of ALAS in Mouse Erythroleukemia (MEL) cells induced with DMSO. Activity of ALAS was measured in MEL cells at 24, 48, 72 and 96 h after induction with 1.5% DMSO. Each sample was harvested from 30 mL of MEL cells. Activity is calculated as pmol ALA produced per mg total protein per hour. Three independent cultures were induced with DMSO, samples were collected at the indicated time points for each culture.
Accurate analysis of ALAS activity must include the derivatization of a control sample where the fluorescent signal produced from the endogenous ALA present in the test sample can be subtracted from the ALA produced in the ALAS reaction. In each of the samples, assays were run in triplicate to ensure that a reliable rate could be determined. The assay is sensitive enough to be used with cells grown in culture as well as with tissue homogenates. This method has the advantage that there is no need to isolate and purify mitochondria. The assay reagents are readily available and the only specialized equipment required for quantitation is an HPLC or UPLC to separate the derivatized compounds.
Highlights.
A method for measuring ALAS activity in cell or tissue homogenate was developed.
A fluorescent derivative of ALA was produced using a modified Hantzsch reaction.
A UPLC method was developed to separate derivatized ALA from other assay components.
Acknowledgments
We would like to thank Christy Warby for her tissue culture expertise. This work was supported by funds from NIH, NIDDK RO1 DK020503 and U54 DK083909.
ABBREVIATIONS
- ALA
δ-aminolevulinic acid
- ALAS
δ-aminolevulinic acid synthase
- PLP
pyridoxal 5′-phosphate
- UPLC
ultra performance liquid chromatography
- MEL
mouse erythroleukemia cells
- DMSO
dimethylsulfoxide
- PDA
photodiode array detector
- UV
ultraviolet
- succinyl-CoA
succinyl coenzyme A
- LOD
limit of detection
- LOQ
limit of quantitation
Footnotes
Publisher's Disclaimer: This is a PDF file of an unedited manuscript that has been accepted for publication. As a service to our customers we are providing this early version of the manuscript. The manuscript will undergo copyediting, typesetting, and review of the resulting proof before it is published in its final citable form. Please note that during the production process errors may be discovered which could affect the content, and all legal disclaimers that apply to the journal pertain.
References
- 1.Hunter GA, Ferreira GC. Molecular enzymology of 5-aminolevulinate synthase, the gatekeeper of heme biosynthesis. Biochim Biophys Acta. 2011;1814(11):1467–73. doi: 10.1016/j.bbapap.2010.12.015. [DOI] [PMC free article] [PubMed] [Google Scholar]
- 2.Ajioka RS, Phillips JD, Kushner JP. Biosynthesis of heme in mammals. Biochim Biophys Acta. 2006;1763(7):723–36. doi: 10.1016/j.bbamcr.2006.05.005. [DOI] [PubMed] [Google Scholar]
- 3.Dent AJ, et al. Two different zinc sites in bovine 5-aminolevulinate dehydratase distinguished by extended X-ray absorption fine structure. Biochemistry. 1990;29(34):7822– 8. doi: 10.1021/bi00486a007. [DOI] [PubMed] [Google Scholar]
- 4.Doss M, Laubenthal F, Stoeppler M. Lead poisoning in inherited delta-aminolevulinic acid dehydratase deficiency. Int Arch Occup Environ Health. 1984;54(1):55–63. doi: 10.1007/BF00378728. [DOI] [PubMed] [Google Scholar]
- 5.Fishman SM, Christian P, West KP. The role of vitamins in the prevention and control of anaemia. Public Health Nutr. 2000;3(2):125–50. doi: 10.1017/s1368980000000173. [DOI] [PubMed] [Google Scholar]
- 6.Phillips JD, Kushner JP. The Porphyrias. In: Nathan DG, editor. Nathan and Oski’s Hematology of Infancy and Childhood. Saunders; Philadelphia: 2009. pp. 571–612. [Google Scholar]
- 7.Anderson KE, et al. Disorders of Heme Biosynthesis: X-Linked Sideroblastic Anemia and the Porphyrias. In: Scriver CR, et al., editors. The Metabolic and Molecular Bases of Inherited Disease. McGraw-Hill; N.Y: 2001. pp. 2991–3062. [Google Scholar]
- 8.Zhu Y, et al. Heme deficiency interferes with the Ras-mitogen-activated protein kinase signaling pathway and expression of a subset of neuronal genes. Cell Growth Differ. 2002;13(9):431–9. [PubMed] [Google Scholar]
- 9.Ishii DN, Maniatis GM. Haemin promotes rapid neurite outgrowth in cultured mouse neuroblastoma cells. Nature. 1978;274(5669):372–4. doi: 10.1038/274372a0. [DOI] [PubMed] [Google Scholar]
- 10.Rutherford TR, Clegg JB, Weatherall DJ. K562 human leukaemic cells synthesise embryonic haemoglobin in response to haemin. Nature. 1979;280(5718):164–5. doi: 10.1038/280164a0. [DOI] [PubMed] [Google Scholar]
- 11.Chernova T, et al. Neurite degeneration induced by heme deficiency mediated via inhibition of NMDA receptor-dependent extracellular signal-regulated kinase 1/2 activation. J Neurosci. 2007;27(32):8475–85. doi: 10.1523/JNEUROSCI.0792-07.2007. [DOI] [PMC free article] [PubMed] [Google Scholar]
- 12.Ye W, Zhang L. Heme deficiency causes apoptosis but does not increase ROS generation in HeLa cells. Biochem Biophys Res Commun. 2004;319(4):1065–71. doi: 10.1016/j.bbrc.2004.05.089. [DOI] [PubMed] [Google Scholar]
- 13.di Salvo ML, et al. Glycine consumption and mitochondrial serine hydroxymethyltransferase in cancer cells: the heme connection. Med Hypotheses. 2013;80(5):633–6. doi: 10.1016/j.mehy.2013.02.008. [DOI] [PubMed] [Google Scholar]
- 14.Anderson KE, et al. Recommendations for the diagnosis and treatment of the acute porphyrias. Ann Intern Med. 2005;142(6):439–50. doi: 10.7326/0003-4819-142-6-200503150-00010. [DOI] [PubMed] [Google Scholar]
- 15.Watson CJ, Taddeini L, Bossenmaier I. Present Status of the Ehrlich Aldehyde Reaction for Urinary Porphobilinogen. JAMA. 1964;190:501–4. doi: 10.1001/jama.1964.03070190021004. [DOI] [PubMed] [Google Scholar]
- 16.Granick S, et al. Assays for porphyrins, delta-aminolevulinic-acid dehydratase, and porphyrinogen synthetase in microliter samples of whole blood: applications to metabolic defects involving the heme pathway. Proc Natl Acad Sci U S A. 1972;69(9):2381–5. doi: 10.1073/pnas.69.9.2381. [DOI] [PMC free article] [PubMed] [Google Scholar]
- 17.Schneegurt MA. Delta-aminolevulinic acid biosynthesis in Ustilago maydis. J Basic Microbiol. 2005;45(2):155–9. doi: 10.1002/jobm.200410479. [DOI] [PubMed] [Google Scholar]
- 18.Namjoshi S, et al. Liquid chromatography assay for 5-aminolevulinic acid: application to in vitro assessment of skin penetration via Dermaportation. J Chromatogr B Analyt Technol Biomed Life Sci. 2007;852(1–2):49–55. doi: 10.1016/j.jchromb.2006.12.040. [DOI] [PubMed] [Google Scholar]
- 19.Corcos L. Phenobarbital and dexamethasone induce expression of cytochrome P-450 genes from subfamilies IIB, IIC, and IIIA in mouse liver. Drug Metab Dispos. 1992;20(6):797–801. [PubMed] [Google Scholar]
- 20.Lawrence DA. Regulation of the methionine feedback-sensitive enzyme in mutants of Salmonella typhimurium. Journal of Bacteriology. 1972;109(1):8–11. doi: 10.1128/jb.109.1.8-11.1972. [DOI] [PMC free article] [PubMed] [Google Scholar]
- 21.Simon EJ, Shemin D. The preparation of S-succinyl coenzyme A. J Amer Chem Soc. 1953;75:2520–2526. [Google Scholar]
- 22.Lipmann F, Tuttle LC. A specific method for the determination of acyl phospates. J Biol Chem. 1945;159:21–28. [Google Scholar]
- 23.Cinard FP, Hellerman L. Determination of Sulfhydryl Groups in Certain Biological Substances. In: Glick D, editor. Methods of Biochemical Analysis. InterScience Pubishers Inc; New York: 1954. [DOI] [PubMed] [Google Scholar]
- 24.Aoki Y, et al. Measurement of delta-aminolevulinic acid synthetase activity in human erythroblasts. Journal of Clinical Investigation. 1974;53(5):1326–34. doi: 10.1172/JCI107680. [DOI] [PMC free article] [PubMed] [Google Scholar]
- 25.Giuntini F, et al. Quantitative determination of 5-aminolaevulinic acid and its esters in cell lysates by HPLC-fluorescence. J Chromatogr B Analyt Technol Biomed Life Sci. 2008;875(2):562–6. doi: 10.1016/j.jchromb.2008.09.031. [DOI] [PubMed] [Google Scholar]
- 26.Tomokuni K, et al. Optimized liquid-chromatographic method for fluorometric determination of urinary delta-aminolevulinic acid in workers exposed to lead. Clin Chem. 1987;33(9):1665–7. [PubMed] [Google Scholar]
- 27.Bishop DF, McBride L, Desnick RJ. Fluorometric coupled-enzyme assay for delta-aminolevulinate synthase. Enzyme. 1982;28(2–3):94–108. doi: 10.1159/000459094. [DOI] [PubMed] [Google Scholar]
- 28.Brooker JD, et al. Radiochemical assay for gamma-aminolevulinate synthase. Enzyme. 1982;28(2–3):109–19. doi: 10.1159/000459095. [DOI] [PubMed] [Google Scholar]
- 29.Ebert PS, et al. A simple micro method for the direct determination of delta-amino (14C) levulinic acid production in murine spleen and liver homogenates. Biochim Biophys Acta. 1970;208(2):236–50. doi: 10.1016/0304-4165(70)90242-4. [DOI] [PubMed] [Google Scholar]
- 30.Freshney RI, Paul J. Measurement of aminolaevulinate synthetase activity in normal mouse liver with [2-14C] glycine. Biochim Biophys Acta. 1970;220(3):594–601. doi: 10.1016/0005-2744(70)90289-5. [DOI] [PubMed] [Google Scholar]
- 31.Bonkowsky HL, Pomeroy JS. Assay of delta-aminolevulinic acid synthetase in homogenates of mouse, rat, and human liver: species differences in requirement for an exogenous succinyl-CoA-generating system. Anal Biochem. 1978;91(1):82–91. doi: 10.1016/0003-2697(78)90818-7. [DOI] [PubMed] [Google Scholar]
- 32.Donelly RF, et al. Pharnaceutical analysis of 5-aminolevulinic in solution as tissues. J Photochem & Photobiol B. 2006;82:59–71. doi: 10.1016/j.jphotobiol.2005.08.007. [DOI] [PubMed] [Google Scholar]
- 33.Oishi H, et al. Fluorometric HPLC determination of delta-aminolevulinic acid (ALA) in the plasma and urine of lead workers: biological indicators of lead exposure. J Anal Toxicol. 1996;20(2):106–10. doi: 10.1093/jat/20.2.106. [DOI] [PubMed] [Google Scholar]
- 34.Meisch HU, Reinle W, Wolf U. Determination of 5-aminolevulinic acid in biological samples by high-performance liquid chromatography. Anal Biochem. 1985;149(1):29–34. doi: 10.1016/0003-2697(85)90473-7. [DOI] [PubMed] [Google Scholar]


