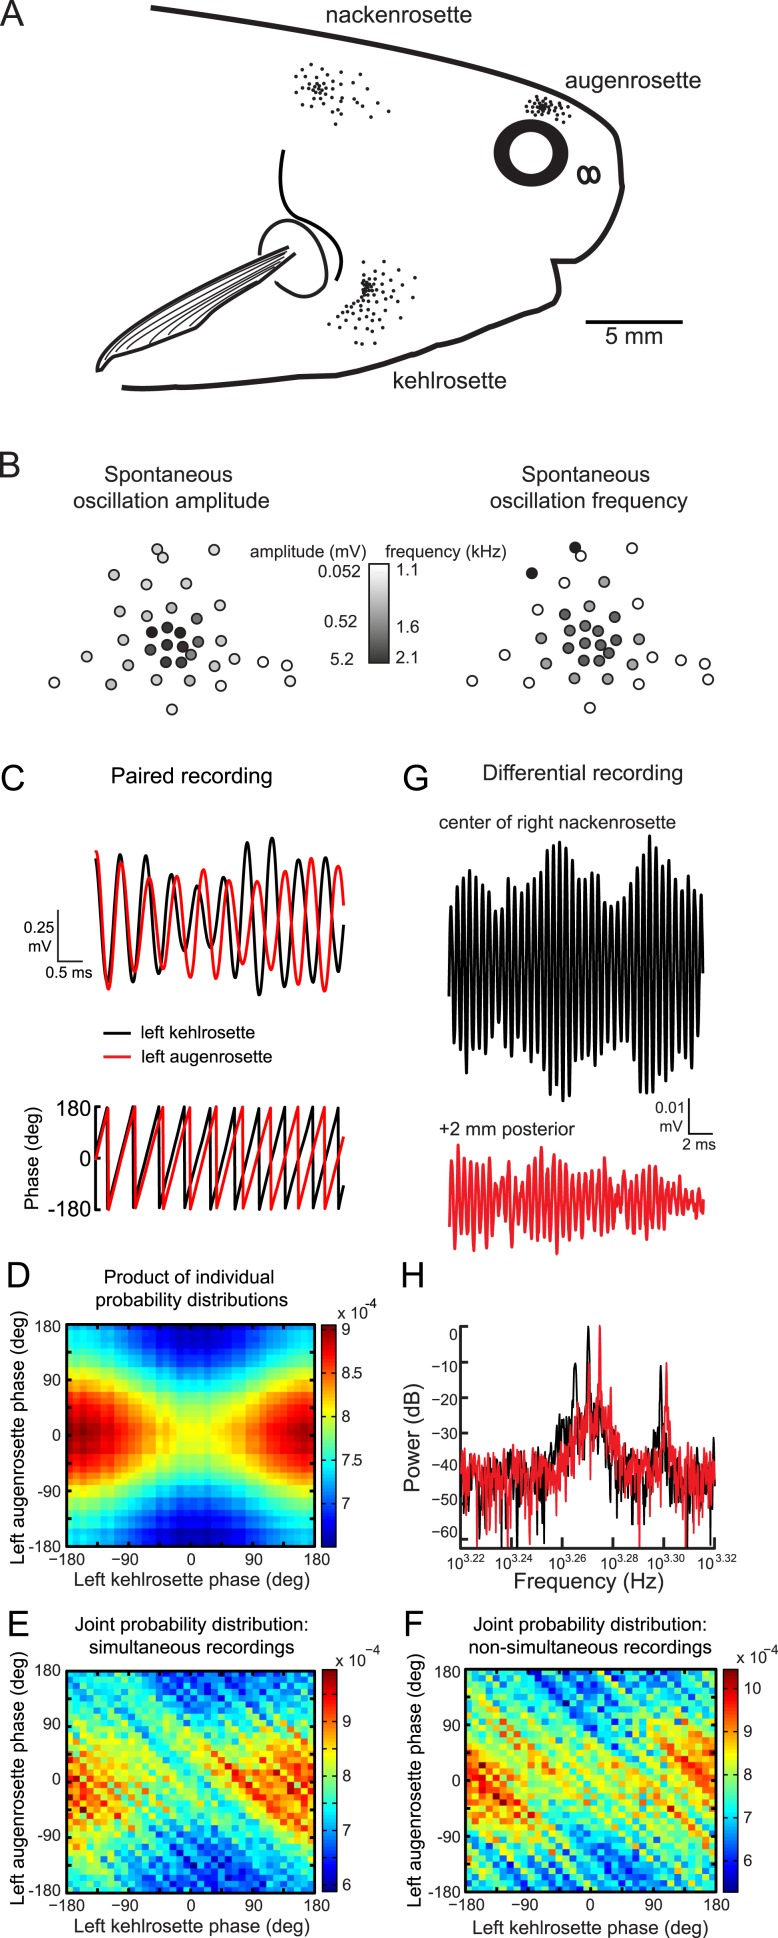
Figure 2. Spontaneous oscillatory activity is not synchronized across receptors.
(A) Receptor locations on the right side of one P. tenuicauda are illustrated as black dots (receptor size not to scale). (B) An approximate map of all 36 receptors in the right augenrosette of one P. tenuicauda. This map comes from a different fish than shown in A. (C) Top, simultaneous extracellular recordings from a receptor in the left kehlrosette (black) and a receptor in the left augenrosette of one P. tenuicauda. Bottom, instantaneous oscillatory phases of the simultaneous recordings obtained through Hilbert transform of the recorded potentials. (D) The product of the individual probability distributions of instantaneous phases from the same two receptors shown in C. The product of the individual probability distributions from each of five separate 1-s recordings was calculated. The average product across these five recordings is shown. (E) The joint probability distribution of instantaneous phases of the two receptors shown in C and D. The joint probability distribution was calculated over five separate 1-s recordings and then averaged. (F) The joint probability distribution of instantaneous phases of the first of five recordings from one receptor and the last of five recordings from the other receptor, and vice versa. The joint probability distributions from these two non-simultaneous recording pairs were averaged. (G) Differential extracellular recordings from a position centered over the right nackenrosette (black) and a position 2 mm posterior (red) in one P. tenuicauda. The recording and reference terminals of the electrode were separated by 5 mm. (H) Power spectra for the differential recordings shown in G. Only the frequency range where peaks occurred is shown (∼1.7–2.1 kHz).

