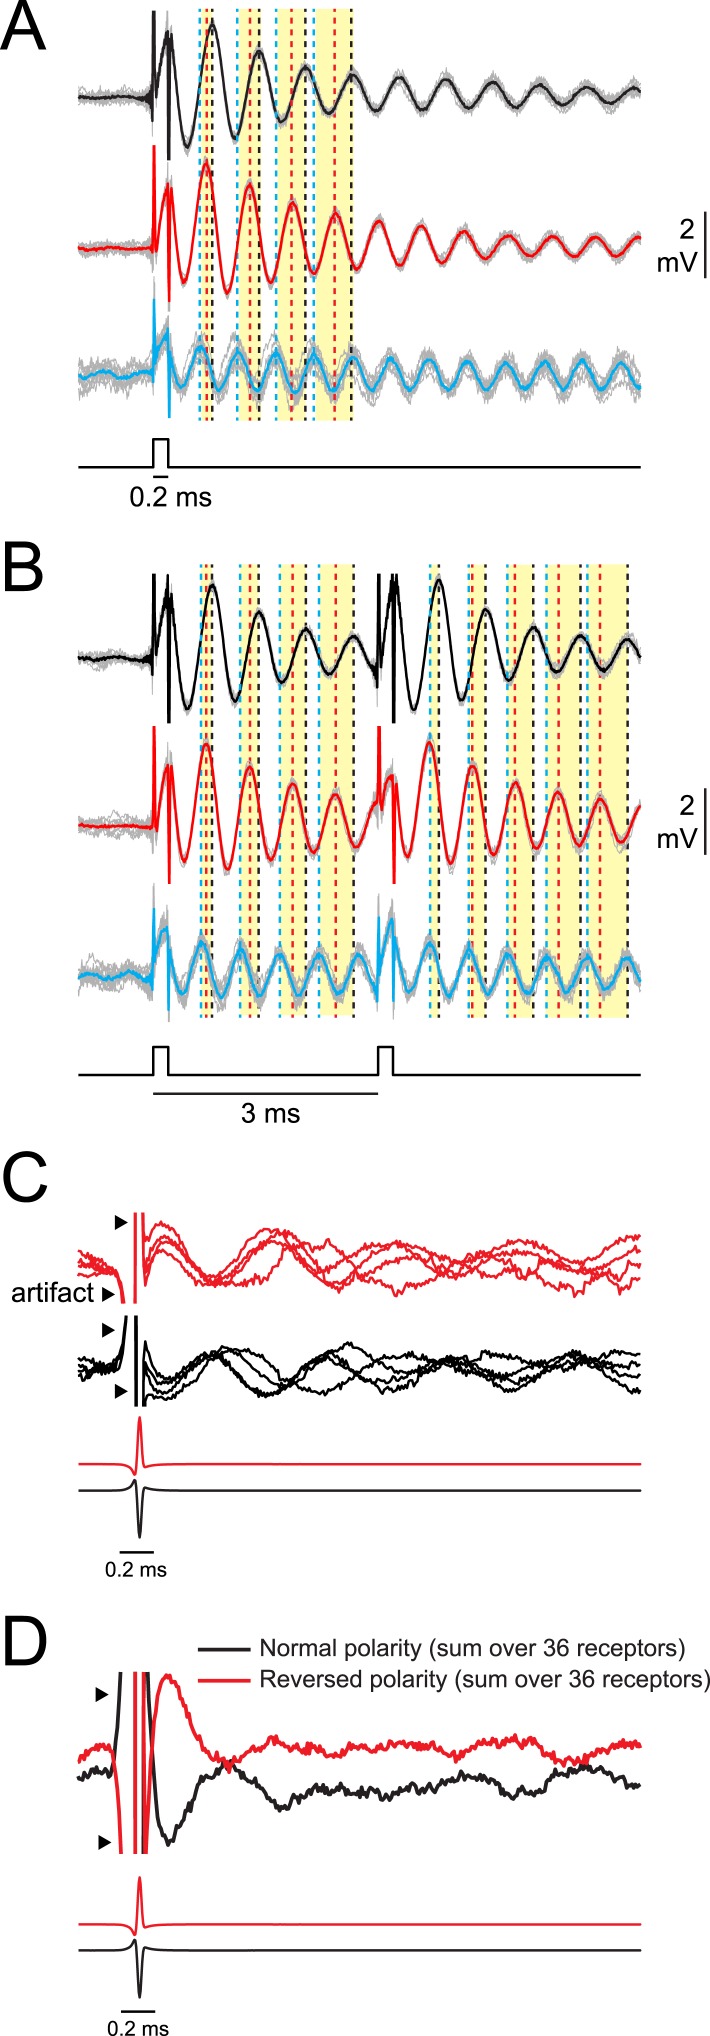
Figure 6. Synchrony across receptors is greatest for the first poststimulus oscillation and then rapidly declines.
(A) Responses of three oscillating receptors in P. tenuicauda to a single square pulse delivered in sequential recordings. Responses to each of 10 stimulus presentations are shown in gray and averages are shown in black, red, or blue. Dotted vertical lines in the corresponding color denote the times of the first four poststimulus oscillatory peaks. Yellow bars group the first, second, third, and fourth peaks from each receptor. Note how the peaks are transiently synchronized just after the stimulus, but become increasingly asynchronous with each subsequent cycle. (B) Same as A for responses of the same three receptors to a 3-ms IPI stimulus. Note the transient increase in synchrony across receptors just after both stimulus pulses. (C) A single recording trace from four receptors in the right augenrosette of one P. tenuicauda in response to a normal- (black) and reversed- (red) polarity conspecific EOD. Recording traces were normalized to the amplitude of the first poststimulus oscillation. (D) The sum of the normalized responses of all 36 receptors in the right augenrosette of one P. tenuicauda (illustrated in Figure 2B) to a normal- and reversed-polarity conspecific EOD (this includes the four traces shown in C as well as responses from the 32 additional receptors). The enhanced synchrony across receptors for the first poststimulus oscillatory peak results in the largest peak in the summed response just after the stimulus.

