

Abstract
Purpose
Inactivation of von Hippel-Lindau (VHL) gene in clear-cell renal cell carcinoma (RCC) leads to increased levels of hypoxia-inducible factors (HIFs) and overexpression of HIF target genes, such as vascular endothelial growth factor (VEGF) and others. VEGF-targeted agents are standard in advanced clear-cell RCC but biomarkers of activity are lacking.
Patients and Methods
We analyzed tumor tissue samples from metastatic clear-cell RCC patients who received pazopanib as part of clinical trial VEG102616. We evaluated several components of the VHL/HIF pathway: VHL gene inactivation (mutation and/or methylation), HIF1α and HIF2α immunohistochemistry staining, and HIF1α transcriptional signature. We evaluated the association of these biomarkers with best overall response rate and progression-free survival to pazopanib, a standard first-line VEGF-targeted agent.
Results
The VEG102616 trial enrolled 225 patients, from whom 78 samples were available for tumor DNA extraction. Of these, 70 patients had VHL mutation or methylation. VHL gene status did not correlate with overall response rate or progression-free survival. Similarly, HIF1α (65 samples) and HIF2α (66 samples) protein levels (high vs. low) did not correlate with overall response rate or progression-free survival to pazopanib. The HIF1α transcriptional signature (46 samples) was enriched in tumors expressing high HIF1α levels. However, the HIF1α gene expression signature was not associated with clinical outcome to pazopanib.
Conclusion
In patients with advanced clear-cell RCC, several potential biomarkers along the VHL/HIF1α/HIF2α axis were not found to be predictive for pazopanib activity. Additional efforts must continue to identify biomarkers associated with clinical outcome to VEGF-targeted agents in metastatic RCC.
Keywords: renal cell carcinoma, VEGF, HIF, VHL, biomarkers, pazopanib
Introduction
Approximately 64,000 new cases of kidney cancer are diagnosed each year in the United States and 25%-30% of these result in death (1). Renal cell carcinoma (RCC) is the most common subtype of kidney cancer and accounts approximately 80%-90% of cancers that arise in the renal parenchyma (2). Although surgery is potentially curative at early stages, distant recurrences remain common and 20%-30% of patients present with de novo metastatic disease.
Germline mutation in the von Hippel-Lindau (VHL) gene was first described in individuals with a hereditary syndrome who are predisposed to develop hemangioblastomas of the retina, cerebellum, or spinal cord, and visceral cysts of the kidney and pancreas, as well as a variety of solid tumors, including clear-cell RCC (ccRCC), pheochromocytomas, and pancreatic islet cell tumors (3, 4). Interestingly, somatic VHL mutations and chromosome 3p loss (VHL gene site locus) are found in the majority of sporadic ccRCC (5).
The VHL gene encodes the VHL protein (pVHL), which is a component of the ubiquitin-mediated proteolysis pathway that is important for degradation of many cellular proteins, including hypoxia-inducible factors (HIFs) (6). HIFs consist of two subunits (HIF1α and HIF2α) and induce the transcription of several genes that regulate angiogenesis and metabolism, such as vascular endothelial growth factor (VEGF) and platelet-derived growth factor (PDGF) (7-9). Thus, when VHL is inactivated, there is an upregulation of HIFs and deregulation of signaling pathways that influence metabolism, inflammation, and angiogenesis (10-12).
Elucidation of the function of the VHL tumor suppressor gene and other regulators of angiogenesis has led to important advances in the treatment of metastatic ccRCC (13). Agents that target the VEGF ligand or the VEGF tyrosine kinase receptors have been used in multiple settings in advanced RCC and yielded positive results from large, well-powered, randomized clinical trials that led to the approval of several agents in this disease (14). Approval was mainly based on a progression-free survival (PFS) benefit rather than on overall survival (OS). Unfortunately, no biomarkers are used in clinical practice to guide treatment decisions. Most of the time, the choice of a particular anti-VEGF therapy depends on the clinical setting (previously treated or untreated), the prognostic stratification (good/intermediate vs. poor), and the histology (clear-cell vs. non-clear-cell) (14, 15).
The biology underlying RCC with the central role of the VHL/HIF/VEGF axis sheds new light on potential molecular biomarkers to predict response to therapies that target angiogenesis. For example, Choueiri et al showed that certain mutations in the VHL gene may predict response (but not PFS or OS) to VEGF-targeted agents (16). Gordon and colleagues identified two subgroups of VHL-deficient tumors distinguished by HIF expression: one that expresses both HIF1α and HIF2α (H1H2) and another that expresses only HIF2α (H2) (7). In keeping with these findings, the authors speculated that H1H2 tumors may respond better to VEGF inhibitors than H2 tumors (7, 17).
Recently, Shen et al developed a HIF1α transcriptional signature based on transcriptional profiling of ccRCC cell lines expressing both HIF1α and HIF2α or HIF2α alone. However, whether this genomic profile correlates with the response to agents that target angiogenesis, such as VEGF-targeted therapy, remains unclear (18).
Pazopanib (Votrient®; GlaxoSmithKline, Philadelphia, PA), an oral, multikinase inhibitor of VEGF receptors (VEGFR)-1, -2, and -3, PDGF receptors (PDGFR)-α/β, and c-Kit, significantly prolonged PFS compared to placebo in patients with metastatic ccRCC who were treatment-naive or pretreated with cytokines (19). This agent was approved in the United States in 2009 and in Europe in 2010 and is considered category 1 by National Comprehensive Cancer Network (NCCN) for first-line therapy in metastatic RCC. Despite this important addition to the arsenal of RCC systemic therapeutics, the majority of patients fail to experience long-term durable tumor response to pazopanib, or to other currently approved anti-VEGF drugs (14). Using data from a randomized, prospective, clinical trial of pazopanib in advanced RCC, we thought to investigate whether several elements of the VHL/HIF pathway, including VHL gene status, HIF1/HIF2 protein expression, and the HIF1 gene signature described by Shen et al (18), could be associated with outcome to a specific angiogenesis inhibitor, pazopanib.
Materials and Methods
Patients
All patients provided written informed consent for participation in the clinical trial (VEG102616; NCT00244764). This study was conducted in accordance with the Declaration of Helsinki; protocols and informed consent forms were reviewed and approved by institutional review boards/independent ethics committees according to local guidelines. The patient characteristics have been described previously (9). All patients had metastatic ccRCC as a part of a randomized phase II discontinuation study; all patients received pazopanib (800 mg daily, orally) and those who had stable disease at week 12 were randomly assigned to pazopanib or placebo. This study was subsequently amended to an open-label pazopanib trial on the recommendation of the data monitoring committee, based on the favorable response rate observed in the first 60 enrolled patients (9).
Tumor Tissue Samples
Formalin-fixed paraffin-embedded (FFPE) archival tumor tissue samples were collected from 131 consenting patients (Supplementary Figure S1). Tumor samples (n=80) from patients consenting for DNA/RNA analysis underwent histopathology review, microdissection, and nucleic acid extraction. Due to quality and quantity of DNA and RNA isolated from FFPE tumor tissue samples, 78 (of 80) DNA samples qualified for VHL mutation and methylation analysis, and 46 RNA samples qualified for gene expression analysis. Tissue slides from 101 and 99 patients were available for HIF2α and HIF1α immunohistochemistry (IHC), respectively. These included both paraffin-dipped and non-paraffin-dipped slides.
DNA Extraction
DNA was extracted from ten 5μm-thick sections of paraffin-embedded tissue. Samples were microdissected to achieve a minimum of 90% tumor tissue and DNA was extracted according to a proprietary procedure of Response Genetics, Inc. (Los Angeles, CA). Extracted DNA was eluted in a 50μL final volume.
VHL Sequencing
Sequencing of VHL gene was performed by Genzyme Analytical Services (Westborough, MA). VHL exons were amplified by polymerase chain reaction (PCR) (Supplementary Table S1). Each reaction was performed with 5μL of isolated DNA for 40 cycles using 1 unit of HS DNA polymerase (Takara Bio Inc, Mountain View, CA). Exon 1 was amplified using three primer sets (A, B and C) generating three overlapping amplicons. Exons 2 and 3 were amplified using one primer set each.
Amplicons were sequenced using the BigDye® Terminator 1.1 sequencing kit (Applied Biosystems, Carlsbad, CA) and the ABI3130 xl Genetic Analyzer. Sequencing results were analyzed using CodonCode Aligner™ (CodonCode Corporation, Centerville, MA). All mutations identified by the software were subsequently examined and confirmed manually to validate deletions, insertions, and nucleotide changes.
VHL Methylation
Methylation status of the VHL promoter was assessed by methylation-specific PCR (MS-PCR) following DNA bisulphite treatment using the EZ DNA Methylation Kit™ (Zymo Research, Irvine, CA) according to the manufacturer’s instructions. The modified templates were amplified using methylated and unmethylated specific primers (Supplementary Table S2) and results visualized on a 10% polyacrylamide gel.
HIF1α and HIF2α Immunohistochemical Analysis
For HIF1α and HIF2α IHC, FFPE tissue sections were deparaffinized, rehydrated, and heated with a pressure cooker to 125°C for 30 seconds in citrate buffer for HIF1α, and in EDTA for HIF2α for antigen retrieval. After cooling to room temperature, sections were incubated in 3% hydrogen peroxide for 5 minutes to quench endogenous peroxidase (Dako, Carpinteria, CA). Sections were then incubated in avidin block for 15 minutes to quench endogenous avidin, followed by incubation in biotin block for 15 minutes to quench endogenous biotin (Vector, Burlingame, CA). The sections were then incubated with serum-free protein block for 10 minutes (Dako). The primary antibodies (anti-HIF1α antibody from Neomarkers, Cat #MS-1164-PABX, anti-HIF2α antibody, clone UP15 provided by Dr. William G. Kaelin at Dana-Farber Cancer Institute) were applied to sections for 1 hour at a 1:10,000 dilution for HIF1α and a 1:5000 dilution for HIF2α. For HIF1α, detection was performed using the CSA II kit (Dako) according to the manufacturer’s instructions. For HIF2α, detection was performed by incubation with Dako EnVision+ System HRP labeled polymer (Dako) for 30 minutes, followed by incubation with Biotin labeled tyramide (Perkin-Elmer, Waltham, MA) at a 1:50 dilution for 10 minutes, followed by incubation with LSAB2 Streptavidin-HRP (Dako) for 30 minutes. DAB chromogen (Dako, Cat # K3468) was then applied. Slides were slightly counterstained with hematoxylin. Formalin-fixed paraffin-embedded cells with high (786-O-vector) or low (786-O-VHL) HIF2α levels were utilized as positive and negative controls, respectively, to validate the specificity of the HIF2α immunoassay.
Immunostained slides were scanned using the ScanScope® System (Aperio Technologies Inc., Vista, CA). Digital slides were reviewed by a single expert kidney cancer pathologist who identified the tumor regions for analysis. Quantification was performed using a modified Aperio IHC nuclear image analysis algorithm that, for each slide, calculated the overall percentage of positive nuclei, the percentages of 0, 1+, 2+, and 3+ nuclei, and the average intensity score (0, 1+, 2+, and 3+). Results of image analysis were validated by the pathologist. Tumor samples with intensity score of 1+ were classified as low expressors, while samples with intensity scores of 2+ or 3+ were classified as high expressors.
HIF1α Transcriptional Signature
First, RNA was isolated from tumor samples at Response Genetics, Inc. (Los Angeles, CA) and microarray analysis was performed using the Affymetrix U133 Plus Array. Affymetrix data were normalized using the MAS5 algorithm. The relative expression status of 69 genes previously identified in the HIF1α transcriptional signature developed by Shen et al (18) was evaluated.
Statistical Analysis
The elements of the VHL/HIF pathway (VHL gene inactivation [mutation and/or methylation], HIF1α and HIF2α IHC staining, and HIF1α transcriptional signature) were correlated with clinical response and PFS. HIF expression was compared considering intensity score (lower intensity [1+] and higher intensity [2+, 3+]) and percentage of positively stained nuclei (lower percentage [1+] and higher percentage [2+, 3+]) with overall response rate (ORR; responder [complete response + partial response) and non-responder (progressive disease + stable disease]) and PFS. The ORR was assessed using RECIST 1.0 criteria. Baseline clinical characteristics (age, gender, risk category, and performance status) were compared among patients with available tissue for biomarker analysis versus those without available tissue, to ensure that patients with available biomarker data were representative of the rest of the trial population. Exact chi-square tests were used to assess the relationship between ORR and VHL, HIF1α and HIF2α expression. Patterns of expression among the mapped HIF1α transcriptional signature genes were assessed using multivariate analysis, and putative patterns were assessed for association with HIF1α gene expression levels using the Kruskal-Wallis test. Progression-free survival was estimated using Kaplan-Meier analysis. Gene set enrichment analysis (GSEA) was applied to determine if mapped HIF1α transcriptional signature genes were enriched for HIF1α gene expression. GSEA ranks genes in the signature based on association with class distinction, in this case low or high HIF1α relative to the median (20). GSEA calculates an enrichment score (ES) that reflects whether rankings are random or are overrepresented in patients expressing low or high HIF1α levels. High ES is indicative of enrichment. Statistical analyses were performed using SAS® 9.2 (SAS Institute, Cary, NC); GSEA analysis was conducted using programs provided (20). A p value <0.05 was considered statistically significant. The analysis includes only the samples for which reliable results were obtained.
Results
VHL Gene Status and Clinical Outcome
DNA was extracted from 78 available tumor samples. Overall, 68/78 patients (87%) had at least one VHL mutation and 8/69 patients (12%) showed promoter hypermethylation; 6 patients had both VHL mutation and methylation and 8 did not have either VHL mutation or methylation. All mutations were heterozygous. VHL mutation types included frameshifts (n=33, 48%), nonsense (n=6, 9%), deletion/insertion (n=3, 4%), splice junction (n=6, 9%), and missense (n=20, 29%). When examined in relation to clinical outcome, VHL mutation and/or methylation status did not correlate with either ORR (ORR 37.5% vs. 41.4% in patients with VHL [n=70] vs. without VHL gene inactivation [n=8], respectively; Table 1) or PFS (median PFS was 13.8 months vs. 17.4 months in patients with vs. without VHL gene inactivation, respectively; Figure 1).
Table 1.
VHL Gene Status and Overall Response Rate
| Response Category | Patients with VHL Gene Mutation or Methylation (n=70) | Patients with Wildtype VHL Gene (n=8) |
|---|---|---|
| Responder, n (%) | 29 (41.4) | 3 (37.5) |
|
| ||
| Non-responder, n (%) | 34 (48.5) | 4 (50) |
|
| ||
| Not evaluable, n (%) | 7 (10) | 1 (12.5) |
| p Value | 0.1673 | |
Figure 1.
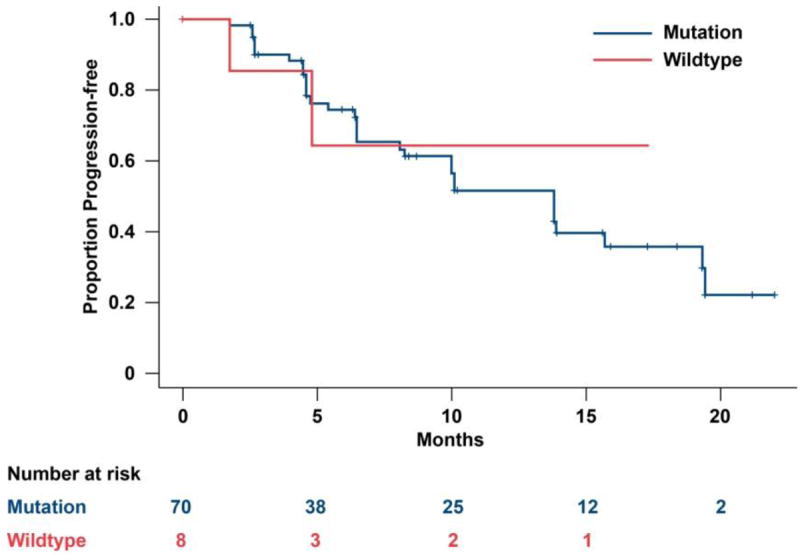
Progression-free survival by VHL status.
HIF2α Expression and Clinical Outcome
HIF2α staining was performed in available tumor samples (101/225). The analysis included 66 samples (65%) for which reliable IHC data were obtained. The reasons for excluding 35 samples were: low immunoreactivity (n=9), uneven staining (n=8), over-stained tissue (n=5), low quality section (n=10), or other (n=3). Among the 66 sample patients, 25 were classified as responders and 41 as non-responders. Intensity scores were 1+ for 27 patients, 2+ for 38 patients, and 3+ for 1 patient. The mean percentage (standard deviation) of positively stained nuclei was 30.8% (12.2) for score 1+, 59.8% (18.7) for score 2+, and 79.1% (not available; n=1) for score 3+. Notably, higher overall intensity score correlated with higher positively of stained nuclei cell (p<0.001).
The correlation between intensity score and ORR is described in Table 2. ORR among patients with HIF2α staining 1+ versus those staining 2+ and 3+ was not statistically different (p=0.36). Similarly, the mean percentage of positively stained nuclei was 40.5% for responders and 45.6% for non-responders, with no statistical difference (p=0.29)
Table 2.
Correlation Between HIF2α Intensity Score and Overall Response Rate
| IHC Intensity Analysis | |||
|---|---|---|---|
| Intensity Score | Response Status, n (%) | Total | |
| Non-Responder | Responder | ||
| 1+ | 15 (56) | 12 (44) | 27 |
| 2+ and 3+a | 26 (67) | 13 (33) | 39 |
| Total | 41 | 25 | 66 |
2+ and 3+ were combined because only 1 sample was 3+.
χ2-test p=0.36.
When we examined PFS among both groups with low and high HIF2α staining there was no statistically significant difference between the two groups (p=0.76; Figure 2A, B). The percentage of positively stained nuclei was also not correlated with PFS (p=0.75, not shown).
Figure 2.
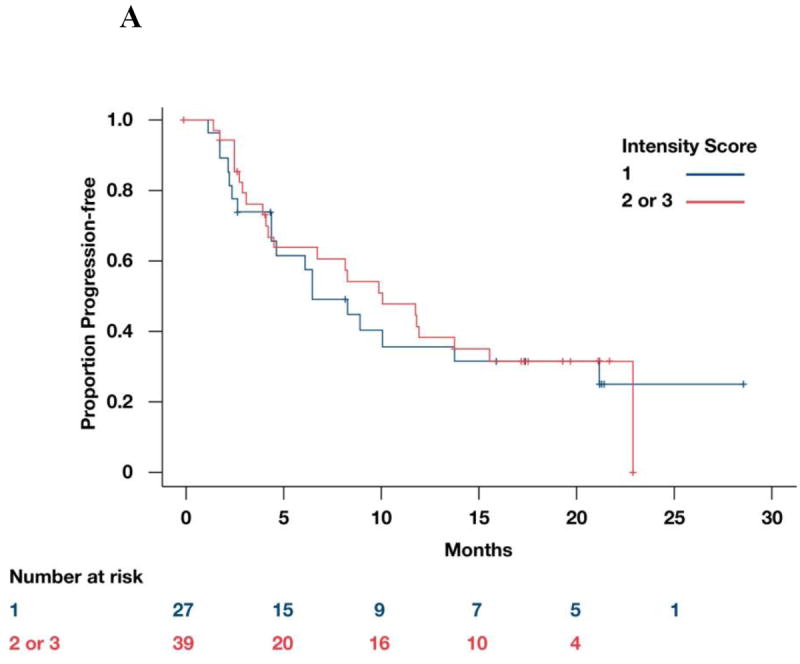

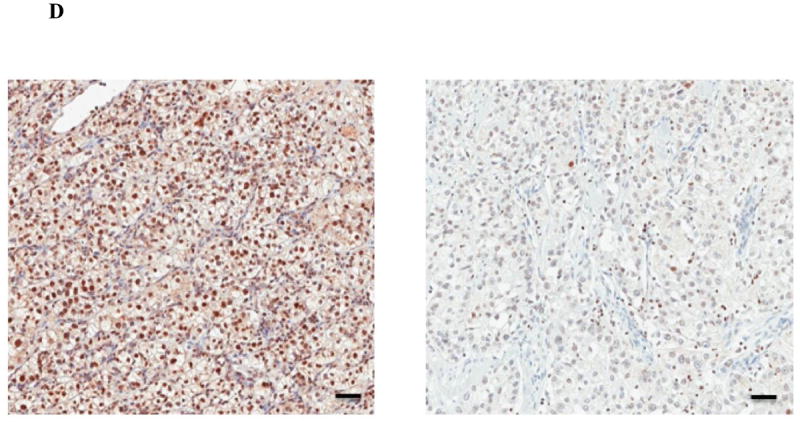
A: Correlation between HIF2α intensity score and PFS. B: Representative microscopic images of ccRCC samples immunostained for HIF2α showing either high (left panel) or low (right panel) protein levels. Scale bars = 50 microns. C: Correlation between HIF1α intensity score and PFS. D: Representative microscopic images of ccRCC samples immunostained for HIF1α showing either high (left panel) or low (right panel) protein levels. Scale bars = 50 microns.
HIF1α Expression and Clinical Outcome
HIF1α staining was performed in available tumor samples (99/225). Of these, 65 (65.6%) were included in the current analysis. Reasons for excluding 34 specimens were: very low immunoreactivity (n=11), uneven staining (n=6), over-stained tissue (n=4), low quality section (n=1), or other (n=12). Of these, 23 patients were classified as responders and 42 as non-responders. Intensity scores were 1+ for 17 patients and 2+ or 3+ for 48 patients. The mean percentage (standard deviation) of positively stained nuclei was 36.5% (16.099) for score 1+ and 57.6% (16.5) for both 2+ and 3+. Similar to HIF2α, the correlation between intensity and percent stain was statistically significant (p<0.001).
The correlation between intensity score and ORR is described in Table 3. There was no statistically significant difference between the two groups (p=0.13). Similarly, no statistically significant difference was found in terms of PFS between the higher intensity and the lower intensity scores (p=0.25; Figure 2C, D). The percentage of positively stained nuclei was also not correlated with PFS (p=0.6915, not shown).
Table 3.
Correlation Between HIF1α Intensity Score and Overall Response Rate
| IHC Intensity Analysis | |||
|---|---|---|---|
| Intensity Score | Response Status, n (%) | Total | |
| Non-Responder | Responder | ||
| 1+ | 8 (47.0) | 9 (52.9) | 17 |
| 2+ and 3+ | 34 (70.8) | 14 (29.1) | 48 |
| Total | 42 | 23 | 65 |
χ2-test p=0.13.
HIF1α Gene Signature and Clinical Outcome
Recently, a HIF1α transcriptional signature based on gene expression profiles from 10 VHL-inactivated RCC cell lines that either express or do not express HIF1α was reported (18). Of note, this signature was enriched in tumors that had not sustained 14q deletions encompassing HIF1 locus. To evaluate whether this genetic profile could be related to clinical outcome in metastatic ccRCC patients receiving pazopanib, we examined the 69 genes described in the HIF1α transcriptional signature by Shen et al (18) in patients enrolled in the VEG102616 trial.
RNA was available for 46/225 patients. Study results and baseline characteristics for this subset of patients were similar to the overall study. Forty-one patients had VHL heterozygous mutations and five patients were VHL wildtype. Sixty-four of 69 genes were mapped to the Affymetrix platform and HIF1α gene expression was detected in all 46 patients (Affymetrix statistical test [p<0.05]: median intensity=5330, minimum=1389, maximum=14067).
We performed a multivariate analysis that resulted in four possible gene expression clusters (Supplementary Figure S2). Each cluster was associated with a different level of HIF1α gene expression (p=0.0136, Kruskal-Wallis test, box plots; Figure 3A). GSEA analysis (Figure 3B) (18) provided additional evidence that patients expressing high HIF1α tend to be enriched for genes in the HIF1α transcriptional signature (p=0.064). However, clusters were not associated with ORR (p=0.7455) or PFS (p=0.6058) in patients receiving pazopanib.
Figure 3.
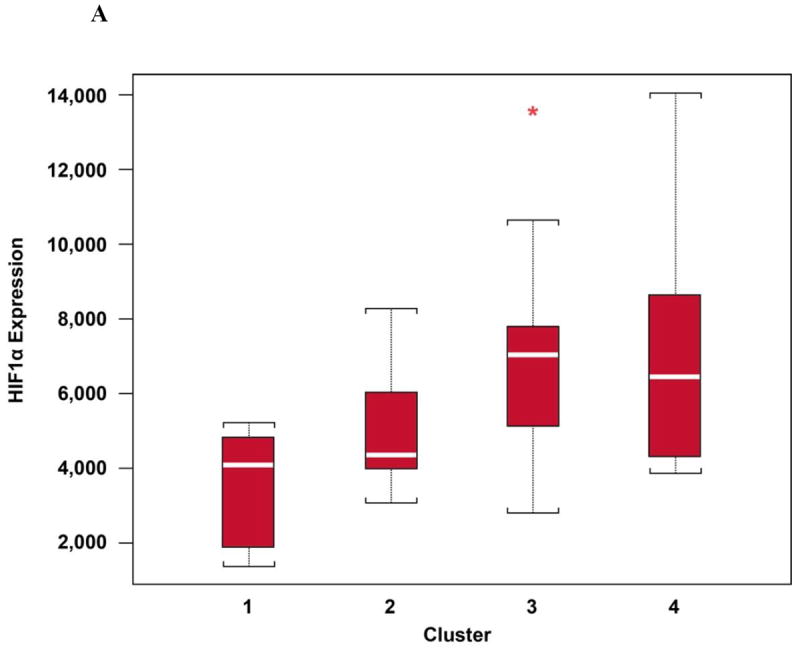
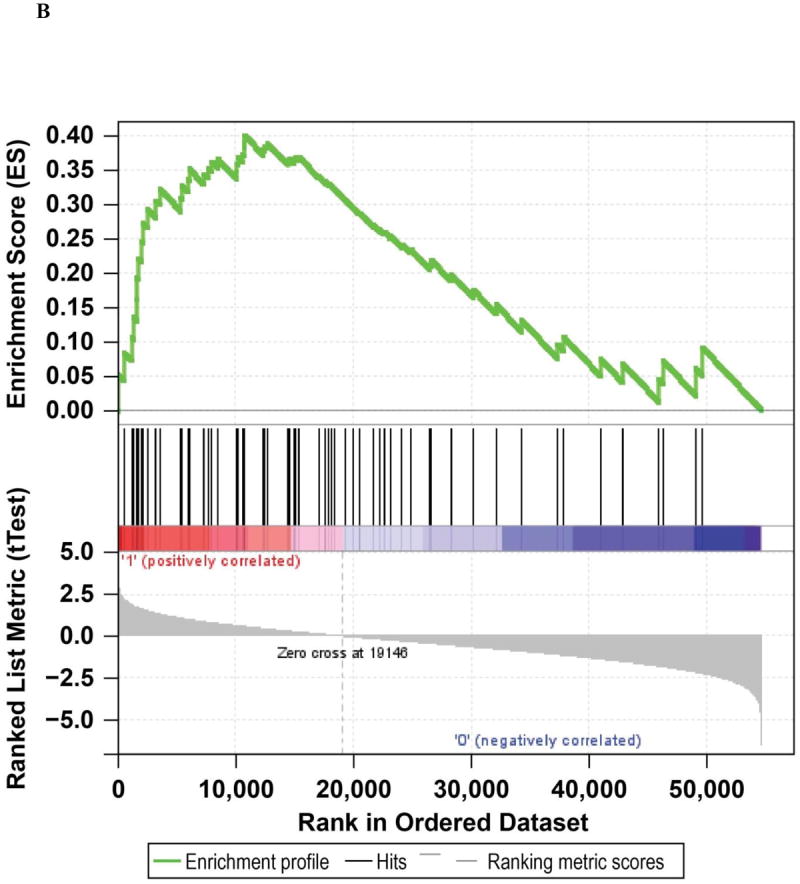
A: HIF1α mRNA levels per cluster. *Represents an outlier. B: Gene set enrichment analysis of the Shen (18) HIF1α transcriptional signature for tumors with high vs low HIF1α transcript levels.
Discussion
Recently, VEGF-targeted therapies showed significant improvements in metastatic RCC treatment (14). The establishment of biomarkers may help in understanding the biology underlying RCC and the therapies that target the VEGF axis. Significant efforts have been undertaken thus far to discover useful and clinically relevant biomarkers to customize therapy in metastatic RCC patients, but at this time no biomarkers are ready for routine clinical use.
In this study, we explored several elements of the VHL/HIF/VEGF axis along the same molecular pathways that could be associated with pazopanib activity. Unfortunately, we were not able to show a correlation between several tested biomarkers and defined clinical endpoints: ORR or PFS. One large retrospective study looked at 123 patients treated with various VEGF-targeted agents, and while ORR was significantly higher (52% vs. 31%) in patients with “severe/loss of function” mutations (eg, frameshift, stop, deletions), PFS and OS did not differ based on VHL gene status. In the current prospective study, VHL mutation and methylation status did not correlate with either ORR or PFS. Again, the presence of the wildtype allele did not preclude response to pazopanib. It is interesting to note the high prevalence of VHL mutations in the 78 patients tested. Several studies, including a recent study (21), suggest a prevalence of VHL mutations varying from 27% to 55%. Nevertheless, few studies showed >80% VHL mutations in tested RCC specimens. This difference may be thought largely due to differences in sequencing technologies, as highlighted in the paper by Nickerson et al (22).
A high proportion of RCC is characterized by deregulation of the VHL-HIF pathway and overexpression of HIF1α, HIF2α, or both. These genes have some overlapping effects on angiogenesis, but they also exhibit opposing properties. VHL-defective tumors can be divided into two subgroups regarding HIF expression, with one subtype expressing both HIF1α and HIF2α (H1H2) and another only HIF2α (H2) (7, 23). HIF1α antagonizes c-myc activity and suppresses tumor formation in renal cells. On the other hand, overproduction of HIF2α promotes cell proliferation by activation of c-myc (7). Another difference is that HIF1α, but not HIF2α, remains susceptible to ubiquitination, suggesting an alternative pathway not dependent of pVHL (17). More evidence is accumulating to suggest that HIF2α, rather than HIF1α, promotes RCC carcinogenesis (11, 12). In contrast, overproduction of HIF1α is believed to suppress tumor growth (3, 18, 24). In addition, HIF1α and HIF2α regulate each other. Overexpression of HIF1α strikingly downregulates HIF2α and vice-versa (25). These findings suggest that the subtypes may have different clinical outcomes and possibly different responses to VEGF-targeted agents. To that end, HIF1α has been correlated with prognosis in other cancer subtypes (26). Birner et al reported HIF1α as a marker for tumor progression in cervical cancer (27). Relevant to RCC, Patel et al (28) evaluated 43 metastatic RCC patients who received sunitinib. Pre-treatment HIF levels by Western blot analysis were associated with response to sunitinib in this small subset of patients. The final report from this small study is eagerly awaited. During the last 2012 American Society of Clinical Oncology (ASCO) meeting, Hudes et al presented an evaluation of 75 tumor samples from pazopanib-treated patients. Loss of chromosome 14 or 14q- (HIF1α locus) was not correlated with PFS or clinical response to pazopanib. This was an important hypothesis-driven study, as prior work showed that HIF1α activity is diminished in 14q-deleted kidney cancers (29). At the same meeting, a preliminary study by Saez et al showed that HIF1α and HIF2α staining intensity >10% represented an independent predictive factor of outcome (PFS and OS) for VEGFR tyrosine kinase inhibitor therapy in 71 patients with metastatic RCC. That study used different antibodies against HIF1 and HIF2 than our study. In the Saez study, VHL mutation was not correlated with outcome, and HIF1α expression was associated with a response (30).
In our study, 73.8% of the samples expressed HIF1α intensity score 2+ or 3+. In the same way, 59% of tumors expressed HIF2α in higher levels. Interestingly, we identified a higher expression of HIF1α than HIF2α. Nevertheless, the level of expression of HIF1α and HIF2α was not associated with clinical response to pazopanib.
The genomic profile observed among 46 tumor sample available for DNA analysis from the prospective RCC study of pazopanib was consistent with the cell-line-derived HIF1α transcriptional signature proposed by Shen et al (18). A multivariate analysis identified four different patterns of HIF1α gene expression. While we externally validated the Shen data, neither patterns nor HIF1α expressions were associated with clinical outcome in this small subset of patients. Despite these genes having been considered key players in RCC pathogenesis, they were not able to select patients who will or will not benefit from pazopanib.
Our study has several limitations. Although the patients were part of a well-conducted clinical trial with a single agent, in contrast to other studies (16), the sample size for each tested biomarker was small. We had 78 patients tested for VHL gene status, ~100 patients for HIF1 or HIF2, and 46 patients for HIF1 gene signature. The study population was somewhat selected, with potential unmeasured clinical differences, despite that the fact that some baseline characteristics such as age, gender, and Memorial Sloan-Kettering Cancer Center risk groups were similar and balanced.
Another limitation is the variable quality of the tissue sections utilized for IHC analysis. It is well recognized that tissue specimen collection, processing, and storage procedures (ie, pre-analytical variables) can profoundly impact the result of biomarker analyses in FFPE tissues (31-33). For instance, we have previously shown that HIF2α immunoreactivity is significantly affected by the long-term storage of tissue slides (34). The tissue slides used in this study were preserved under two different conditions (ie, paraffin-dipped and non-paraffin-dipped) and this might have influenced tissue immunogenicity and thus study results. Indeed, when we compared the percent of HIF2α-positive cells in the paraffin-dipped versus non-paraffin-dipped sample cohorts, HIF2α positivity was significantly lower in the samples not protected by paraffin during the storage period (Supplementary Figure S3). Although standardization of procedures for tissue sample acquisition, storage, and analysis are undoubtedly difficult to achieve, especially in the context of multi-institutional clinical trials, major efforts should be directed towards this goal in the future. Pathologist involvement in clinical trial design will be essential in this endeavor.
In summary, targeted therapies are the standard in advanced RCC. Several elements of the VHL/HIF pathway have been extensively correlated with RCC tumorigenesis. In this study, the expression levels of HIF1α and HIF2α were not predictive for a single anti-VEGF therapy response and the role of these proteins as biomarkers to clinical outcomes remain unclear. Although several agents have prolonged PFS, they did not lead to cure. Thus, efforts to identify relevant predictors of treatment response and develop new drugs are critical for long-term survival of patients with RCC.
Supplementary Material
Translational Relevance.
Elucidation of the function of the VHL tumor suppressor gene and other regulators of angiogenesis, such as hypoxia-inducible factors (HIFs) and its downstream target, vascular endothelial growth factor (VEGF), has led to important advances in the treatment of metastatic renal cell carcinoma (RCC). In the past few years, VEGF-targeted therapies became the standard in metastatic RCC treatment, showing significant improvements in clinical outcomes. An important challenge facing targeted therapies includes the selection of patients who are most likely to have clinical benefit. As a consequence, the establishment of biomarkers may help in understanding the biology underlying RCC and predicting response to therapies that target angiogenesis. In this article we evaluated several potential biomarkers along the VHL/HIF1α/HIF2α axis to predict response and clinical outcomes to pazopanib, an oral, multikinase inhibitor of VEGF receptors.
Acknowledgments
We thank all patients and their families for their contributions to this study. We also thank all the physicians, scientists, and local operation leads who helped to make this study possible. Medical editorial assistance was provided by Jerome F. Sah, PhD, at ProEd Communications, Inc., Beachwood, Ohio.
Grant Support
This work was supported in part by the GlaxoSmithKline Pharmaceuticals, Philadelphia, Pennsylvania.
Footnotes
Conflict of interest: Bahamon, Brown, Fay, Lin, and Rosenberg report no potential conflict of interest. Choueiri has received a research grant from Pfizer and consultant/advisor compensation (no Speakers Bureau honoraria) from AVEO, Pfizer, Novartis, GlaxoSmithKline, Genentech, and Bayer/Onyx. Hutson has received Speakers Bureau honoraria and consultant/advisor compensation from GlaxoSmithKline, Pfizer, Novartis, and AVEO. Signoretti has a service contract with GlaxoSmithKline for immunohistochemistry analyses and has received advisor compensation from GlaxoSmithKline. Carpenter, Gagnon, Liu, Baker-Neblett, and Pandite are GlaxoSmithKline employees (Baker-Neblett and Pandite also report stock in GlaxoSmithKline).
Clinical trial registration: NCT00244764 [http://clinicaltrials.gov/show/NCT00244764]
References
- 1.National Cancer Institute. [2012 November 6];Surveillance epidemiology and end results (SEER) Available from: http://seer.cancer.gov/statfacts/html/kidrp.html.
- 2.Choueiri TK. Renal cell carcinoma. Hematol Oncol Clin North Am. 2011;25:xiii–xiv. doi: 10.1016/j.hoc.2011.06.001. [DOI] [PubMed] [Google Scholar]
- 3.Kaelin WG., Jr The von Hippel-Lindau tumor suppressor protein: an update. Methods Enzymol. 2007;435:371–83. doi: 10.1016/S0076-6879(07)35019-2. [DOI] [PubMed] [Google Scholar]
- 4.Latif F, Tory K, Gnarra J, Yao M, Duh FM, Orcutt ML, et al. Identification of the von Hippel-Lindau disease tumor suppressor gene. Science. 1993;260:1317–20. doi: 10.1126/science.8493574. [DOI] [PubMed] [Google Scholar]
- 5.Beroukhim R, Brunet JP, Di Napoli A, Mertz KD, Seeley A, Pires MM, et al. Patterns of gene expression and copy-number alterations in von-Hippel Lindau disease-associated and sporadic clear cell carcinoma of the kidney. Cancer Res. 2009;69:4674–81. doi: 10.1158/0008-5472.CAN-09-0146. [DOI] [PMC free article] [PubMed] [Google Scholar]
- 6.Farber LJ, Furge K, Teh BT. Renal cell carcinoma deep sequencing: recent developments. Curr Oncol Rep. 2012;14:240–8. doi: 10.1007/s11912-012-0230-3. [DOI] [PubMed] [Google Scholar]
- 7.Gordan JD, Lal P, Dondeti VR, Letrero R, Parekh KN, Oquendo CE, et al. HIF-alpha effects on c-Myc distinguish two subtypes of sporadic VHL-deficient clear cell renal carcinoma. Cancer Cell. 2008;14:435–46. doi: 10.1016/j.ccr.2008.10.016. [DOI] [PMC free article] [PubMed] [Google Scholar]
- 8.Toschi A, Lee E, Gadir N, Ohh M, Foster DA. Differential dependence of hypoxia-inducible factors 1 alpha and 2 alpha on mTORC1 and mTORC2. J Biol Chem. 2008;283:34495–9. doi: 10.1074/jbc.C800170200. [DOI] [PMC free article] [PubMed] [Google Scholar]
- 9.Hutson TE, Davis ID, Machiels JP, De Souza PL, Rottey S, Hong BF, et al. Efficacy and safety of pazopanib in patients with metastatic renal cell carcinoma. J Clin Oncol. 2010;28:475–80. doi: 10.1200/JCO.2008.21.6994. [DOI] [PubMed] [Google Scholar]
- 10.Krieg M, Haas R, Brauch H, Acker T, Flamme I, Plate KH. Up-regulation of hypoxia-inducible factors HIF-1alpha and HIF-2alpha under normoxic conditions in renal carcinoma cells by von Hippel-Lindau tumor suppressor gene loss of function. Oncogene. 2000;19:5435–43. doi: 10.1038/sj.onc.1203938. [DOI] [PubMed] [Google Scholar]
- 11.Kaelin WG, Jr, Ratcliffe PJ. Oxygen sensing by metazoans: the central role of the HIF hydroxylase pathway. Mol Cell. 2008;30:393–402. doi: 10.1016/j.molcel.2008.04.009. [DOI] [PubMed] [Google Scholar]
- 12.Li L, Kaelin WG. Renal Cell Cancer. Number 4. Vol. 25. Philadelphia: Hematology/Oncology Clinics of North America; 2011. New insights into the biology of renal cell carcinoma; pp. 667–86. [DOI] [PMC free article] [PubMed] [Google Scholar]
- 13.Heng DYC, Choueiri TK. The Evolving Landscape of Metastatic Renal Cell Carcinoma. [2012 November 15];2012 ASCO Educational Book. doi: 10.14694/EdBook_AM.2012.32.25. Available from: http://www.asco.org/ASCOv2/Home/Education%20&%20Training/Educational%20Book/PDF%20Files/2012/zds00112000299.PDF. [DOI] [PubMed]
- 14.Courtney KD, Choueiri TK. Updates on novel therapies for metastatic renal cell carcinoma. Ther Adv Med Oncol. 2010;2:209–19. doi: 10.1177/1758834010361470. [DOI] [PMC free article] [PubMed] [Google Scholar]
- 15.Motzer RJ, Agarwal N, Beard C, Bhayani S, Bolger GB, Buyyounouski MK, et al. NCCN Clinical Practice Guidelines in Oncology Kidney Cancer. [2012 November 28];NCCN Guidelines. Available from: http://www.nccn.org/professionals/physician_gls/pdf/kidney.pdf.
- 16.Choueiri TK, Vaziri SA, Jaeger E, Elson P, Wood L, Bhalla IP, et al. von Hippel-Lindau gene status and response to vascular endothelial growth factor targeted therapy for metastatic clear cell renal cell carcinoma. J Urol. 2008;180:860–5. doi: 10.1016/j.juro.2008.05.015. discussion 5-6. [DOI] [PubMed] [Google Scholar]
- 17.Kaelin WG., Jr Kidney cancer: now available in a new flavor. Cancer Cell. 2008;14:423–4. doi: 10.1016/j.ccr.2008.11.005. [DOI] [PubMed] [Google Scholar]
- 18.Shen C, Beroukhim R, Schumacher SE, Zhou J, Chang M, Signoretti S, et al. Genetic and functional studies implicate HIF1alpha as a 14q kidney cancer suppressor gene. Cancer Discov. 2011;1:222–35. doi: 10.1158/2159-8290.CD-11-0098. [DOI] [PMC free article] [PubMed] [Google Scholar]
- 19.Sternberg CN, Davis ID, Mardiak J, Szczylik C, Lee E, Wagstaff J, et al. Pazopanib in locally advanced or metastatic renal cell carcinoma: results of a randomized phase III trial. J Clin Oncol. 2010;28:1061–8. doi: 10.1200/JCO.2009.23.9764. [DOI] [PubMed] [Google Scholar]
- 20.Subramanian A, Tamayo P, Mootha VK, Mukherjee S, Ebert BL, Gillette MA, et al. Gene set enrichment analysis: a knowledge-based approach for interpreting genome-wide expression profiles. Proc Natl Acad Sci U S A. 2005;102:15545–50. doi: 10.1073/pnas.0506580102. [DOI] [PMC free article] [PubMed] [Google Scholar]
- 21.Guo G, Gui Y, Gao S, Tang A, Hu X, Huang Y, et al. Frequent mutations of genes encoding ubiquitin-mediated proteolysis pathway components in clear cell renal cell carcinoma. Nat Genet. 2011;44:17–9. doi: 10.1038/ng.1014. [DOI] [PubMed] [Google Scholar]
- 22.Nickerson ML, Jaeger E, Shi Y, Durocher JA, Mahurkar S, Zaridze D, et al. Improved identification of von Hippel-Lindau gene alterations in clear cell renal tumors. Clin Cancer Res. 2008;14:4726–34. doi: 10.1158/1078-0432.CCR-07-4921. [DOI] [PMC free article] [PubMed] [Google Scholar]
- 23.Dondeti VR, Wubbenhorst B, Lal P, Gordan JD, D’Andrea K, Attiyeh EF, et al. Integrative genomic analyses of sporadic clear cell renal cell carcinoma define disease subtypes and potential new therapeutic targets. Cancer Res. 2012;72:112–21. doi: 10.1158/0008-5472.CAN-11-1698. [DOI] [PMC free article] [PubMed] [Google Scholar]
- 24.Biswas S, Troy H, Leek R, Chung YL, Li JL, Raval RR, et al. Effects of HIF-1alpha and HIF2alpha on Growth and Metabolism of Clear-Cell Renal Cell Carcinoma 786-0 Xenografts. J Oncol. 2010;2010:757908. doi: 10.1155/2010/. [DOI] [PMC free article] [PubMed] [Google Scholar]
- 25.Raval RR, Lau KW, Tran MG, Sowter HM, Mandriota SJ, Li JL, et al. Contrasting properties of hypoxia-inducible factor 1 (HIF-1) and HIF-2 in von Hippel-Lindau-associated renal cell carcinoma. Mol Cell Biol. 2005;25:5675–86. doi: 10.1128/MCB.25.13.5675-5686.2005. [DOI] [PMC free article] [PubMed] [Google Scholar]
- 26.Vleugel MM, Greijer AE, Shvarts A, van der Groep P, van Berkel M, Aarbodem Y, et al. Differential prognostic impact of hypoxia induced and diffuse HIF-1alpha expression in invasive breast cancer. J Clin Pathol. 2005;58:172–7. doi: 10.1136/jcp.2004.019885. [DOI] [PMC free article] [PubMed] [Google Scholar]
- 27.Birner P, Schindl M, Obermair A, Plank C, Breitenecker G, Oberhuber G. Overexpression of hypoxia-inducible factor 1alpha is a marker for an unfavorable prognosis in early-stage invasive cervical cancer. Cancer Res. 2000;60:4693–6. [PubMed] [Google Scholar]
- 28.Patel PH, Chadalavada RS, Ishill NM, Patil S, Reuter VE, Motzer RJ, et al. Hypoxia-inducible factor (HIF) 1α and 2α levels in cell lines and human tumor predicts response to sunitinib in renal cell carcinoma (RCC). J Clin Oncol; presented at 2008 ASCO Annual Meeting; 2008. abstract 5008. [Google Scholar]
- 29.Hudes GR, Pei J, Liu Y, Gagnon RC, Carpenter C, Pandite L, et al. Correlation of chromosome (Chr) 14 loss and 5q gain with outcomes of pazopanib treatment in patients (pts) with metastatic clear cell renal cell carcinoma (mRCC) J Clin Oncol. 2012;30(supp) abstract 4605. [Google Scholar]
- 30.Saez MI, Perez JMT, Perez-Rivas LG, Perez-Villa L, Villatoro R, Montesa A, et al. Hypoxia-inducible factor (HIF) 1α and 2α as predictive markers of outcome to VEGFR tyrosine kinase inhibitors (TKI) in renal cell carcinoma (RCC) J Clin Oncol. 2012;30(suppl) abstract 4630. [Google Scholar]
- 31.Engel KB, Moore HM. Effects of preanalytical variables on the detection of proteins by immunohistochemistry in formalin-fixed, paraffin-embedded tissue. Arch Pathol Lab Med. 2011;135:537–43. doi: 10.5858/2010-0702-RAIR.1. [DOI] [PubMed] [Google Scholar]
- 32.Di Napoli A, Signoretti S. Tissue biomarkers in renal cell carcinoma: issues and solutions. Cancer. 2009;115:2290–7. doi: 10.1002/cncr.24233. [DOI] [PMC free article] [PubMed] [Google Scholar]
- 33.Signoretti S, Bratslavsky G, Waldman FM, Reuter VE, Haaga J, Merino M, et al. Tissue-based research in kidney cancer: current challenges and future directions. Clin Cancer Res. 2008;14:3699–705. doi: 10.1158/1078-0432.CCR-07-4733. [DOI] [PMC free article] [PubMed] [Google Scholar]
- 34.Bahamon B, Signoretti S. Tissue Biomarkers in Renal Cell Carcinoma: Intermediate Endpoints in the Selection of Targeted Agents for RCC. In: Figlin RA, Rathmell WK, Rini BI, editors. Renal Cell Carcinoma. Springer; US: 2012. pp. 69–89. [Google Scholar]
Associated Data
This section collects any data citations, data availability statements, or supplementary materials included in this article.