Significance
Cancers require high amounts of glucose to grow and survive, and dogma is that uptake is facilitated by passive glucose transporters (GLUTs). We have identified a new mechanism to import glucose into pancreatic and prostate cancer cells, namely active glucose transport mediated by sodium-dependent glucose transporters (SGLTs). This means that the specific radioactive imaging probe for SGLTs, α-methyl-4-deoxy-4-[18F]fluoro-d-glucopyranoside, may be used along with positron-emission tomography to diagnose and stage pancreatic and prostate cancers, tumors in which the GLUT probe 2-[18F]fluoro-2-deoxy-d-glucose has questionable utility. Moreover, we suggest, based on our results in mouse models, that Food and Drug Administration-approved SGLT2 inhibitors may be used to reduce the viability of pancreatic and prostate cancer cells in patients.
Keywords: SGLT2, pancreatic cancer, prostate cancer, SGLT2-inhibitors
Abstract
Glucose is a major metabolic substrate required for cancer cell survival and growth. It is mainly imported into cells by facilitated glucose transporters (GLUTs). Here we demonstrate the importance of another glucose import system, the sodium-dependent glucose transporters (SGLTs), in pancreatic and prostate adenocarcinomas, and investigate their role in cancer cell survival. Three experimental approaches were used: (i) immunohistochemical mapping of SGLT1 and SGLT2 distribution in tumors; (ii) measurement of glucose uptake in fresh isolated tumors using an SGLT-specific radioactive glucose analog, α-methyl-4-deoxy-4-[18F]fluoro-d-glucopyranoside (Me4FDG), which is not transported by GLUTs; and (iii) measurement of in vivo SGLT activity in mouse models of pancreatic and prostate cancer using Me4FDG-PET imaging. We found that SGLT2 is functionally expressed in pancreatic and prostate adenocarcinomas, and provide evidence that SGLT2 inhibitors block glucose uptake and reduce tumor growth and survival in a xenograft model of pancreatic cancer. We suggest that Me4FDG-PET imaging may be used to diagnose and stage pancreatic and prostate cancers, and that SGLT2 inhibitors, currently in use for treating diabetes, may be useful for cancer therapy.
Pancreatic cancer is the fourth-leading cause of cancer-related death in the United States (behind only lung, colon, and breast cancers), with 46,420 estimated new cases in 2014 and a mortality that almost equals incidence (39,590 estimated deaths in 2014); the overall 5-y survival rate is only 7% (seer.cancer.gov/statfacts/html/pancreas.html). Prostate cancer is the most frequent cancer in men in the United States, with 233,000 estimated new cases in 2014. Despite widespread adoption of screening programs, prostate cancer is still the second-leading cause of cancer-related death in men, second only to lung cancer (seer.cancer.gov/statfacts/html/prost.html). New therapies are urgently needed to reduce deaths from these two cancers, and much effort has focused on the altered metabolism of tumor cells (1–3).
Since the pioneering studies by Warburg, it has been established that tumors have increased demand for glucose to fuel ATP synthesis by aerobic glycolysis (4–7). A well-known mechanism of glucose uptake into cells is facilitative diffusion mediated by glucose transporters (GLUTs) (8). The overexpression of GLUT1 is well-documented in cancer (7), and is the basis of the clinical detection and staging of tumors by positron-emission tomography (PET) using 2-deoxy-2-[18F]fluoro-d-glucose (2FDG) (9–12). However, 2FDG-PET does not reliably detect pancreatic and prostate cancers, and its use for diagnosis and staging is not currently recommended in clinical practice (13–16). This led us to hypothesize that another class of glucose importers not detected by 2FDG, the sodium-dependent glucose transporters (SGLTs), could contribute to glucose utilization by these cancers.
SGLTs are transporters belonging to the SLC5A gene family, which harness the gradient of sodium ions across the plasma membrane to drive glucose and other nutrients into cells (17, 18). The most studied family members are SGLT1 and SGLT2, which are involved in glucose transport in the intestine and kidneys as well as in specialized regions of the brain (19, 20). SGLT1 protein has been reported to be expressed in prostate cancers, but its functional role is uncertain because it is restricted to the cell nucleus in malignant ducts (21).
In this work, we demonstrate the expression of SGLT2 in human pancreatic and prostate cancers by immunohistochemistry (IHC) and their functional activity by transport assays on fresh surgical specimens with the SGLT-specific tracer α-methyl-4-deoxy-4-[18F]fluoro-d-glucopyranoside (Me4FDG). We also examined the possibility of imaging pancreatic and prostate cancers by Me4FDG-PET in mouse xenograft models. Furthermore, we conducted preliminary determinations of the importance of SGLT2 in tumor growth and survival using a mouse xenograft model of pancreatic cancer treated with specific SGLT2 inhibitors. The results of these investigations open the possibility of coupling an SGLT-specific imaging tool (Me4FDG-PET) with an SGLT2-mediated therapeutic intervention to optimize the selection of cancer patients most likely to benefit from therapy with SGLT2 drugs.
Results
SGLT1 and SGLT2 Are Expressed in Pancreatic and Prostate Cancers.
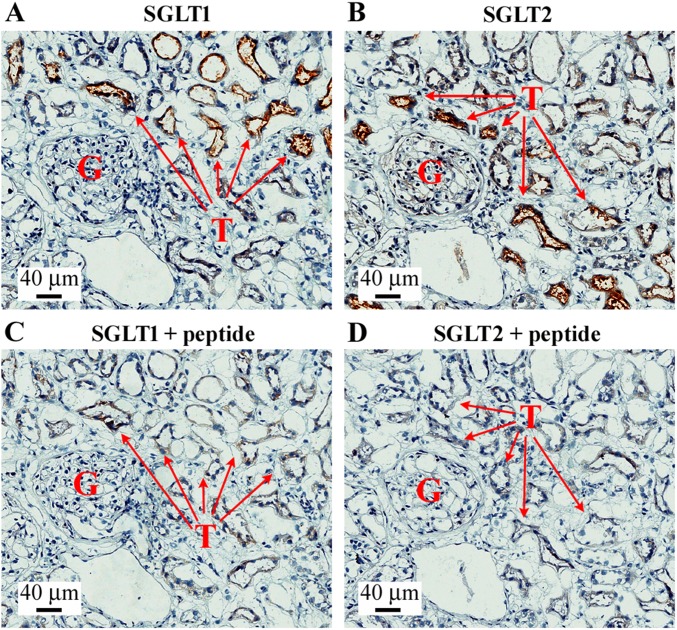
Pancreatic and prostate cancer and human kidney cortex sections were obtained from the University of California at Los Angeles (UCLA) Pathology Tissue Procurement Core Laboratory for immunohistochemical analysis of SGLT1 and SGLT2 expression. The specific antibodies used were produced in our laboratories and validated by Western blot and immunohistochemistry (19, 20, 22). As part of this study, we also confirmed the specificity of the antibodies by IHC on human kidney cortex, known to express both SGLT1 and SGLT2 (Fig. S1 and figure 4 in ref. 22).
Fig. S1.
Validation of SGLT1 and SGLT2 antibodies in human kidney. The figure shows a representative image of immunohistochemistry with SGLT1 and SGLT2 antibodies and the respective negative controls obtained preincubating the antibody with the antigenic peptides. (A) SGLT1 staining. (B) SGLT2 staining. (C) SGLT1 + peptide negative control. (D) SGLT2 + peptide negative control. The figures show the presence of a glomerulus (indicated by G) and expression of SGLT1 and SGLT2 in kidney proximal tubules (indicated by T).
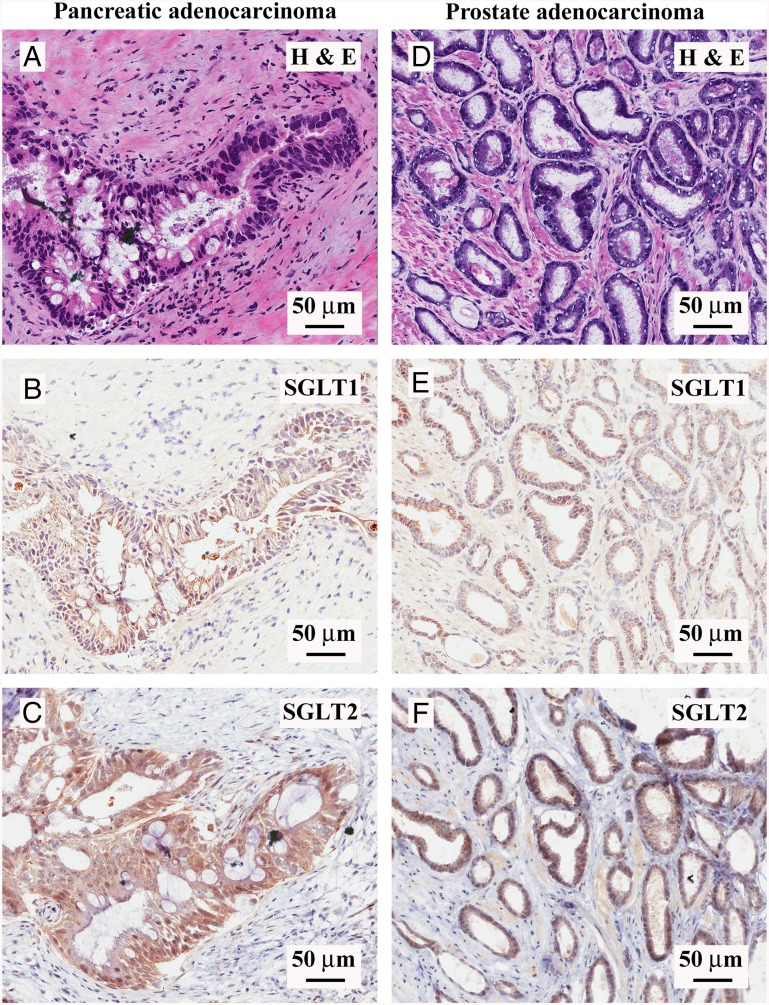
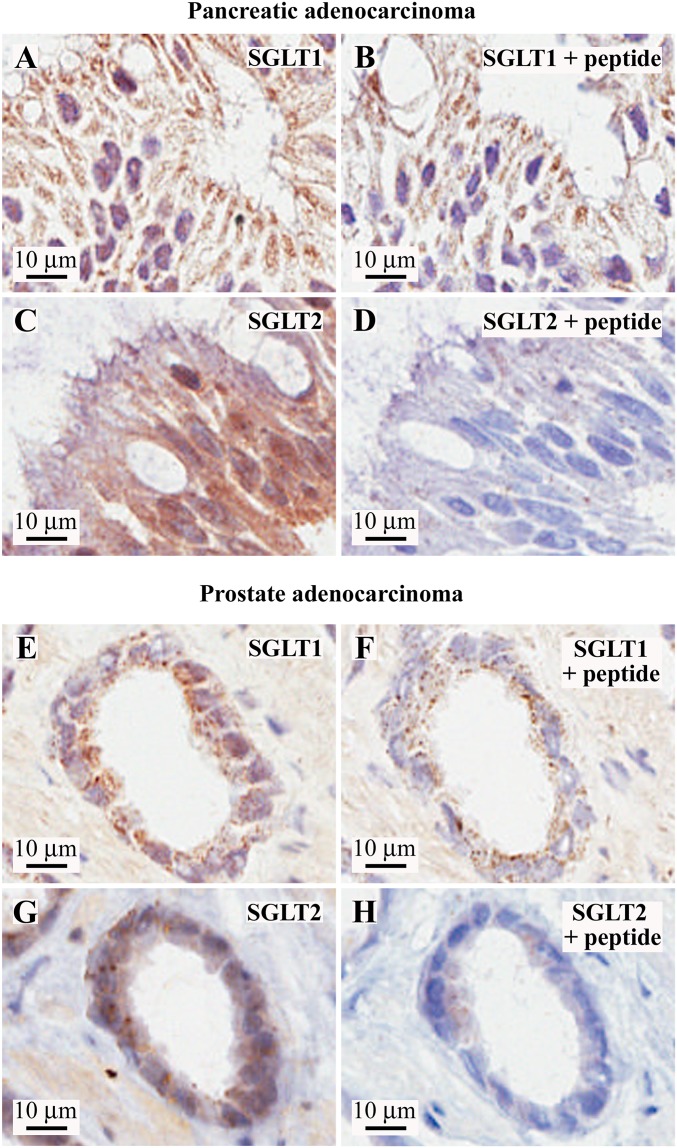
Fig. 1 shows representative results obtained for pancreatic (Left) and prostate (Right) adenocarcinomas: hematoxylin/eosin (H&E) staining of a 4-µm section of a moderately differentiated pancreatic ductal adenocarcinoma, where a malignant duct has atypical cells with stratified nuclei and is surrounded by the signature “desmoplastic reaction,” composed of myofibroblasts and extracellular matrix (Fig. 1A); SGLT1 IHC in an adjacent section of the same malignant duct, showing predominantly nuclear staining and little or no reaction in the desmoplastic tissue (Fig. 1B); and SGLT2 IHC in an adjacent section of the same duct, showing robust staining throughout the cytoplasm of the malignant duct cells and light staining of the myofibroblasts in the surrounding stroma (Fig. 1C). The prostate adenocarcinoma H&E staining (Fig. 1D) shows characteristic malignant microacini with a single layer of irregular epithelial cells, unlike the double cell layer in normal ducts. As in the malignant pancreatic ducts, the SGLT1 antibody reacts predominantly with the nuclei (Fig. 1E) (see also ref. 21), and the SGLT2 antibody with the cytoplasm (Fig. 1F), of the prostatic microacini. Similar IHC results were obtained in nine pancreatic ductal adenocarcinomas and nine prostate acinar adenocarcinomas (Table S1). SGLT1 and SGLT2 staining of the malignant pancreatic ducts and prostatic acini was blocked by the antigenic peptides used to generate the respective antibodies (Fig. S2).
Fig. 1.
Expression of SGLT1 and SGLT2 in human pancreatic and prostate cancers. Immunohistochemistry with SGLT1- and SGLT2-specific antibodies was performed in both pancreatic and prostate adenocarcinomas. (A–C) Representative images of a moderately differentiated pancreatic ductal adenocarcinoma. (A) Hematoxylin/eosin staining of a malignant pancreatic duct showing atypical cells with mucinous cytoplasm, high nucleus/cytoplasm ratio, and stratification of nuclei surrounded by a desmoplastic reaction. (B) SGLT1 staining of the same pancreatic cancer sample, showing a predominantly nuclear signal in the malignant cells. (C) SGLT2 staining of the same pancreatic cancer sample, showing cytoplasmic diffuse staining in the malignant cells. (D–F) Representative images of a prostatic acinar adenocarcinoma sample (Gleason score: 3 + 4 = 7/10). (D) H&E staining showing tightly packed malignant prostatic microacinar glands with irregular contours, single cell layer with atypical nuclei, and high nucleus/cytoplasm ratio. (E) SGLT1 staining of the prostate cancer sample, showing a predominantly nuclear signal in the malignant cells. (F) SGLT2 staining of the prostate cancer sample, showing cytoplasmic diffuse staining in the malignant cells. See Fig. S2 for images at higher magnification and confirmation of antibody specificity.
Table S1.
Summary of SGLT1/2 immunohistochemistry on pancreatic and prostate cancer samples
| Sample no. | Pathologic diagnosis | SGLT1 | SGLT2 |
| Pancreatic cancer | |||
| BS93983 | Pancreatic ductal adenocarcinoma, G2: moderately differentiated | Positive (in high-grade dysplasia) | Positive (in invasive cancer) |
| BS94406 | Pancreatic ductal adenocarcinoma, G2: moderately differentiated | Positive (cytoplasm) | Positive (cytoplasm) |
| BS95444 | Pancreatic ductal adenocarcinoma, G1: well-differentiated | Negative | Positive (cytoplasm) |
| BS95586 | Pancreatic ductal adenocarcinoma, G2: moderately differentiated | Positive (cytoplasm + nucleus) | Positive (cytoplasm) |
| BS95896 | Pancreatic ductal adenocarcinoma, G2: moderately differentiated | Positive (nucleus) | Positive (cytoplasm + nucleus) |
| BS93969 | Pancreatic ductal adenocarcinoma, G2: intermediate-grade | Positive (nucleus) | Positive (cytoplasm) |
| PACA#1 | Pancreatic ductal adenocarcinoma, G2: moderately differentiated | — | Positive (cytoplasm) |
| PACA#2 | Pancreatic ductal adenocarcinoma, G2: moderately differentiated | — | Positive (cytoplasm) |
| PACA#5 | Pancreatic ductal adenocarcinoma, G2: moderately differentiated | — | Positive (cytoplasm) |
| Prostate cancer | |||
| BS3451 | Prostatic acinar adenocarcinoma, Gleason: 3 + 3 = 6/10 | Positive (nucleus) | Negative |
| BS3469 | Prostatic acinar adenocarcinoma, Gleason: 3 + 3 = 6/10 | Positive (cytoplasm + nucleus) | Positive (cytoplasm) |
| BS3517 | Prostatic acinar adenocarcinoma, Gleason: 4 + 3 = 7/10 | Negative | Positive (cytoplasm) |
| BS3533 | Prostatic acinar adenocarcinoma, Gleason: 3 + 4 = 7/10 | Positive (nucleus) | Positive (cytoplasm) |
| BS3535 | Prostatic acinar adenocarcinoma, Gleason: 3 + 4 = 7/10 | Positive (nucleus) | Positive (cytoplasm) |
| BS3613 | Prostatic acinar adenocarcinoma, Gleason: 3 + 4 = 7/10 | Positive (cytoplasm + nucleus) | Positive |
| PRCA#2 | Prostatic acinar adenocarcinoma, Gleason: 3 + 4 = 7/10 | Positive (nucleus) | Positive (cytoplasm + nucleus) |
| PRCA#3 | Prostatic acinar adenocarcinoma, Gleason: 3 + 4 = 7/10 | Positive (nucleus) | Positive (cytoplasm + nucleus) |
| PRCA#5 | Prostatic acinar adenocarcinoma, Gleason: 4 + 3 = 7/10 | Negative | Positive (cytoplasm) |
Fig. S2.
Validation of SGLT1 and SGLT2 antibodies in human pancreatic and prostate cancers. (Left) Higher magnifications of the SGLT1 and SGLT2 staining of the same representative images of pancreatic and prostate cancers presented in Fig. 1. (Right) Respective negative controls obtained by probing adjacent tissue slices with the antibody preincubated with the blocking antigenic peptide. (A–D) Pancreatic adenocarcinoma sample. (A) SGLT1 staining. (B) SGLT1 + antigenic peptide control, showing nonspecific staining in the cytoplasm, whereas the nuclear signal is completely blocked. (C) SGLT2 staining. (D) SGLT2 + antigenic peptide control. (E–H) Prostatic acinar adenocarcinoma sample. (E) SGLT1 staining. (F) SGLT1 + antigenic peptide control, showing nonspecific staining in the cytoplasm, whereas the nuclear signal is completely blocked. (G) SGLT2 staining. (H) SGLT2 + antigenic peptide control.
We also examined the distribution of SGLT1 and SGLT2 in normal prostate and pancreas, that is, in regions of the tumor samples with normal histology. We observed specific SGLT1 antibody binding to the nuclei of normal prostate ducts (see also ref. 21) but no specific binding of the SGLT2 antibody. In normal pancreas, both the SGLT1 and SGLT2 antibodies bound specifically to the apical surfaces of intra- and interlobular ducts, but none was observed in the acini.
We conclude that both SGLT1 and SGLT2 are expressed in pancreatic and prostate adenocarcinomas, with the SGLT2 antibody robustly and diffusely staining the malignant cells and the SGLT1 antibody primarily staining the nuclei of the neoplastic cells. At the level of light microscopy, it is not possible to determine whether the SGLT2 antibody staining in the cytoplasm extended to the apical and/or basolateral plasma membrane of the malignant ducts. There was relatively little antibody staining of the tissue surrounding the malignant ducts or in the surrounding normal tissue in either tumor type.
Are SGLTs Expressed in Pancreatic and Prostate Cancers Functional?
To answer this, we carried out SGLT transport assays on tumors freshly harvested from patients. The approach followed that routinely used in biochemical studies carried out on organs harvested from experimental animals such as kidney, intestine, liver, and brain. Tumors were cut into thin sections and incubated with Me4FDG in the presence or absence of the specific SGLT inhibitors phlorizin or dapagliflozin (17, 23). At the end of the incubation, the tissue slices were exposed to radio autographic plates and the images were read on a digital imaging system. The validity of the method in our hands was confirmed using rat kidney slices.
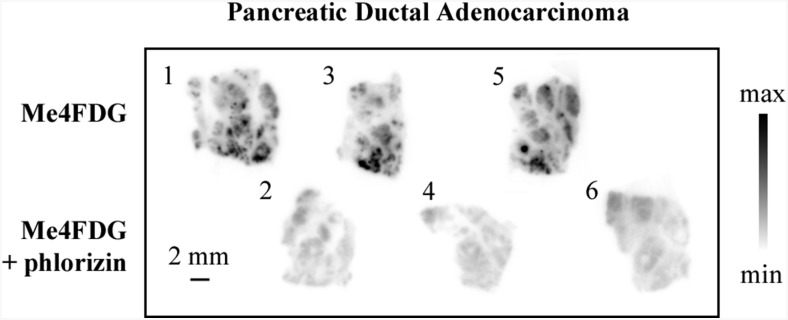
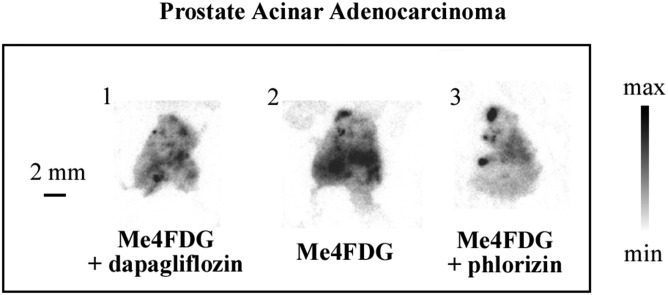
Fig. 2 shows representative results obtained on a pancreatic ductal adenocarcinoma where six serial 300-µm sections were incubated with Me4FDG, either in the presence or absence of phlorizin, a specific high-affinity inhibitor of SGLT glucose transport (23). In the absence of the inhibitor, Me4FDG was taken up into discrete regions, whereas phlorizin blocked this Me4FDG uptake in adjacent sections. Similar results are shown for two other pancreatic and three prostate adenocarcinomas (Figs. S3–S5), where phlorizin and the specific SGLT2 inhibitor dapagliflozin reduced the Me4FDG uptake (23). These uptake assays demonstrate that SGLT2 observed in pancreatic and prostate tumors by IHC are functional in discrete regions of the tumors freshly excised from patients (Table S2).
Fig. 2.
SGLT-dependent sugar uptake in human pancreatic adenocarcinoma in vitro. Fresh human cancer specimens obtained from surgery were cut into 300-μm-thick slices and incubated with Me4FDG, a positron-emitting glucose analog that is specifically transported by SGLTs, with or without coincubation with a specific SGLT inhibitor, and subsequently exposed to autoradiographic plates to obtain images of regional tracer uptake. The figure shows a representative sample of pancreatic ductal adenocarcinoma; alternate tissue slices were incubated with Me4FDG with or without the SGLT inhibitor phlorizin (100 μM). The numbers at the top left corner of each slice represent the order in which the slices were cut. The morphology of the samples was confirmed by H&E staining and pathologic consultation.
Fig. S3.
SGLT-dependent sugar uptake in human prostate adenocarcinoma in vitro. Fresh human cancer specimens obtained from the surgical room were cut into 300-μm-thick slices and incubated with Me4FDG, with or without coincubation with a specific SGLT inhibitor, and subsequently exposed to autoradiographic plates to obtain images of regional tracer uptake. The figure shows a representative sample of prostatic acinar adenocarcinoma; consecutive tissue slices were incubated with Me4FDG alone (slice 2), with or without cotreatment with an SGLT inhibitor: 250 nM dapagliflozin (slice 1) or 100 μM phlorizin (slice 3). The numbers at the top left corner of each slice represent the order in which the slices were cut. The morphology of the samples was confirmed by hematoxylin/eosin staining and pathologic consultation.
Fig. S5.
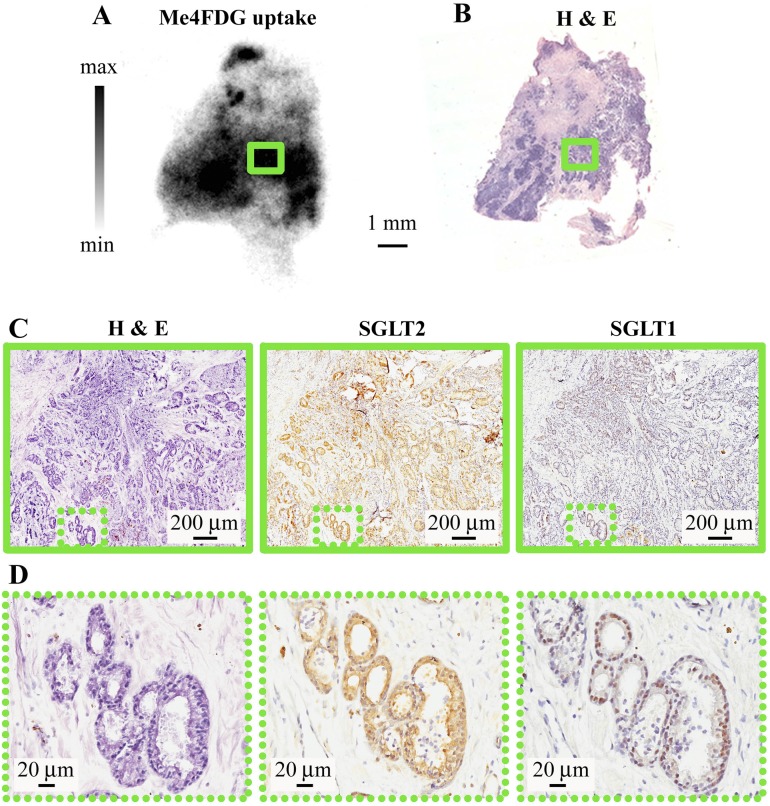
Correlation between Me4FDG uptake, morphology, and SGLT expression in prostate cancer. (A) In vitro uptake of Me4FDG by a slice of prostatic acinar carcinoma (Gleason score: 3 + 4 = 7/10), the same as shown in Fig. S3. (B) Corresponding H&E staining on a thin section obtained by reslicing the autoradiography slice. (C) H&E staining (Left), SGLT2 (Center), and SGLT1 immunohistochemistry (Right) of a region corresponding to a high-uptake area highlighted in A by the green rectangle. The low-magnification images show closely packed malignant microacini infiltrating the stroma. (D) Higher magnification of the area highlighted in C by the green dotted rectangle, showing detail of microacini infiltrating the stroma expressing both SGLT2 (diffuse staining) and SGLT1 (nuclear staining). This experiment was on the same prostate tumor shown in Fig. S3.
Table S2.
Summary of α-methyl-4-deoxy-4-[18F]fluoro-d-glucopyranoside uptake in pancreatic and prostate cancer samples
| Sample no. | Pathologic diagnosis | Inhibition by phlorizin | Inhibition by dapagliflozin |
| Prostate cancer | |||
| PRCA#2 | Prostatic acinar adenocarcinoma | Yes | n/a |
| PRCA#3 | Prostatic acinar adenocarcinoma | Yes | Yes |
| PRCA#5 | Prostatic acinar adenocarcinoma | n/a | Yes |
| Pancreatic cancer | |||
| PACA#1 | Pancreatic ductal adenocarcinoma | Yes | n/a |
| PACA#2 | Pancreatic ductal adenocarcinoma | Yes | n/a |
| PACA#5 | Pancreatic ductal adenocarcinoma | Yes | Yes |
n/a, not tested.
Dynamic uptake of α-methyl-4-deoxy-4-[18F]fluoro-d-glucopyranoside (Me4FDG) by pancreatic cancer xenografts. ASPC-1 cells were injected into the right flank of NOD/SCID-IL2Rgamma mice and, when palpable tumor masses developed, treatment was started with either oral dapagliflozin (30 mg/kg) or placebo. After 3 wk, the mice were imaged with a 1-h dynamic scan started at the moment of i.v. injection of Me4FDG. The movies report the signal from representative scans of one mouse in the placebo group and one in the SGLT2 inhibitor group (the same as in Fig. 5). The signal is expressed as the percentage of injected dose per gram of tissue (% ID/g). Movies S1 and S2 show the delivery phase where the Me4FDG is distributed throughout the vascular tree, and Movies S3 and S4 show the subsequent 59 min of dynamic scan (redistribution phase), displaying a progressive accumulation of Me4FDG in the tumor and other organs. Time (h:min:s) is reported in red at the bottom left corner for either the first minute or 1–60 min.
Is SGLT Functional Activity Correlated with SGLT Expression in Human Pancreatic and Prostate Cancers?
To determine whether Me4FDG transport and retention in cancer tissue are correlated with the functional expression of SGLT2 in malignant tissue, the 300-µm slices used for the transport assay were resliced into thin sections (10-μm) after decay of the 18F isotope (half-life: 109 min). Serial sections were examined for their morphology (H&E) and distribution of SGLT1 and SGLT2 (IHC).
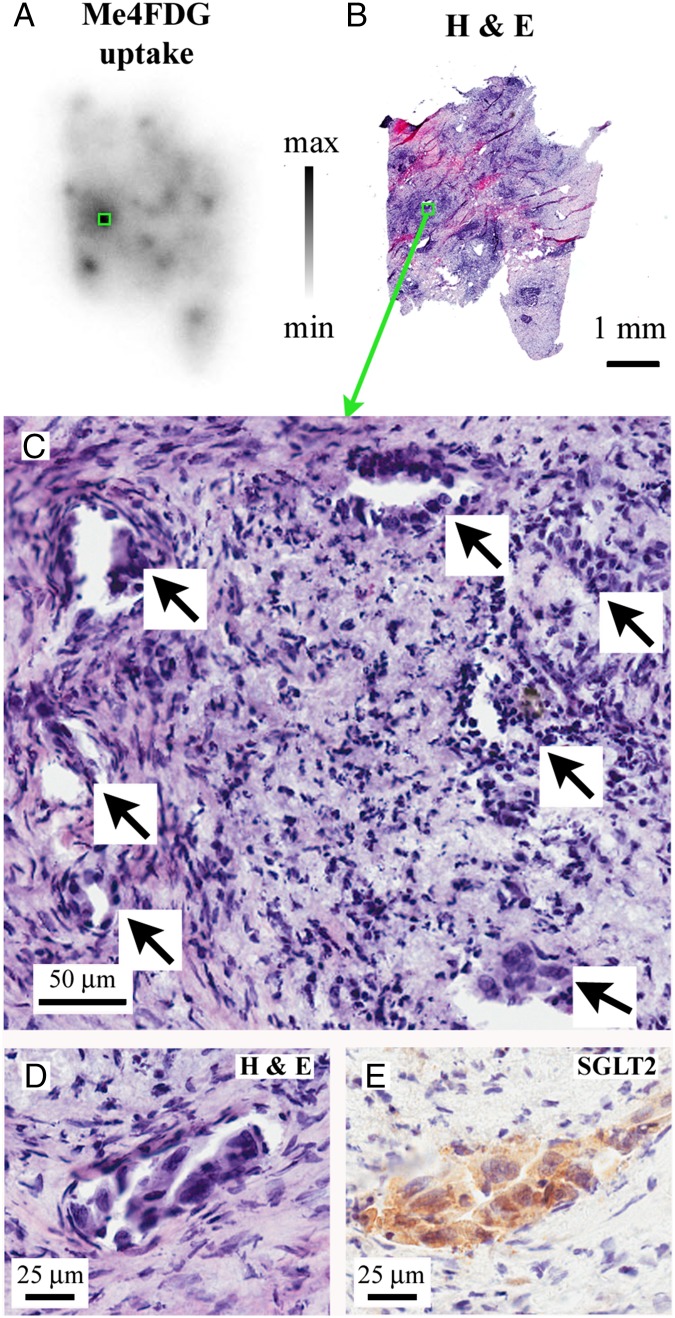
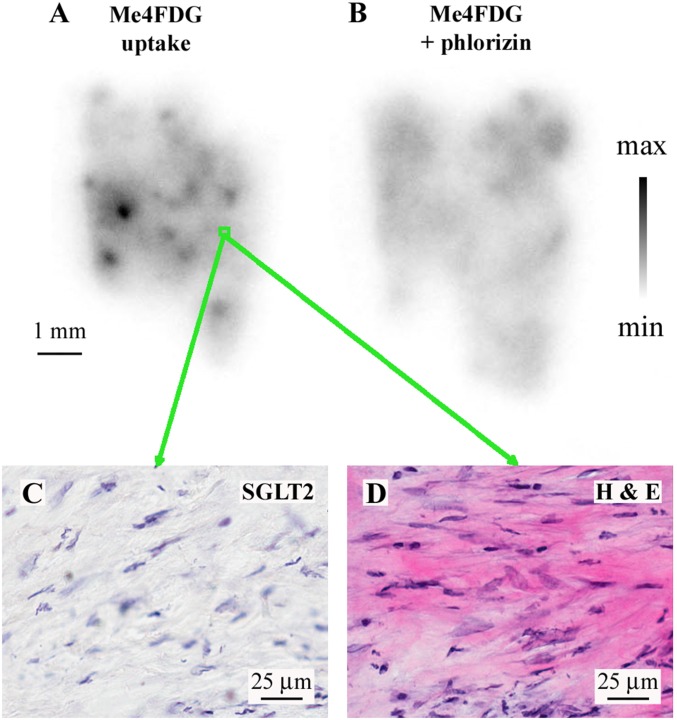
Fig. 3 shows the results obtained on a pancreatic adenocarcinoma: a representative autoradiographic image obtained for Me4FDG uptake (Fig. 3A); a 10-µm section of the whole tumor slice shown in Fig. 3A, stained with H&E (Fig. 3B); and a higher-magnification view of the hotspot outlined by the green boxes in Fig. 3 A and B, indicating the location of malignant pancreatic ducts (arrows) within a background of fibrotic and inflammatory tissue (Fig. 3C). The SGLT2 antibody stained the cytoplasm of the neoplastic ducts (Fig. 3 D and E) but not the surrounding desmoplastic reaction. In regions of low Me4FDG uptake (Fig. S4), the H&E staining showed only fibromuscular tissue and no SGLT2 antibody staining. Similar results were obtained with prostate cancers (Fig. S5). Figs. S3 and S5 show an experiment on a prostate acinar adenocarcinoma (Gleason score 3 + 4 = 7/10) where Me4FDG uptake was blocked by phlorizin and dapagliflozin (Fig. S3) and the area of Me4FDG uptake showed robust SGLT2 antibody staining in the cytoplasm of closely packed malignant microacini (Fig. S5), whereas SGLT1 antibody staining was restricted to the acinar cell nuclei. The results demonstrating that SGLT antibody staining was blocked by the appropriate antigenic peptides and that there was no SGLT2 staining in regions of low Me4FDG uptake are shown in Fig. S4.
Fig. 3.
Correlation between Me4FDG uptake, morphology, and SGLT expression. The figure shows a representative sample of a moderately differentiated pancreatic adenocarcinoma. (A) Autoradiographic image of Me4FDG uptake in the cancer tissue. (B) The Me4FDG autoradiographic slice in A was resliced into thin sections; some of the thin sections were stained with H&E for morphologic analysis. The autoradiography image has a single predominant spot of tracer uptake, highlighted by a green rectangle in A and B. Higher magnification of the corresponding hematoxylin/eosin staining of this area (C) shows the presence of malignant ducts (arrows) on the background of fibrosis and chronic inflammatory cells. SGLT2 expression, responsible for Me4FDG uptake, was detected only in malignant ducts. (D) Representative malignant duct with pleomorphic cells, high nucleus/cytoplasm ratio, and an angulated appearance. (E) IHC on the same malignant duct, showing strong positivity for SGLT2 in the malignant cells. SGLT1 was not expressed in pancreatic tumors.
Fig. S4.
Correlation between Me4FDG uptake, morphology, and SGLT expression in pancreatic cancer. (A) In vitro uptake of Me4FDG by a slice of a moderately differentiated pancreatic ductal adenocarcinoma, with one low-uptake area highlighted (green rectangle) corresponding to the immunohistochemistry (IHC) and the H&E stains presented in C and D. (B) The adjacent pancreatic adenocarcinoma slide was incubated with Me4FDG + 100 µM phlorizin, a specific SGLT inhibitor, to prove that the tissue uptake was inhibited by blocking SGLT-dependent transport. (C) Immunohistochemistry with the SGLT2 antibody in the low-uptake area highlighted in A by the green rectangle, showing no expression of SGLT2. (D) H&E staining of the same region, showing the presence of tumor stroma in the low-intake area. This tumor is the same one shown in Fig. 3: B is the phlorizin control for Fig. 3A; the H&E and SGLT2 IHC are from an area of low Me4FDG uptake.
These results strongly suggest that the regions of high Me4FDG accumulation in tumor slices (Fig. 2 and Figs. S3 and S5) are due to the expression of SGLT2 in malignant tissue. In no region of low Me4FDG uptake did we find malignant tissue or SGLT2 antibody staining. In two of the pancreatic ductal adenocarcinoma specimens, an intermediate Me4FDG uptake was detected also in chronic inflammatory infiltrates, in conjunction with expression of SGLT2 in lymphoid inflammatory cells. The areas of lowest Me4FDG uptake were represented by fibromuscular tissue (prostate cancers) or desmoplasia (pancreatic cancers) (Fig. S4).
Imaging of SGLT2 Expression in Tumors in Vivo.
Although PET imaging with 2FDG, as a GLUT-mediated probe of glucose utilization, is a powerful way to diagnose and stage tumors in patients (11, 12), its clinical utilization in pancreatic and prostate cancers has been limited by its low diagnostic efficacy. Because these cancers have functional SGLTs, which do not transport 2FDG, we decided to test the possibility of imaging pancreatic and prostate cancer with the SGLT-specific tracer Me4FDG.
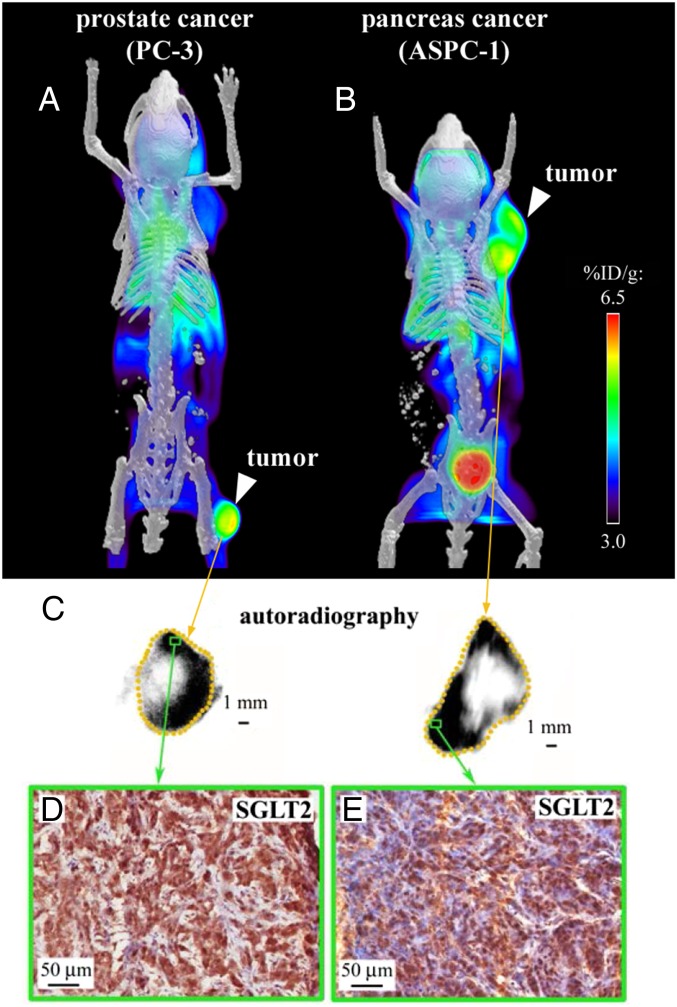
We established s.c. tumor xenografts in NOD/SCID-ILR2gamma (NSG) mice (24) with ASPC-1 or PC-3 cells and measured SGLT activity using Me4FDG microPET/computed tomography (CT). ASPC-1 and PC-3 cells were used as models for pancreatic and prostate cancers, respectively (25, 26). Me4FDG is a substrate for SGLTs but not GLUTs (17), and unlike 2FDG it is not metabolized in vivo, which adds to the specificity of its in vivo localization in tissues (19). After i.v. injection the tracer is first rapidly distributed throughout the vascular tree (Movies S1 and S2) and then it is initially distributed throughout the various organs in proportion to blood flow (Movie S3), later following the functional distribution of SGLT1 and SGLT2. Unlike 2FDG, Me4FDG does not enter the brain, as it is not a substrate for GLUT1 in the blood–brain barrier, and little is excreted into the urinary bladder, as it is reabsorbed by SGLTs in the proximal renal tubule (Movie S3 and figure 11 in ref. 17). In mice, the steady-state distribution of Me4FDG is similar to that in humans, with about 4% of the injected dose per gram of tissue in heart, skeletal muscle, and kidneys. In mice harboring the PC-3 and ASPC-1 tumors, Me4FDG accumulated in each tumor (Fig. 4 A and B and Movie S3). Fig. 4C shows the steady-state distribution of Me4FDG in the prostate and pancreatic tumors obtained with ex vivo autoradiography of the excised tumors. The tracer was accumulated in the vital tumor tissue and not in the necrotic core. IHC of the PC-3 and ASPC-1 xenografts showed expression of SGLT2 in the vital tumor tissue (Fig. 4 D and E) but not of SGLT1.
Fig. 4.
Functional expression of SGLT in tumor xenografts. Tumor xenografts were established in NOD/SCID-IL2Rgamma mice with two cell lines: one of pancreatic cancer (ASPC-1) and one of androgen-independent prostate cancer (PC-3). Tumors were imaged after i.v. injection of 0.1 mCi Me4FDG, a positron-emitting glucose analog specifically transported by SGLTs, and volumetric microPET/CT images were generated including the signal collected between 25 and 60 min after injection. (A) MicroPET/CT of a prostate cancer xenograft. (B) MicroPET/CT of a pancreatic cancer xenograft. (C) Ex vivo autoradiographic images obtained from the same xenografts after excising and slicing the tumor into 20-μm-thick sections and incubating them with autoradiographic plates; representative images are presented for the prostate cancer (Left) and pancreatic cancer (Right) xenografts. (D and E) The sections used for autoradiography were subsequently fixed and used for immunohistochemistry with antibodies against SGLT2. The green rectangles represent high-uptake areas of the prostate cancer (D) and pancreatic cancer (E) xenografts, showing high SGLT2 expression. SGLT1 was not expressed in the xenografts.
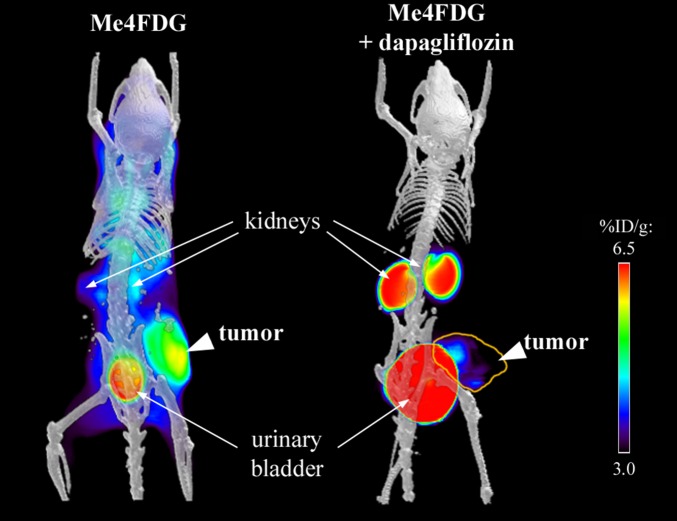
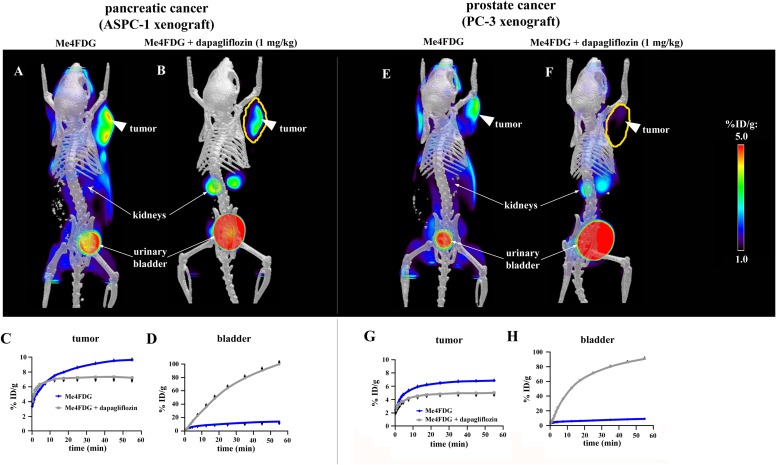
Confirmation of SGLT2 functional expression in these tumor models was obtained by testing the effect of SGLT2 inhibitors on Me4FDG uptake in microPET experiments. Fig. 5 and Fig. S6 show examples of the steady-state distribution of Me4FDG in mice treated chronically (30 mg/kg daily for 3 wk) or acutely (a single dose of 1 mg/kg) with dapagliflozin or a placebo control. In the untreated mice, Me4FDG was accumulated in the tumors (as in Fig. 5A) and uptake was blocked by dapagliflozin (Fig. 5B). Note the expected appearance of Me4FDG in the urinary bladder due to the inhibition of SGLT2 in the proximal tubule. Fig. S6 shows the time course of Me4FDG excretion into the urinary bladder with and without dapagliflozin (see also Movies S3 and S4). In general, dapagliflozin at this dosage inhibited Me4FDG uptake into pancreatic and prostate tumors by 40‒50%, which compared well with the 50% reduction in the reabsorption of glucose from the glomerular filtrate (27). As in human tumors, Me4FDG uptake into in vitro slices of mouse tumors was blocked by dapagliflozin.
Fig. 5.
Inhibition of Me4FDG microPET signal by chronic oral administration of dapagliflozin. The pancreatic cancer xenografts were imaged by a dynamic microPET scan after administration of Me4FDG, a tracer transported specifically by SGLTs, with or without treatment with the SGLT2 inhibitor dapagliflozin. The figure shows microPET/CT scans of pancreatic cancer xenografts including the signal collected between 45 and 60 min after injection, with (Right) or without (Left) chronic treatment of the mice with dapagliflozin (30 mg⋅kg−1⋅d−1 for 3 wk); the yellow line highlights the tumor, after inhibition of SGLT2 in the kidney.
Fig. S6.
Inhibition of Me4FDG uptake into tumors by dapagliflozin. The pancreatic and prostate cancer xenografts were imaged with Me4FDG, with or without treatment with a single i.v. dose (1 mg/kg) of the SGLT2 inhibitor dapagliflozin. The microPET/CT images A, B, E, and F were recorded between 25 and 60 min after injection. (A and B) MicroPET/CT scans of a pancreatic cancer xenograft (ASPC-1) after injection of either Me4FDG (A) or Me4FDG + dapagliflozin (B). The scans were performed on the same mouse on different days. (C and D) Time–activity curves of ROIs representing the tumor (C) or the bladder (D). (E and F) MicroPET/CT scans of a prostate cancer xenograft (PC-3) after injection of either Me4FDG (E) or Me4FDG + dapagliflozin (F). The scans were performed on the same mouse on different days. (G and H) Time–activity curves of ROIs representing the tumor (G) or the bladder (H). The values of the percentage of injected dose per gram of tissue (% ID/g) represent averages of four different mice. The error bars indicate SE.
These microPET and IHC studies on the ASPC-1 and PC-3 mouse xenograft models of pancreatic and prostate cancers demonstrated that SGLT2 is actively involved in glucose uptake into these tumors.
Does SGLT2 Play a Role in Cancer Growth and Survival?
To evaluate the importance of SGLT2 in tumor cell growth and survival, we carried out preliminary trials on the effect of SGLT2 inhibitors on a pancreatic cancer xenograft model. Subcutaneous ASPC-1 tumors produced in the upper thigh or lower flank of NSG mice were monitored for up to 4 wk during treatment with 30 mg/kg canagliflozin or dapagliflozin. The protocol for SGLT2 inhibitors was the one developed for inhibiting renal SGLT2 in mice and patients with diabetes (27–30). As a positive control, we included treatment with the anticancer drug gemcitabine. Drug treatment was initiated after the tumors were palpable (50‒70 mm3), and each was monitored by caliper, microPET/CT, and H&E histology.
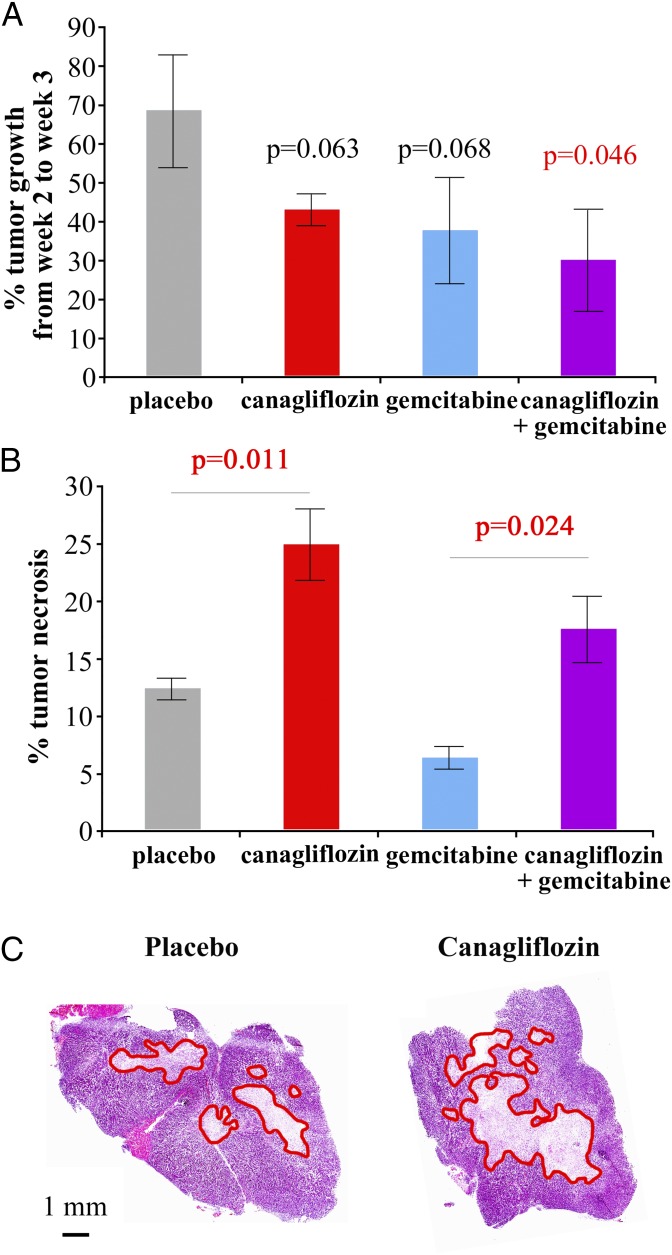
In a first small trial, we had four treatment arms (six mice each): placebo, canagliflozin, gemcitabine, and canagliflozin plus gemcitabine. Gemcitabine was administered as described (i.p. 80 mg/kg every 3 d) (31–33). In this trial, we detected a similar reduction in growth rate in the canagliflozin and gemcitabine arms. Indeed, the weekly tumor growth in both the canagliflozin and gemcitabine groups (43% and 38%, respectively) was lower than that in the placebo group (63%). The canagliflozin plus gemcitabine arm tumors increased their volume by only 30% in 1 wk, and this reduction in tumor growth was significantly different from that in the placebo group (P = 0.046) (Fig. 6A). Canagliflozin induced an increase in the central necrotic area from 12 to 26% of the tumor volume (P = 0.013), whereas gemcitabine caused a reduction in tumor necrosis from 12 to 6% (P = 0.011) (Fig. 6B). This is not surprising, considering that gemcitabine inhibits DNA synthesis and ribonucleotide reductase, causing a depletion of deoxynucleotides in the cell and cell-cycle arrest/apoptosis but not necrosis (34). However, in the canagliflozin plus gemcitabine group the tumor necrosis extended to 18% of tumor volume (P = 0.024), significantly higher than the gemcitabine-only group. Fig. 6C shows a typical example of H&E staining of a tumor slice from the placebo arm and one from the canagliflozin arm, showing increased extension of the necrosis (highlighted in red). These results suggest that gemcitabine is able to reduce tumor growth but does not induce necrosis, whereas canagliflozin is able to reduce tumor growth and increase the necrosis in the tumor center. Addition of canagliflozin to gemcitabine potentiates the gemcitabine effect on tumor growth, and in addition causes an increase in tumor necrosis.
Fig. 6.
Effect of canagliflozin treatment on tumor growth and survival in a pancreatic cancer model. NOD/SCID-IL2Rgamma mice were injected with pancreatic cancer ASPC-1 cells (1.7 × 10⁶ cells), and when the tumors reached a volume of 50 mm3 the treatment with canagliflozin (30 mg⋅kg−1⋅d−1) ± gemcitabine (80 mg/kg every 72 h) was started and carried out for 3 wk (group size, six mice). Static microPET/CT scans with α-methyl-4-deoxy-4-[18F]fluoro-d-glucopyranoside (10-min scans after a 1-h uptake) were performed at weeks 2 and 3 of treatment. The tumor volumes were estimated by drawing regions of interest encompassing the whole tumor, and the tumor growth rate was estimated by calculating the percentage of increase in volume between weeks 2 and 3 (A). After the week 3 scans, the mice were killed and the tumors were extracted, fixed, and subjected to H&E staining for % of necrosis estimation. The percentage of tumor necrosis was estimated on two tumor slices per tumor, on two tumors per therapeutic group; average values are reported in B, whereas representative images are reported in C. Necrotic areas are highlighted by red lines. The error bars represent SE values.
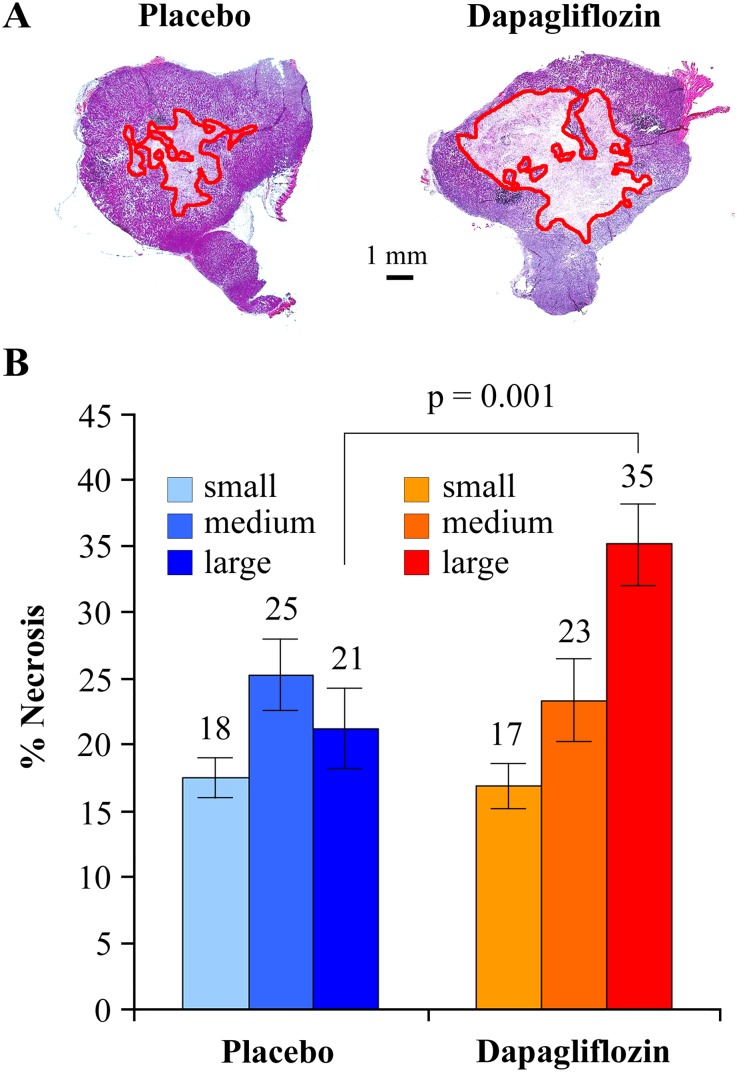
To confirm the effect of SGLT2 inhibition with a different drug, we performed a larger trial with 30 mg⋅kg−1⋅d−1 oral dapagliflozin, 15 mice in each arm, for 4 wk. The treatment caused a small reduction in the rate of tumor growth, which was not statistically significant. However, dapagliflozin caused a highly significant increase in tumor necrosis, particularly in the larger tumors from 21% of tumor volume in the placebo to 35% (P = 0.001) in the dapagliflozin-treated mice (Fig. S7). This result suggests that dapagliflozin may not have a significant effect on tumor growth but has a strong effect on tumor necrosis in the biggest tumors, suggesting that SGLT2 functional activity is essential for survival when the tumors are large enough to limit diffusion of glucose in the central areas of the tumor.
Fig. S7.
Effect of SGLT2 inhibition on necrosis extension in pancreatic cancer xenografts. Pancreatic cancer xenografts were established with the ASPC-1 cell line and, when tumors reached an estimated volume of 70 mm3, oral treatment with 30 mg⋅kg−1⋅d−1 dapagliflozin was started. After 4 wk of treatment, the tumors were extracted and sliced for H&E staining. (A) Representative images of whole slices from tumors treated with placebo (Left) or dapagliflozin (Right); the limits of necrotic areas are highlighted in red. (B) Quantification of the percentage of tumor slice occupied by necrotic tissue in both placebo and dapagliflozin groups (n = 15). Each group was divided into three subgroups of five subjects each (small, medium, and large) according to tumor weight as measured after collection of the tumors.
Taken together, these results show that SGLT2 inhibition by two different drugs reduced the viability of cancer cells, especially around the central necrotic areas of the tumor, and may also reduce tumor growth. We propose that SGLT2 inhibition may potentiate the antitumor effect of conventional chemotherapy of pancreatic cancer, and provide a rationale for combination therapy with gemcitabine and SGLT2 drugs.
Discussion
We have demonstrated the functional expression of sodium-glucose transporters in human pancreatic and prostate adenocarcinomas. There was robust expression of SGLT2 in pancreatic and prostate cancers, and its functional activity was blocked by specific SGLT inhibitors. SGLT2, but not SGLT1, was expressed in mouse models of pancreatic and prostate cancers, and the uptake of glucose was reduced by SGLT2 inhibitors. We have also provided preliminary evidence that SGLT2 may be required for tumor growth and survival in the pancreatic cancer xenograft model: Treatment with SGLT2 inhibitors reduced the rate of tumor growth and/or increased tumor necrosis. Altogether, these studies suggest that pancreatic and prostate tumors in patients may be detected and staged using Me4FDG-PET imaging, and that SGLT2 drugs, already approved for diabetes (35), may be used for therapy.
SGLT1 and SGLT2 Expression.
Although we detected both SGLT1 and SGLT2 in the human cancer samples analyzed, the evidence strongly indicates that SGLT2 was responsible for Me4FDG uptake into these tumors. SGLT2 was expressed in the cytoplasm in all nine pancreatic cancers and in eight out of nine prostatic cancers analyzed. Although the resolution of light microscopy does not permit us to determine the exact subcellular localization of SGLT2 in cancer cells, it is reasonable to assume that at least a subpopulation of the transporters is in the plasma membrane. This is supported by the fact that the tumor samples were able to accumulate the nonmetabolized SGLT-specific tracer Me4FDG. The abundance of SGLT2 in the cytoplasm of the tumors suggests that trafficking of the transporter to the plasma membrane may be regulated by an appropriate signal, as in the case of GLUT4 regulation by insulin (36). In contrast, SGLT1 expression was restricted to the nuclei of the malignant cells, where it could not participate in Me4FDG uptake across the plasma membrane. The significance of SGLT2 expression in tumors emerges from our in vitro transport assays, where Me4FDG uptake is blocked by SGLT inhibitors, and from our in vivo microPET experiments showing the accumulation of Me4FDG that is inhibited by SGLT2 drugs (Fig. 5 and Figs. S3 and S6).
The predominance of SGLT2 over SGLT1 expression in tumors is potentially advantageous for the development of novel therapies to treat pancreatic and prostate tumors with SGLT2 inhibitors approved by the Food and Drug Administration for diabetes treatment. For those tumors that express SGLT1, the current development of SGLT1 and dual SGLT1/2 inhibitors for diabetes may also prove to be useful in cancer therapy.
Biological Significance and Therapeutic Implications.
The discovery of a new mechanism of glucose transport in cancer raises the question of the relevance of these transporters compared with the already well-known GLUT-dependent glucose uptake (7, 37). The main difference between GLUTs and SGLTs is that whereas GLUTs transport glucose down the concentration gradient (facilitated diffusion), SGLTs harness the sodium gradient across the plasma membrane to drive glucose uptake, namely sodium-glucose cotransport. Thus, the energy for glucose cotransport is obtained indirectly from ATP driving the Na/K pump used to maintain the sodium gradient across the plasma membrane. SGLTs are expressed in very metabolically active cells in the body, such as the epithelia in the intestine and kidney and neurons in the brain, such as CA1 cells in the hippocampus and Purkinje cells in the cerebellum (19, 20). In epithelial cells, SGLTs and GLUTs are expressed in different plasma membranes, apical and basolateral membranes, respectively, but in cancer cells the distribution and relative importance of the two types of glucose transporters are not yet known.
It is possible that in cancer cells, SGLT2 and GLUT1 channel glucose toward different cellular compartments and metabolic pathways, including aerobic glycolysis, mitochondrial oxidation, the pentose phosphate pathway, and the hexosamine pathway (required to glycosylate important signaling proteins such as growth factor receptors) (38, 39). Because many metabolic enzymes have been reported to bind to the cell membrane or shuttle between different subcellular localizations to orchestrate a compartmentalization of carbohydrate metabolic pathways (40–42), it is reasonable to speculate that the modality of glucose transport into the cells (SGLT vs. GLUT) may have the ability to play a role in the determination of the metabolic fate of this important nutrient.
Why do cancer cells need to pay dearly for glucose import by SGLTs (e.g., ATP consumption to maintain the sodium pump) when glucose import via GLUTs is facilitated and energy-free? One hypothesis is that SGLTs confer the ability to sustain glucose uptake for cellular metabolism even when the glucose concentration in the tumor microenvironment is low, due to the fast and disordered growth of atypical cells and hypoxia (43). Recent interpretations of the Warburg effect have pointed out that cells located in hypoxic areas of the tumor are responsible for the majority of glucose uptake and glycolysis (44–46). Our data hint that SGLT2 is a critical transporter for maintaining viable tumor cells, because the treatment of pancreatic cancer xenografts with SGLT2 inhibitors causes cellular death, as evidenced by enlargement of the central necrotic area in large tumors. These areas are also particularly resistant to traditional chemotherapy, which targets mostly the cell cycle and cytokinesis in actively proliferating cells (47, 48). This has important therapeutic implications, because pharmacological block of SGLTs in hypoxic cells could potentiate the effects of currently used treatments for pancreatic cancer and castration-resistant prostate cancers, which are typically resistant to chemotherapy. This possibility is suggested by the fact that addition of canagliflozin to gemcitabine in our therapeutic trial in a pancreatic cancer model potentiated the antiproliferative effect of gemcitabine and induced an increase in tumor cell necrosis.
Diagnostic Implications.
In addition to the biological and therapeutic implications, the availability of an SGLT-specific positron-emitting tracer opens very important diagnostic possibilities. In pancreatic cancer, the definition of the local extension of disease is of paramount importance, as the only curative intervention is surgery, which is highly dependent on the diagnostic definition of the local extension of the disease (49). Although computed tomography and magnetic resonance scans offer a very good anatomical definition, they are not specific enough to discriminate cancer from chronic pancreatitis and to define local infiltration of the disease and local lymph node metastasis (50). The addition of 2FDG-PET to the CT scan has been proposed to increase the sensitivity of detection of local infiltration but the results of 2FDG-PET have been very inconsistent (51), and this imaging modality is not used for staging pancreatic cancer. The use of Me4FDG, which is actively accumulated in cancer cells, has the potential to improve detection of pancreatic cancer by PET, thus allowing a better definition of the local extension of the disease and providing a better guide for the therapeutic management of the disease.
In prostate cancer, detection of neoplastic tissue in the prostate and in the pelvic lymph nodes by 2FDG-PET is hindered not only by the intrinsic low uptake of 2FDG by cancer cells but also by the imaging interference caused by the high excretion of 2FDG into the urinary bladder (15, 16). Me4FDG, unlike 2FDG, is reabsorbed by the kidney, and so is not excreted into the urinary bladder (Figs. 3 and 4). Therefore, Me4FDG-PET will allow a clear detection of the tumor and lymph nodes in the pelvic area.
In conclusion, our demonstration of the functional expression of SGLT2 in pancreatic and prostate carcinomas opens new diagnostic and therapeutic possibilities for these common cancers. We suggest that Me4FDG-PET may be useful in the diagnosis and staging of these cancers; in addition, SGLT2 drugs developed to treat diabetes may be useful in treating these cancers, either alone or in combination with other antitumor drugs. It is well-recognized that increased glucose uptake and aerobic glycolysis are landmarks of cancer cells, and both processes have been targets for cancer therapy. It has been a challenge to selectivity inhibit glucose uptake into tumors, because this generally occurs through the GLUTs, which are also widely expressed in heart, muscle, brain, and other organs. However, in those tumors where glucose uptake occurs through SGLTs, it may be possible to significantly reduce glucose uptake and cell growth by inhibiting SGLT activity. In the case of SGLT2, which is normally only expressed in the kidney, potent selective inhibitors have been introduced for the treatment of diabetes. These drugs lower blood glucose levels in diabetics by inhibiting the reabsorption of glucose in the kidney, and clinical trials on tens of thousands of patients have not revealed any severe adverse effects. Therefore, in the case of tumors expressing SGLT2, such as pancreatic and prostate cancers, we predict that the diabetes drugs will reduce glucose uptake, disrupt glycolysis, and reduce tumor growth without significant side effects.
Materials and Methods
Antibodies.
The polyclonal antibodies against SGLT1 and SGLT2 were produced and tested in the E.M.W. and H.K. laboratories (19, 20, 22). The SGLT1 antibody was raised against a synthetic peptide corresponding to residues 563‒575 of human SGLT1, and the SGLT2 antibody was raised against a peptide corresponding to residues 591‒609 of human SGLT2. They were tested in the current study using samples of human renal cortex provided by the Tissue Procurement Core Laboratory at UCLA.
Radiochemical Synthesis.
α-Methyl-4-deoxy-4-[18F]fluoro-d-glucopyranoside was synthesized from 1-α-methyl-2,3,6-tri-O-acetyl-4-O-triflyl-d-galactopyranoside by (i) SN2 substitution of the triflyl moiety with cyclotron-produced [18F]fluoride ion, (ii) purification of the resultant 18F-labeled intermediate by reverse-phase semipreparative HPLC, and (iii) deprotection of the acetyl groups in the 18F-labeled intermediate under basic conditions. The biomarker, obtained in 43% radiochemical yield (end of synthesis, corrected for decay), was constituted in normal saline. The chemical and radiochemical purities of the final product were ascertained by analytical HPLC and radioTLC and found to be >97% with specific activity >2,000 Ci⋅mmol−1 (end of synthesis) (52).
In Vitro Autoradiography of Fresh Human Cancer Samples.
Review by the UCLA IRB confirmed that this study was exempt. All human tissues were obtained through our Department of Pathology and no personal information was provided (de-identified samples). Human cancer samples (deidentified) were procured through the Tissue Procurement Core Laboratory (TPCL) in the Department of Pathology and Laboratory Medicine, David Geffen School of Medicine at UCLA. The specimens were preserved in cold (4 °C) PBS (137 mM NaCl, 2.7 mM KCl, 10.0 mM Na2HPO4, 1.76 mM KH2PO4, pH 7.4) until delivery, and then were sliced into 300-μm-thick sections with a vibratome (Pelco 101, Series 1000, Technical Products International) in cold PBS. The sections were washed in PBS and incubated for 20 min at 37 °C with 10 μCi/mL Me4FDG saturated with 95% O2/5% CO2. The specificity of the Me4FDG uptake was tested by incubating alternating slices with or without SGLT inhibitors (100 μM phlorizin or 250 nM dapagliflozin). After the incubation, the slices were washed four times in cold PBS and subsequently exposed for 10 min to autoradiography plates. The plates were read with a Fuji BAS digital imaging system, and the sections were fixed in 4% (wt/vol) paraformaldehyde in PBS (pH 7.4) for 48 h, followed by cryopreservation in 25% (wt/vol) sucrose in PBS for at least 24 h. The sections were resliced into 10-μm-thick sections for immunohistochemistry and H&E staining. The presence of cancer in all of the samples analyzed was confirmed independently by board-certified pathologists in the TPCL.
Immunohistochemistry and Hematoxylin/Eosin Staining.
For SGLT2 antibody staining (22), the samples were subjected to antigen retrieval by incubation in sodium citrate (pH 6.0) solution for 40 min at 110 °C (flash-frozen samples and tumor xenografts), whereas for the autoradiography samples, which were particularly delicate due to the multiple incubations at 37 °C and at room temperature before fixing, a more gentle protocol was used for antigen retrieval: 10 min at 85 °C (22). For SGLT1 antibody staining, no antigen retrieval was required. Endogenous peroxidase was blocked by incubation with 0.3% H2O2 for 30 min, followed by washes in PBS and incubation for 30 min in blocking buffer [5% (vol/vol) donkey serum, 0.1% NaN3 in PBS]. Incubation with the antibodies was performed overnight at 4 °C (SGLT2) or at room temperature (SGLT1). After washes, the samples were incubated with secondary antibody (biotin-conjugated donkey anti-rabbit antibody; Jackson ImmunoResearch) for 90 min at room temperature and then with an avidin/biotinylated enzyme complex (R.T.U. ABC Vectastain Kit; Vector Laboratories) for 90 min at room temperature, followed by washes and incubation with the diaminobenzidine substrate (Sigma) for 20 min. For each experiment, human kidney was used as a positive control, and overnight preincubation of the antibodies with the respective competitor peptides was used as a negative control. Counterstaining was performed with diluted (1/5 in water) Harris hematoxylin (Sigma). For the H&E staining, a standard staining in Harris hematoxylin and acid eosin was performed. All microscopic slides were scanned with an Aperio ScanScope AT scanner for analysis.
Animal Experiments.
All animal experiments were performed with permission from the Animal Care and Use Program established by the Chancellor’s Animal Research Committee of UCLA. The NSG mice were bred in the UCLA Radiation Oncology colony, and female mice age 4‒6 wk were used for the experiment. ASPC-1 cells and PC-3 cells were grown in culture for at least three passages after thawing; 2 × 10⁶ cells were resuspended in sterile PBS and injected s.c. into the right hind limb, right fore limb, or the flank region of the animals.
For microPET/CT imaging, the animals were anesthetized with 2% (vol/vol) isoflurane in oxygen, immobilized to the imaging bed, and injected with 150 μCi Me4FDG immediately before starting a 1-h dynamic PET scan followed by a 10-min microCT scan [Focus 220 microPET scanner (Concorde Microsystems) and Inveon microPET scanner (Siemens) for the PET scans; MicroCAT II microCT scanner (Imtek) for the CT scans] (53). For ex vivo autoradiography (19, 20, 54) 1 mCi Me4FDG was injected, and after 1 h the animals were killed and the tumors were extracted and sliced into 20-μm sections on microscope slides, incubated for 10 min with autoradiographic plates, and fixed in formalin for further analysis (IHC, H&E).
For the therapeutic trials, canagliflozin (Invokana) 300-mg tablets and dapagliflozin (Farxiga) 10-mg tablets were crushed into a fine powder and then resuspended in 0.5% hydroxypropyl-methyl cellulose (Sigma; hypromellose meeting United States Pharmaceutical testing specifications, viscosity ∼4,000 cPoise, 2% in H2O at 20 °C). The suspension was prepared daily and administered at a dose of 30 mg/kg of active ingredient per d by oral gavage. The placebo group received only 0.5% hydroxypropyl-methyl cellulose. In the canagliflozin trial, we had four arms (six animals each): placebo, canagliflozin, gemcitabine (i.p. injection, 80 mg/kg every 3 d), and canagliflozin plus gemcitabine; in the dapagliflozin trial, we used 15 animals for each of the two arms (placebo and dapagliflozin). To measure tumor growth, in the canagliflozin trial, two static microPET/CT scans after a 1-h unconscious uptake of Me4FDG were performed at weeks 2 and 3 of treatment to monitor the effect of canagliflozin and to measure tumor volumes. In the dapagliflozin trial, the mice were subjected to microCT the day before the beginning of treatment and then weekly until the end of the trial; the efficacy of the treatment in blocking SGLT was confirmed by microPET/CT with Me4FDG in a subset of the animals involved in the study. The PET/CT scans allowed us to measure the excretion of Me4FDG into the urinary bladder as a positive control of drug efficacy; in the control mice, no Me4FDG was excreted into the bladder, whereas about 50% of the filtered glucose load was excreted in mice treated with the SGLT2 inhibitor (27). After the end of the trials, the mice were killed and the tumors were harvested for morphologic analysis, fixed in 4% paraformaldehyde in PBS (pH 7.4), and then sliced into 7-μm-thick slices on Superfrost microscope slides (Fisher Scientific). H&E staining was performed as follows: 20 s in Harris hematoxylin, two washes in distilled water, four dips in 0.1% ammonium hydroxide, two washes in distilled water, dehydration steps in 70% ethanol, 95% ethanol, and 100% ethanol, and three times in xylenes.
MicroPET Image Analysis.
The image files generated by the microPET/microCT imaging were analyzed using AMIDE software (amide.sourceforge.net/) (55). Spherical regions of interest (ROIs) and ROIs encompassing the whole tumor volume were drawn based on the microPET/CT image; the data were expressed as the amount of the tracer in the ROI as a percentage of the injected dose per gram of tissue (%ID/g). The total injected dose was calculated as the counts in an ROI encompassing the whole animal. The %ID/g’s in ROIs on five different animals were averaged to obtain statistical significance (56).
Image Analysis.
The slides stained with H&E were scanned with an Aperio ScanScope AT scanner, and regions of interest corresponding to the necrotic areas, as well as the whole tumor sections, were manually drawn with Aperio software, which also calculates the area of the drawn regions.
Supplementary Material
Acknowledgments
We thank Drs. William McBride and Josephine Ratikan in Radiation Oncology for providing the NSG mice, training, and advice on establishing xenograft models, Ka Her for technical support, and Delia Adefuin for all her assistance in obtaining fresh tumor samples. We acknowledge Dr. Judy Gasson, Director of the UCLA Jonsson Comprehensive Cancer Center, and Dr. Sarah Dry, Director of the Center for Pathology Research Services, UCLA Department of Pathology and Laboratory Medicine, for their unfailing support of this project. C.S. was supported by a UCLA Scholars in Oncologic Molecular Imaging (SOMI) Fellowship and National Institutes of Health Grant R25 CA098010. This study was supported by grants from the National Institutes of Health (DK19567 and DK077133 to E.M.W.), the Elizabeth and Thomas Plott Endowed Chair in Gerontology (J.R.B.), and the UCLA Jonsson Comprehensive Cancer Center.
Footnotes
The authors declare no conflict of interest.
This article contains supporting information online at www.pnas.org/lookup/suppl/doi:10.1073/pnas.1511698112/-/DCSupplemental.
References
- 1.Ganapathy-Kanniappan S, Geschwind JF. Tumor glycolysis as a target for cancer therapy: Progress and prospects. Mol Cancer. 2013;12:152. doi: 10.1186/1476-4598-12-152. [DOI] [PMC free article] [PubMed] [Google Scholar]
- 2.Teicher BA, Linehan WM, Helman LJ. Targeting cancer metabolism. Clin Cancer Res. 2012;18(20):5537–5545. doi: 10.1158/1078-0432.CCR-12-2587. [DOI] [PMC free article] [PubMed] [Google Scholar]
- 3.Tennant DA, Durán RV, Gottlieb E. Targeting metabolic transformation for cancer therapy. Nat Rev Cancer. 2010;10(4):267–277. doi: 10.1038/nrc2817. [DOI] [PubMed] [Google Scholar]
- 4.Warburg O. On the origin of cancer cells. Science. 1956;123(3191):309–314. doi: 10.1126/science.123.3191.309. [DOI] [PubMed] [Google Scholar]
- 5.Cairns RA, Harris IS, Mak TW. Regulation of cancer cell metabolism. Nat Rev Cancer. 2011;11(2):85–95. doi: 10.1038/nrc2981. [DOI] [PubMed] [Google Scholar]
- 6.Lunt SY, Vander Heiden MG. Aerobic glycolysis: Meeting the metabolic requirements of cell proliferation. Annu Rev Cell Dev Biol. 2011;27:441–464. doi: 10.1146/annurev-cellbio-092910-154237. [DOI] [PubMed] [Google Scholar]
- 7.Ganapathy V, Thangaraju M, Prasad PD. Nutrient transporters in cancer: Relevance to Warburg hypothesis and beyond. Pharmacol Ther. 2009;121(1):29–40. doi: 10.1016/j.pharmthera.2008.09.005. [DOI] [PubMed] [Google Scholar]
- 8.Mueckler M, Thorens B. The SLC2 (GLUT) family of membrane transporters. Mol Aspects Med. 2013;34(2-3):121–138. doi: 10.1016/j.mam.2012.07.001. [DOI] [PMC free article] [PubMed] [Google Scholar]
- 9.Czernin J, Benz MR, Allen-Auerbach MS. PET/CT imaging: The incremental value of assessing the glucose metabolic phenotype and the structure of cancers in a single examination. Eur J Radiol. 2010;73(3):470–480. doi: 10.1016/j.ejrad.2009.12.023. [DOI] [PubMed] [Google Scholar]
- 10.Czernin J, Phelps ME. Positron emission tomography scanning: Current and future applications. Annu Rev Med. 2002;53:89–112. doi: 10.1146/annurev.med.53.082901.104028. [DOI] [PubMed] [Google Scholar]
- 11.Krause BJ, Schwarzenböck S, Souvatzoglou M. FDG PET and PET/CT. Recent Results Cancer Res. 2013;187:351–369. doi: 10.1007/978-3-642-10853-2_12. [DOI] [PubMed] [Google Scholar]
- 12.Gallamini A, Zwarthoed C, Borra A. Positron emission tomography (PET) in oncology. Cancers (Basel) 2014;6(4):1821–1889. doi: 10.3390/cancers6041821. [DOI] [PMC free article] [PubMed] [Google Scholar]
- 13.Matsumoto I, et al. 18-fluorodeoxyglucose positron emission tomography does not aid in diagnosis of pancreatic ductal adenocarcinoma. Clin Gastroenterol Hepatol. 2013;11(6):712–718. doi: 10.1016/j.cgh.2012.12.033. [DOI] [PubMed] [Google Scholar]
- 14.Wang Z, Chen JQ, Liu JL, Qin XG, Huang Y. FDG-PET in diagnosis, staging and prognosis of pancreatic carcinoma: A meta-analysis. World J Gastroenterol. 2013;19(29):4808–4817. doi: 10.3748/wjg.v19.i29.4808. [DOI] [PMC free article] [PubMed] [Google Scholar]
- 15.Jadvar H. Imaging evaluation of prostate cancer with 18F-fluorodeoxyglucose PET/CT: Utility and limitations. Eur J Nucl Med Mol Imaging. 2013;40(Suppl 1):S5–S10. doi: 10.1007/s00259-013-2361-7. [DOI] [PMC free article] [PubMed] [Google Scholar]
- 16.Bouchelouche K, et al. PET/CT imaging and radioimmunotherapy of prostate cancer. Semin Nucl Med. 2011;41(1):29–44. doi: 10.1053/j.semnuclmed.2010.08.005. [DOI] [PMC free article] [PubMed] [Google Scholar]
- 17.Wright EM, Loo DD, Hirayama BA. Biology of human sodium glucose transporters. Physiol Rev. 2011;91(2):733–794. doi: 10.1152/physrev.00055.2009. [DOI] [PubMed] [Google Scholar]
- 18.Wright EM. Glucose transport families SLC5 and SLC50. Mol Aspects Med. 2013;34(2-3):183–196. doi: 10.1016/j.mam.2012.11.002. [DOI] [PubMed] [Google Scholar]
- 19.Yu AS, et al. Functional expression of SGLTs in rat brain. Am J Physiol Cell Physiol. 2010;299(6):C1277–C1284. doi: 10.1152/ajpcell.00296.2010. [DOI] [PMC free article] [PubMed] [Google Scholar]
- 20.Yu AS, et al. Regional distribution of SGLT activity in rat brain in vivo. Am J Physiol Cell Physiol. 2013;304(3):C240–C247. doi: 10.1152/ajpcell.00317.2012. [DOI] [PMC free article] [PubMed] [Google Scholar]
- 21.Blessing A, et al. Sodium/glucose co-transporter 1 expression increases in human diseased prostate. J Cancer Sci Ther. 2012;40(9):306–312. [Google Scholar]
- 22.Vrhovac I, et al. Localizations of Na(+)-D-glucose cotransporters SGLT1 and SGLT2 in human kidney and of SGLT1 in human small intestine, liver, lung, and heart. Pflugers Arch. October 11, 2014 doi: 10.1007/s00424-014-1619-7. [DOI] [PubMed] [Google Scholar]
- 23.Hummel CS, et al. Structural selectivity of human SGLT inhibitors. Am J Physiol Cell Physiol. 2012;302(2):C373–C382. doi: 10.1152/ajpcell.00328.2011. [DOI] [PMC free article] [PubMed] [Google Scholar]
- 24.Zhou Q, Facciponte J, Jin M, Shen Q, Lin Q. Humanized NOD-SCID IL2rg–/– mice as a preclinical model for cancer research and its potential use for individualized cancer therapies. Cancer Lett. 2014;344(1):13–19. doi: 10.1016/j.canlet.2013.10.015. [DOI] [PubMed] [Google Scholar]
- 25.Kaighn ME, Narayan KS, Ohnuki Y, Lechner JF, Jones LW. Establishment and characterization of a human prostatic carcinoma cell line (PC-3) Invest Urol. 1979;17(1):16–23. [PubMed] [Google Scholar]
- 26.Tan MH, Chu TM. Characterization of the tumorigenic and metastatic properties of a human pancreatic tumor cell line (AsPC-1) implanted orthotopically into nude mice. Tumour Biol. 1985;6(1):89–98. [PubMed] [Google Scholar]
- 27.Terami N, et al. Long-term treatment with the sodium glucose cotransporter 2 inhibitor, dapagliflozin, ameliorates glucose homeostasis and diabetic nephropathy in db/db mice. PLoS One. 2014;9(6):e100777. doi: 10.1371/journal.pone.0100777. [DOI] [PMC free article] [PubMed] [Google Scholar]
- 28.Bailey CJ, Gross JL, Pieters A, Bastien A, List JF. Effect of dapagliflozin in patients with type 2 diabetes who have inadequate glycaemic control with metformin: A randomised, double-blind, placebo-controlled trial. Lancet. 2010;375(9733):2223–2233. doi: 10.1016/S0140-6736(10)60407-2. [DOI] [PubMed] [Google Scholar]
- 29.Liang Y, et al. Effect of canagliflozin on renal threshold for glucose, glycemia, and body weight in normal and diabetic animal models. PLoS One. 2012;7(2):e30555. doi: 10.1371/journal.pone.0030555. [DOI] [PMC free article] [PubMed] [Google Scholar]
- 30.Devineni D, et al. Pharmacokinetics and pharmacodynamics of canagliflozin, a sodium glucose co-transporter 2 inhibitor, in subjects with type 2 diabetes mellitus. J Clin Pharmacol. 2013;53(6):601–610. doi: 10.1002/jcph.88. [DOI] [PubMed] [Google Scholar]
- 31.Pei J, et al. Combination with liposome-entrapped, ends-modified raf antisense oligonucleotide (LErafAON) improves the anti-tumor efficacies of cisplatin, epirubicin, mitoxantrone, docetaxel and gemcitabine. Anticancer Drugs. 2004;15(3):243–253. doi: 10.1097/00001813-200403000-00009. [DOI] [PubMed] [Google Scholar]
- 32.Damaraju VL, et al. Synergistic activity of troxacitabine (Troxatyl) and gemcitabine in pancreatic cancer. BMC Cancer. 2007;7:121. doi: 10.1186/1471-2407-7-121. [DOI] [PMC free article] [PubMed] [Google Scholar]
- 33.Wang W, et al. Triptolide triggers the apoptosis of pancreatic cancer cells via the downregulation of Decoy receptor 3 expression. J Cancer Res Clin Oncol. 2012;138(9):1597–1605. doi: 10.1007/s00432-012-1235-x. [DOI] [PubMed] [Google Scholar]
- 34.Mini E, Nobili S, Caciagli B, Landini I, Mazzei T. Cellular pharmacology of gemcitabine. Ann Oncol. 2006;17(Suppl 5):v7–v12. doi: 10.1093/annonc/mdj941. [DOI] [PubMed] [Google Scholar]
- 35.Gallo LA, Wright EM, Vallon V. Probing SGLT2 as a therapeutic target for diabetes: Basic physiology and consequences. Diab Vasc Dis Res. 2015;12(2):78–89. doi: 10.1177/1479164114561992. [DOI] [PMC free article] [PubMed] [Google Scholar]
- 36.Ghezzi C, Wright EM. Regulation of the human Na+-dependent glucose cotransporter hSGLT2. Am J Physiol Cell Physiol. 2012;303(3):C348–C354. doi: 10.1152/ajpcell.00115.2012. [DOI] [PMC free article] [PubMed] [Google Scholar]
- 37.Szablewski L. Expression of glucose transporters in cancers. Biochim Biophys Acta. 2013;1835(2):164–169. doi: 10.1016/j.bbcan.2012.12.004. [DOI] [PubMed] [Google Scholar]
- 38.Itkonen HM, et al. O-GlcNAc transferase integrates metabolic pathways to regulate the stability of c-MYC in human prostate cancer cells. Cancer Res. 2013;73(16):5277–5287. doi: 10.1158/0008-5472.CAN-13-0549. [DOI] [PubMed] [Google Scholar]
- 39.Ying H, et al. Oncogenic Kras maintains pancreatic tumors through regulation of anabolic glucose metabolism. Cell. 2012;149(3):656–670. doi: 10.1016/j.cell.2012.01.058. [DOI] [PMC free article] [PubMed] [Google Scholar]
- 40.Lloyd PG, Hardin CD. Caveolae and the organization of carbohydrate metabolism in vascular smooth muscle. J Cell Biochem. 2001;82(3):399–408. doi: 10.1002/jcb.1170. [DOI] [PubMed] [Google Scholar]
- 41.Seidler NW. Compartmentation of GAPDH. Adv Exp Med Biol. 2013;985:61–101. doi: 10.1007/978-94-007-4716-6_3. [DOI] [PubMed] [Google Scholar]
- 42.Vallejo J, Hardin CD. Expression of caveolin-1 in lymphocytes induces caveolae formation and recruitment of phosphofructokinase to the plasma membrane. FASEB J. 2005;19(6):586–587. doi: 10.1096/fj.04-2380fje. [DOI] [PubMed] [Google Scholar]
- 43.Hanahan D, Weinberg RA. The hallmarks of cancer. Cell. 2000;100(1):57–70. doi: 10.1016/s0092-8674(00)81683-9. [DOI] [PubMed] [Google Scholar]
- 44.Sonveaux P, et al. Targeting lactate-fueled respiration selectively kills hypoxic tumor cells in mice. J Clin Invest. 2008;118(12):3930–3942. doi: 10.1172/JCI36843. [DOI] [PMC free article] [PubMed] [Google Scholar]
- 45.Semenza GL. Tumor metabolism: Cancer cells give and take lactate. J Clin Invest. 2008;118(12):3835–3837. doi: 10.1172/JCI37373. [DOI] [PMC free article] [PubMed] [Google Scholar]
- 46.Icard P, Lincet H. A global view of the biochemical pathways involved in the regulation of the metabolism of cancer cells. Biochim Biophys Acta. 2012;1826(2):423–433. doi: 10.1016/j.bbcan.2012.07.001. [DOI] [PubMed] [Google Scholar]
- 47.Mayer A, Vaupel P. Hypoxia, lactate accumulation, and acidosis: Siblings or accomplices driving tumor progression and resistance to therapy? Adv Exp Med Biol. 2013;789:203–209. doi: 10.1007/978-1-4614-7411-1_28. [DOI] [PubMed] [Google Scholar]
- 48.Jain RK. Antiangiogenesis strategies revisited: From starving tumors to alleviating hypoxia. Cancer Cell. 2014;26(5):605–622. doi: 10.1016/j.ccell.2014.10.006. [DOI] [PMC free article] [PubMed] [Google Scholar]
- 49.Ryan DP, Hong TS, Bardeesy N. Pancreatic adenocarcinoma. N Engl J Med. 2014;371(11):1039–1049. doi: 10.1056/NEJMra1404198. [DOI] [PubMed] [Google Scholar]
- 50.de la Santa LG, Retortillo JA, Miguel AC, Klein LM. Radiology of pancreatic neoplasms: An update. World J Gastrointest Oncol. 2014;6(9):330–343. doi: 10.4251/wjgo.v6.i9.330. [DOI] [PMC free article] [PubMed] [Google Scholar]
- 51.Rijkers AP, Valkema R, Duivenvoorden HJ, van Eijck CH. Usefulness of F-18-fluorodeoxyglucose positron emission tomography to confirm suspected pancreatic cancer: A meta-analysis. Eur J Surg Oncol. 2014;40(7):794–804. doi: 10.1016/j.ejso.2014.03.016. [DOI] [PubMed] [Google Scholar]
- 52.Wright EM, Barrio JR, Hirayama BA, Kepe V. 2014. Tracers for monitoring the activity of sodium/glucose cotransporters in health and disease. US Patent 8,845,99 B2.
- 53.Kreissl MC, et al. Influence of dietary state and insulin on myocardial, skeletal muscle and brain [18F]-fluorodeoxyglucose kinetics in mice. EJNMMI Res. 2011;1:8. doi: 10.1186/2191-219X-1-8. [DOI] [PMC free article] [PubMed] [Google Scholar]
- 54.Charon Y, Lanièce P, Tricoire H. Radio-imaging for quantitative autoradiography in biology. Nucl Med Biol. 1998;25(8):699–704. doi: 10.1016/s0969-8051(98)00052-3. [DOI] [PubMed] [Google Scholar]
- 55.Loening AM, Gambhir SS. AMIDE: A free software tool for multimodality medical image analysis. Mol Imaging. 2003;2(3):131–137. doi: 10.1162/15353500200303133. [DOI] [PubMed] [Google Scholar]
- 56.Boellaard R. Standards for PET image acquisition and quantitative data analysis. J Nucl Med. 2009;50(Suppl 1):11S–20S. doi: 10.2967/jnumed.108.057182. [DOI] [PubMed] [Google Scholar]
Associated Data
This section collects any data citations, data availability statements, or supplementary materials included in this article.


