Significance
Translation initiation governs many cellular processes, including cell proliferation, growth, and development. Central to this process is the translation initiation factor 4E (eIF4E), which recruits the small ribosomal subunit to the 5′ end of the mRNA through its interaction with the scaffold protein eIF4G. The eIF4E/eIF4G interaction is highly regulated by competitive binding of 4E-binding proteins (4E-BPs), which are at a convergence point of signaling pathways and act as tumor suppressors. The recently discovered eIF4E/eIF4G interaction inhibitor 1 (4EGI-1) dissociates eIF4G but enhances 4E-BP1 binding and has antitumor activity. Here, we elucidate the mechanism for the dual activity of 4EGI-1—it dissociates eIF4G from eIF4E but stabilizes the binding of 4E-BP1.
Keywords: translation initiation, phosphorylation, protein–protein interaction inhibitor, structure
Abstract
The eIF4E-binding protein (4E-BP) is a phosphorylation-dependent regulator of protein synthesis. The nonphosphorylated or minimally phosphorylated form binds translation initiation factor 4E (eIF4E), preventing binding of eIF4G and the recruitment of the small ribosomal subunit. Signaling events stimulate serial phosphorylation of 4E-BP, primarily by mammalian target of rapamycin complex 1 (mTORC1) at residues T37/T46, followed by T70 and S65. Hyperphosphorylated 4E-BP dissociates from eIF4E, allowing eIF4E to interact with eIF4G and translation initiation to resume. Because overexpression of eIF4E is linked to cellular transformation, 4E-BP is a tumor suppressor, and up-regulation of its activity is a goal of interest for cancer therapy. A recently discovered small molecule, eIF4E/eIF4G interaction inhibitor 1 (4EGI-1), disrupts the eIF4E/eIF4G interaction and promotes binding of 4E-BP1 to eIF4E. Structures of 14- to 16-residue 4E-BP fragments bound to eIF4E contain the eIF4E consensus binding motif, 54YXXXXLΦ60 (motif 1) but lack known phosphorylation sites. We report here a 2.1-Å crystal structure of mouse eIF4E in complex with m7GTP and with a fragment of human 4E-BP1, extended C-terminally from the consensus-binding motif (4E-BP150–84). The extension, which includes a proline-turn-helix segment (motif 2) followed by a loop of irregular structure, reveals the location of two phosphorylation sites (S65 and T70). Our major finding is that the C-terminal extension (motif 3) is critical to 4E-BP1–mediated cell cycle arrest and that it partially overlaps with the binding site of 4EGI-1. The binding of 4E-BP1 and 4EGI-1 to eIF4E is therefore not mutually exclusive, and both ligands contribute to shift the equilibrium toward the inhibition of translation initiation.
Translation control of gene expression allows cells to respond quickly to external cues. In eukaryotic cells, this regulation occurs mainly at the translation initiation step (reviewed in ref. 1). Cellular eukaryotic mRNAs have a cap structure at their 5′ terminus, which is a modified nucleotide (7-methylguanosine triphosphate, m7GpppN, where N is any nucleotide) (2). The translational preinitiation complex assembles at the m7GpppN cap via the translation initiation complex 4F (eIF4F) (3), which comprises a cap-binding protein, eIF4E, a DEAD-Box RNA helicase, eIF4A, and a large scaffold protein, eIF4G. The scaffold protein eIF4G interacts with eIF4E through a consensus motif, YXXXXLΦ, where X is any amino acid and Φ is a hydrophobic residue. This motif is also shared by eIF4E binding proteins (4E-BPs). The interaction between eIF4E and 4E-BP is phosphorylation-dependent (4–8). When hypophosphorylated, 4E-BP binds tightly to eIF4E. Hyperphosphorylation of 4E-BP, however, decreases its affinity for eIF4E, enabling eIF4G to interact with eIF4E.
Altered regulation of translation initiation has been linked to prion formation (9) and to several human diseases, including autism (10) and cancer (11). eIF4E is overexpressed in a variety of tumor cells (12, 13). This overexpression has been implicated in oncogenic transformation (14, 15), a process that 4E-BPs can effectively revert (14–16). Mammalian target of rapamycin (mTOR) inhibitors, such as rapamycin and its analogs, exert antitumor activity by suppressing 4E-BP1’s phosphorylation, thus enabling its interaction with eIF4E (17). The ability of 4E-BPs to compete with eIF4G for eIF4E binding is explained by the shared YXXXXLΦ binding motif (18, 19). Crystal structures of mouse eIF4E complexed with either 4E-BP151–64, eIF4G-I569–580, or eIF4G-II621–637, all short fragments containing the consensus-binding motif, are virtually identical (19–22). NMR spectroscopy titration experiments (23) and small angle X-ray scattering of full-length 4E-BP1 bound to eIF4E (24) suggested that 4E-BP1 has a larger binding interface on eIF4E than eIF4G. In agreement with this observation, mutagenesis analysis and affinity binding measurements showed that the C-terminal segment of 4E-BPs is auxiliary for binding to eIF4E (25, 26). More recently, a conserved 79PGVTS/T83 motif found in the C terminus of 4E-BPs was shown to enhance its binding affinity to eIF4E from micromolar to nanomolar range (27, 28), revealing that 4E-BP1 has, in fact, a bipartite binding interface with eIF4E.
Our group has identified a small-molecule inhibitor, eIF4E/eIF4G interaction inhibitor 1 (4EGI-1), which specifically disrupts association of eIF4G-derived peptides with eIF4E but stabilizes the eIF4E/4E-BP1 interaction (29). 4EGI-1 is of particular interest because it inhibits cap-dependent translation, is active against numerous cancer cell lines, and reduces growth of human cancer xenografts in vivo (29–31). Its effect is partially explained by the recent crystal structure of an eIF4E/4EGI-1 complex, in which the inhibitor binds to a site located remotely from the YXXXXLΦ binding interface, suggesting that it allosterically represses translation initiation (32). However, the mechanism by which 4EGI-1 stabilized 4E-BP1 binding remains unclear.
In this study, we describe a crystal structure of eIF4E bound to a 35-residue fragment of 4E-BP1. This fragment comprises the consensus-binding motif and also a proline-turn-helix segment containing two phosphorylation sites (S65 and T70) followed by a loop of irregular structure. We find that the C-terminal loop of 4E-BP1 partially overlaps with the binding site of 4EGI-1, which enables us to understand the molecular mechanism through which 4EGI-1 inhibits translation initiation: by dissociating eIF4G from eIF4E but also stabilizing the interaction between eIF4E and the unphosphorylated form of 4E-BP1. We further find that the C-terminal loop of 4E-BP1 is required to inhibit cap-dependent translation and mediates cell cycle arrest in mammalian cells.
Results
Minimal 4E-BP1 Binding Region to eIF4E.
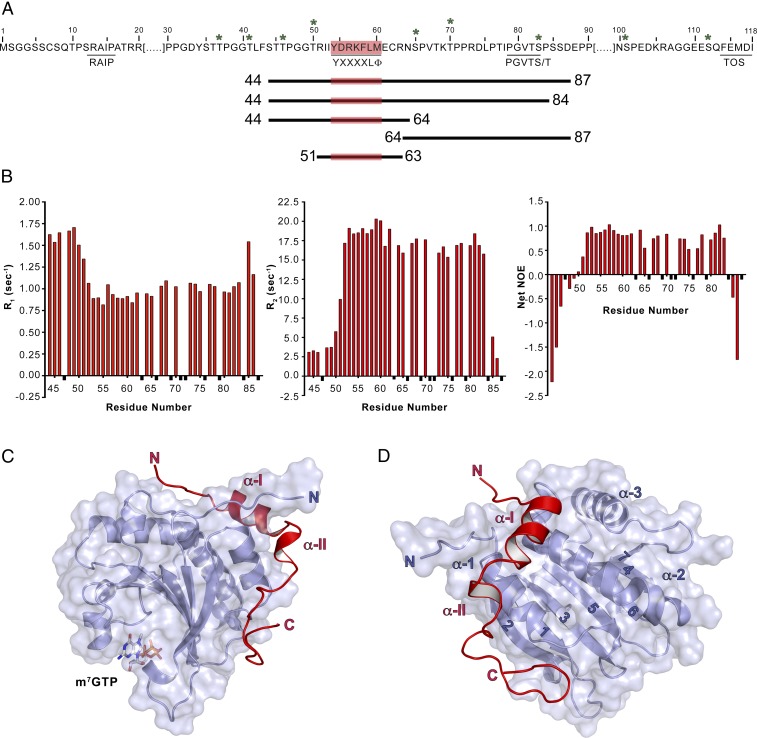
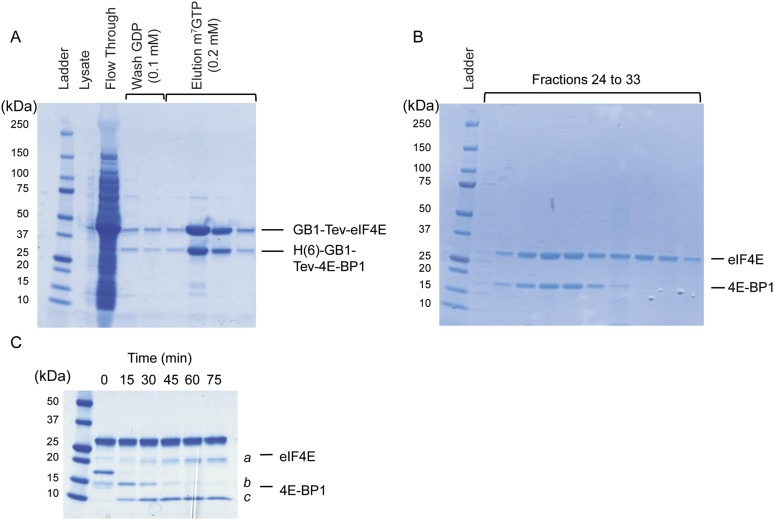
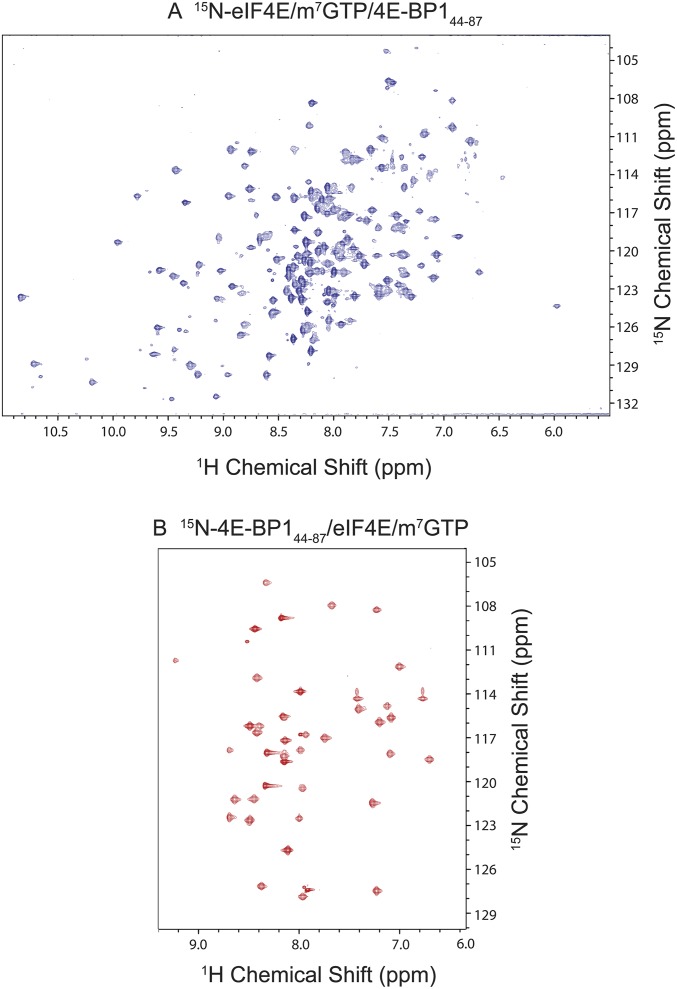
Mutagenesis and affinity measurements show that the C-terminal 4E-BP segment 79PGVTS/T83 contributes to eIF4E binding (25–28) (Fig. 1A and Fig. S1). We focused on 4E-BP1 because, among the three known mammalian isoforms (4E-BP1, 4E-BP2, and 4E-BP3) (33), it is the most abundant in human tissues and the best characterized (34). Although the m7GTP cap has been used in all of the experiments described below, we do not further mention it to simplify the text. We used limited proteolysis and mass spectrometry (LC-MS/MS) on the mouse eIF4E (see Materials and Methods for a comparison between human and mouse eIF4E) complexed to human 4E-BP1 to identify segments of 4E-BP1 protected from degradation after their association with eIF4E (Fig. S2). We identified an N-terminally truncated fragment of eIF4E (eIF4EΔ30), confirming that the N terminus of eIF4E is unstructured and dynamic in solution (35). We also recovered two 4E-BP1 fragments (residues 17–118 and 44–118). We removed residues 88–118, generating 4E-BP144–87, because NMR spectra of longer fragments bound to eIF4E showed poor dispersion for those nonconserved residues (Fig. S1). The transverse relaxation-optimized spectroscopy (TROSY)-heteronuclear single quantum correlation (HSQC) spectra of the 15N-eIF4E/4E-BP144–87 complex and of the eIF4E/15N-4E-BP144–87 were well-dispersed (Fig. S3). 15N NMR relaxation experiments showed that only the terminal residues 44–51 and 85–87 are dynamic in solution (Fig. 1B). We removed residues 85–87 but kept residues 44–51 to include the T46 phosphorylation site in the final construct (4E-BP144–84). The eIF4EΔ27/m7GTP/4E-BP144–84 complex crystallized in space group P21 (P1211) and yielded measurable diffraction to a minimum Bragg spacing of 2.1 Å.
Fig. 1.
eIF4E/m7GTP/4E-BP1 complex. (A) Sequence of 4E-BP1. Relevant motifs (underlined), phosphorylation sites (stars), and constructs used in this study (lines of different length) are indicated. (B) 4E-BP1 flexibility probed by relaxation studies. R1 (Left), R2 (Middle), and heteronuclear NOE (Right) data are shown for a sample of 400 μM 13C,15N-4E-BP144–87 bound to eIF4E/m7GTP in 95:5 H2O/D2O at pH 6.5. Data points corresponding to unassigned residues or residues that could not be measured are shown in black and given an arbitrary negative value. (C) Ribbon diagram (side view) of eIF4E33–217/m7GTP/4E-BP150–84. eIF4E and 4E-BP1 are shown in blue and red, respectively. (D) Ribbon diagram of the complex described in C, but showing a dorsal view of the complex.
Fig. S1.
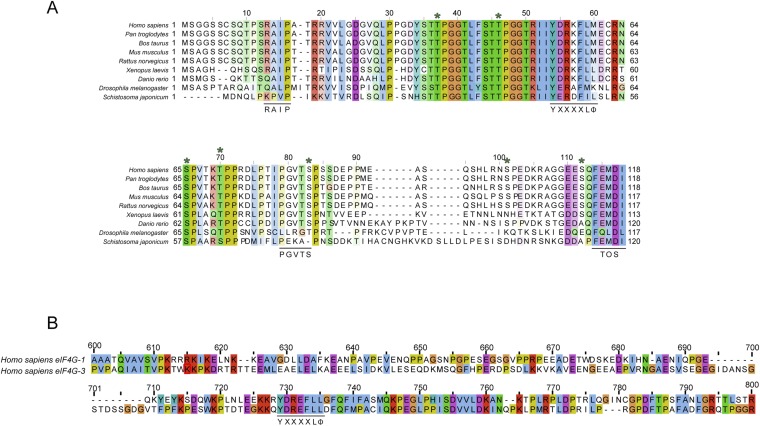
Amino acid alignments. Residues are colored according to ClustalX color scheme (57). (A) Sequence alignment of 4E-BP1. Relevant 4E-BP1 motifs are underlined (RAIP, TOS motif, YXXXXLΦ, PGVTS/T). Asterisks indicate phosphorylation sites (S35, T40, T46, T50, S65, T70, S83, S101, and S112). (B) Sequence alignment of eIF4G-1 and eIF4G-3 residues 600 and 800 containing the consensus eIF4E binding motif YXXXXLΦ (underlined).
Fig. S2.
eIF4E/m7GTP/4E-BP1 protein complex preparation and limited proteolysis. (A) SDS/PAGE analysis of recombinant eIF4E/4E-BP1 full-length protein complex expressed in bacterial cells and purified over an m7GTP-Sepharose column. (B) SDS/PAGE analysis of the purified fractions obtained after S75 gel filtration chromatography, containing eIF4E/m7GTP/4E-BP1 after TEV cleavage. The same procedure was used to express and purify other complexes mentioned in this study. (C) Protein eIF4E and 4E-BP1 full-length are indicated. Fragments generated (a, b, and c) from the eIF4E/4E-BP1 complex digested for different time by subtilisin were separated by HPLC and submitted to mass spectrometry analysis (LC-MS/MS).
Fig. S3.
15N HSQC of eIF4E/m7GTP and 4E-BP144–87 in the complex form. 2D [1H, 15N] TROSY-HSQC spectrum of eIF4E (A) and 4E-BP144–87 (B) in the bound form acquired on a 900-MHz spectrometer (∼0.4 mM in 25 mM sodium phosphate, 50 mM NaCl, 2 mM DTT buffer at pH 6.5).
Structure of eIF4E Bound to m7GTP and 4E-BP1.
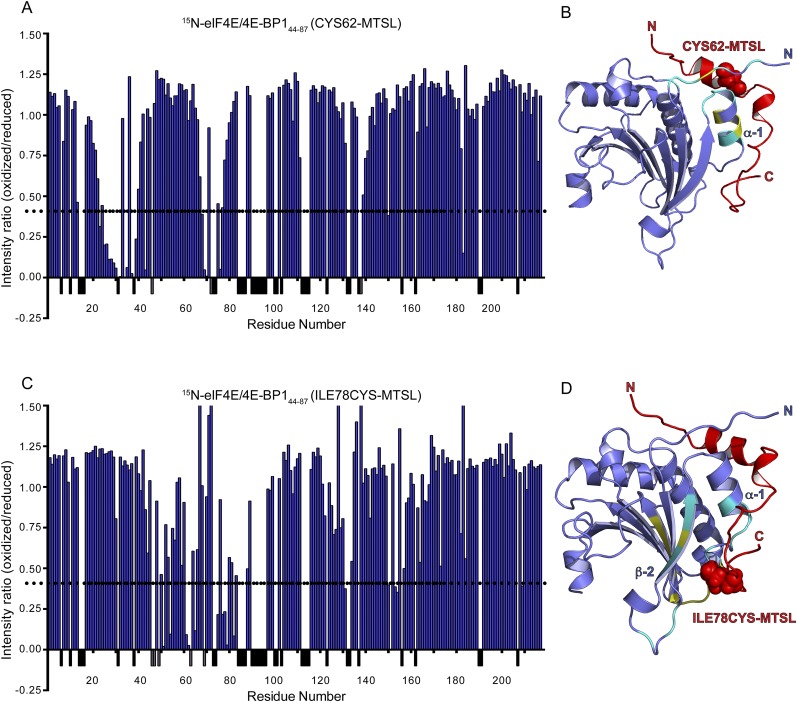
We determined the structure by molecular replacement with the structure of an eIF4EΔ27/m7GTP/4E-BP147–66 complex (PDB ID code 1WKW) (22) as a search model, followed by iterative model building and refinement (Table S1). The final model has two copies of the complex in the asymmetric unit. Of the two copies, the more complete model contains eIF4E residues 33–217, 4E-BP1 residues 50–84, and m7GTP (rms between the two copies is 0.261 over Cα positions for 179 atoms) (Fig. 1 C and D). 4E-BP1 residues 44–49, including the phosphorylation site T46, are disordered in both copies of the complex. The structure of eIF4E is identical to those previously described, with eight antiparallel β-strands (4E β-1 to β-8), three α-helices on its dorsal side (4E α-1 to α-3), and m7GTP sandwiched between W56 and W102 (23, 35). In addition to the previously described α-helix including the 54YXXXXLΦ60 consensus motif (19) (BP α-I), 4E-BP1 contains a small 310 helical segment (BP α-II) and an extended hook-shaped loop (“C-terminal loop”). To validate our structure in solution, we attached S-(1-oxyl-2,2,5,5-tetramethyl-2,5-dihydro-1H-pyrrol-3-yl)methyl methanesulfonothioate (MTSL) spin labels at two different positions in 4E-BP1 (the native C62 and a I78C mutant). We observed paramagnetic relaxation enhancements (PREs) at eIF4E resonances that were fully consistent with the crystal structure of the complex (Fig. S4) and with the 15N relaxation data shown in Fig. 1B. Our structure is also in agreement with a recently described structure of an eIF4E33–217/m7GTP/4E-BP149–83 complex (rms of 0.250 over Cα positions for 150 atoms) (36).
Table S1.
Data collection and refinement statistics (molecular replacement)
| Data collection and refinement | eIF4E33–217/m7GTP/4E-BP150–84 |
| Data collection | |
| Space group | P21(P1 21 1) |
| Cell dimensions | |
| a, b, c, Å | 67.61, 67.83, 79.08 |
| α, β, γ, ° | 90, 112.43, 90 |
| Resolution, Å | 50–2.1 (2.14–2.1)* |
| Rsym or Rmerge | 0.08 (0.48) |
| I/σI | 21.8 (2.0)* |
| Completeness, % | 96.9 (92.4)* |
| Redundancy | 3.3 |
| Refinement | |
| Resolution, Å | 38.6–2.1 |
| No. of reflections | 37,620 |
| Rwork/Rfree | 0.16/0.20 |
| No. of atoms | |
| Protein | 3,486 |
| Ligand/ions | 66 |
| Water | 218 |
| B-factors, Å2 | |
| Protein | 46.9 |
| Ligand/ions | 55.2 |
| Solvent | 45.1 |
| rms deviations | |
| Bond lengths, Å | 0.012 |
| Bond angles, ° | 1.31 |
| PDB ID code | 5BXV |
One crystal was used to collect the dataset.
Values in parentheses are for the highest-resolution shell.
Fig. S4.
Paramagnetic relaxation enhancement experiments. (A and C) Ratio of the intensities (Ioxidized/Ireduced) of eIF4E/m7GTP amide resonances monitored by 15N-1H-TROSY-HSQC bound to 4E-BP144–87. 4E-BP1 contains either an oxidized or a reduced form of MTSL spin label attached at position 62 or at position 78. A dashed line represents a 60% decrease in intensity. (B and D) Ribbon diagram of eIF4E/m7GTP/4E-BP1 crystallographic structure, where residues with more than 60% reduction in intensity are shown in cyan. Unassigned eIF4E residues located within an area affected by the presence of the MTSL (red dot spheres) are highlighted in yellow.
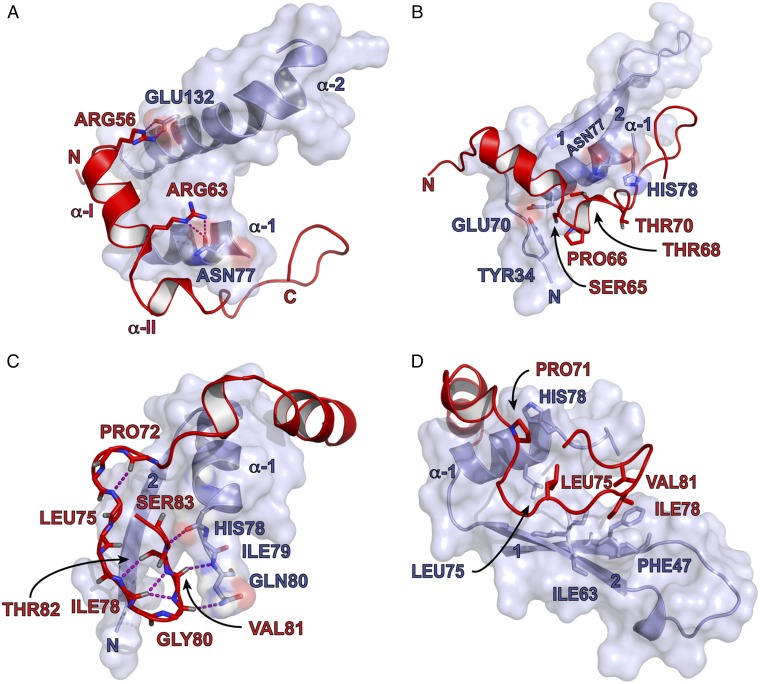
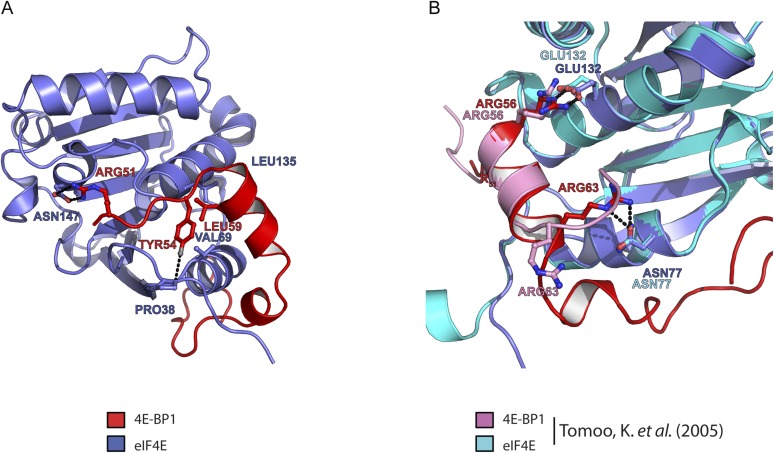
4E-BP144–84 can be divided into three interaction motifs. Motif 1 (M1, residues T50 to N64) comprises an extended N-terminal segment followed by the BP α-I helix, which includes the 54YXXXXLΦ60 segment (Fig. 2A and Fig. S5). In our structure, the BP α-I helix is extended by two residues (C62 and R63) and flanked by two intermolecular salt bridges formed by 4E-BP1 residues R56 and R63 with eIF4E residues E132 and N77, respectively.
Fig. 2.
4E-BP1 interacting motifs with eIF4E/m7GTP. Parts of the eIF4E structure are omitted for clarity. Key residues are indicated. (A) Motif 1 is centered on 4E-BP1’s R56 and R63. (B) Motif 2 is centered on 4E-BP1’s proline-turn (P66). (C and D) Motif 3 is centered on 4E-BP1’s C-terminal loop. Hydrogen bonds or hydrophobic interactions are highlighted.
Fig. S5.
Overview of motif 1 (encompassing 54YXXXXLΦ60), centered on 4E-BP1 Y54. (A) 4E-BP1 and eIF4E are, respectively, represented in blue and red. The hydroxyl group of 4E-BP1 Y54 is hydrogen bonded with eIF4E P38 whereas its aromatic ring is surrounded by the side chains of F58 and L59 in 4E-BP1 and by the side chain of V69 of eIF4E. (B) Overlay (centered on motif 1) of eIF4E33–217/m7GTP/4E-BP144–84 structure with another eIF4E/m7GpppA/4E-BP136–70 structure (PDB ID code 1WKW) described by Tomoo et al. (22), where eIF4E and 4E-BP1 are, respectively, in cyan and pink. Structures were aligned using PyMOL, showing a dorsal view of the complex.
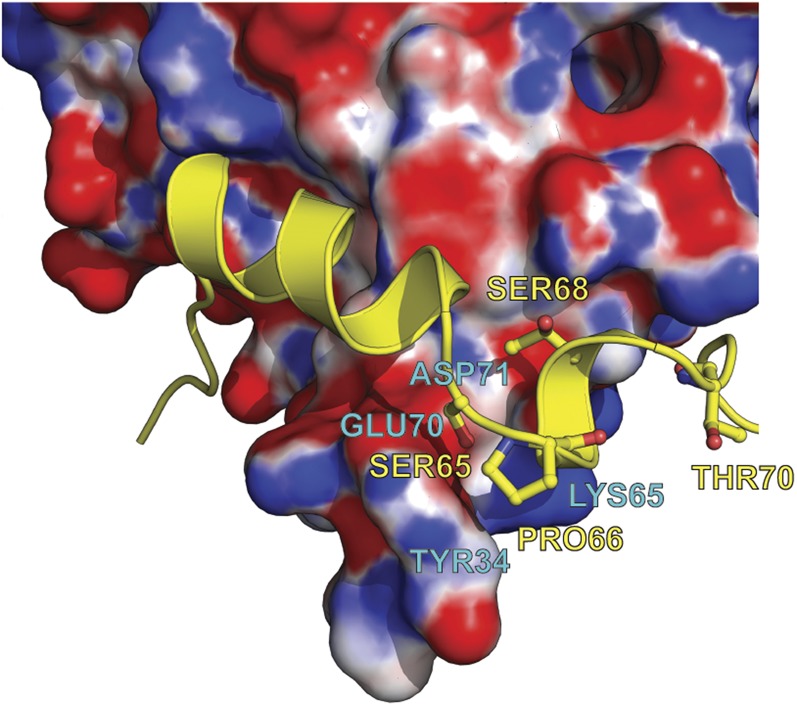
The phosphorylation sites S65 and T70 define the borders of motif 2 (M2), which is centered on P66 (Fig. 2B). The latter residue terminates the BP α-I. M2 lies in a groove formed by eIF4E residues Y34, E70, N77, and H78, explaining why T70 is phosphorylated before S65 (5, 6): the solvent accessibilities of their side chains are 70% and 11%, respectively, as determined using Protein Interfaces, Structures, and Assemblies (PISA) (37). Phosphorylation of T70 could trigger a partial structural rearrangement increasing the solvent exposure of S65, thus facilitating its phosphorylation. Phosphorylation of S65 is likely to induce dissociation, because of its proximity to the negative charge on eIF4E E70 (∼4.9 Å) (Fig. S6).
Fig. S6.
Electrostatic potential mapped onto the eIF4E surface at the 4E-BP1 motif 2 binding site. Positive and negative potentials are shown in blue and in red, respectively. For clarity, 4E-BP1 is represented in yellow. Residue S65 of 4E-BP1 is buried whereas T70 is solvent-exposed.
The C-terminal loop of 4E-BP144–84 forms motif 3 (M3, residues P71 to P84), which is sandwiched between 4E α-1 and 4E β-2. M3 is stabilized by intramolecular hydrogen bonds involving 4E-BP1 P72, L75, I78, V81, T82, and S83 (Fig. 2C). Residues V81 to S83 of 4E-BP1 create a short antiparallel β-interaction with eIF4E residues H78 to Q80, extended by a hydrogen bond between the backbone carbonyl of 4E-BP1 G80 with the side chain of eIF4E Q80. The C-terminal loop is further stabilized by hydrophobic interactions: 4E-BP1 L75, I78, and V81 sit in a pocket formed by eIF4E residues F47, I63, and L75, and the side chain of eIF4E residue H78 stacks against 4E-BP1 P71 (Fig. 2D).
The C-Terminal Loop of 4E-BP1 Is Required to Inhibit Cap-Dependent Translation.
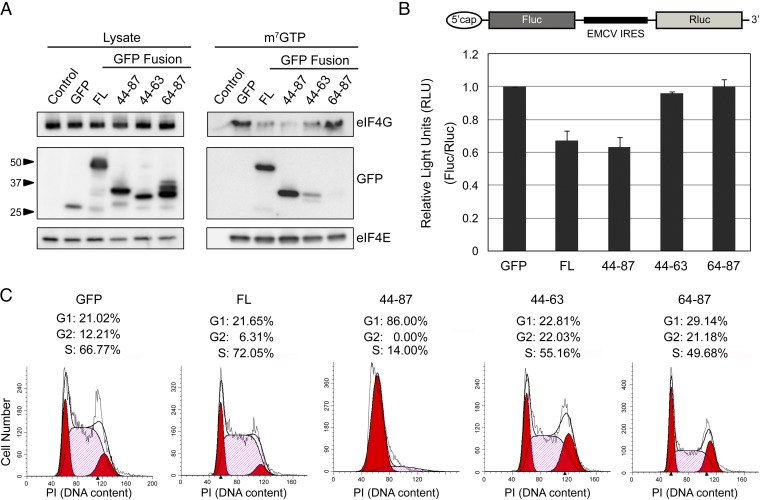
To study the importance of the C-terminal loop in the inhibition of translation initiation, we expressed GFP-fusion proteins comprising full-length 4E-BP1 (4E-BP1FL), 4E-BP144–87, 4E-BP144–63 (including M1), or 4E-BP164–87 (including M2 and M3), in mammalian cells. m7GTP pull-down experiments showed that 4E-BP1FL and 4E-BP144–87 both bound eIF4E and disrupted its interaction with eIF4G (Fig. 3A). Although 4E-BP144–63 bound less efficiently to eIF4E, it could still perturb the interaction between eIF4G and eIF4E. 4E-BP164–87 did not bind eIF4E and therefore did not disrupt the eIF4E/eIF4G interaction. To assess the activities of 4E-BP1 fragments in cultured mammalian cells, we used a dual-luciferase reporter system (29) in which the viral internal ribosome entry site (IRES) element of encephalomyocarditis virus (EMCV) is positioned between genes encoding Firefly luciferase (Fluc) and Renilla luciferase (Rluc) proteins. In this system, Fluc and Rluc expression results from cap-dependent or cap-independent translation initiation, respectively. We cotransfected HEK293 cells with the dual-reporter and with plasmids encoding various 4E-BP1 fragments described above (Fig. 3B). As expected, 4E-BP1FL and 4E-BP144–87 efficiently inhibited cap-dependent translation (35% reduction). 4E-BP164–87, which did not bind eIF4E (Fig. 3A), failed to inhibit translation initiation. Although 4E-BP144–63 binds to eIF4E and disrupts the eIF4E/eIF4G interaction (Fig. 3A), this fragment did not inhibit translation initiation. Thus, even though a fragment encompassing M1 can bind to eIF4E, M2 and M3 are required for full inhibition of translation initiation in cells.
Fig. 3.
Effects of 4E-BP1’s C-terminal loop. (A) Cells were transfected with plasmids encoding GFP or the 4E-BP1 fragments described in Fig. 1A (FL, full-length), and eluates of an m7GTP column were analyzed by Western blotting. (B) Diagram representing a dual-luciferase reporter system where an IRES (EMCV) is inserted between genes encoding the Firefly luciferase (Fluc) and the Renilla luciferase (Rluc). Cells were cotransfected with this plasmid and with the GFP/4E-BP1 constructs described in A. (C) Cells were transfected with the GFP/4E-BP1 constructs described in A. GFP-positive cells were gated and analyzed for DNA content. The percentage of G1, G2, and S phase cells are shown.
Targeting the mTORC1–4E-BP1 pathway inhibits proliferation of mammalian cells (17). We therefore used a flow cytometry-based cell cycle analysis assay to investigate whether any 4E-BP1 fragments could suppress cell cycle progression. We analyzed the DNA content of cells expressing GFP-fused 4E-BP1 fragments, gated by their level of GFP fluorescence (Fig. 3C). Cells expressing 4E-BP144–63 or 4E-BP164–87 fragments progressed through the cell cycle just like cells expressing WT GFP. Although 4E-BP1FL reduced cell cycle progression to G2 by twofold, it did not completely arrest cells in the G1 phase as observed with 4E-BP144–87 fragment. 4E-BP144–87 lacks mTOR-dependent regulatory motifs [TOR signaling (TOS) and RAIP motifs] (Fig. 1A), which are necessary for the phosphorylation of T37/T46. Phosphorylation of T37/T46 induces partial folding of the N-terminal region of 4E-BP1, burying the consensus binding motif, which prevents its binding to eIF4E and exposes T70 and S65 for phosphorylation (38). We infer that 4E-BP144–87 binds tightly to eIF4E and can be neither displaced nor hyperphosphorylated, thus inducing G1 phase cell cycle arrest. In agreement with these results, cells expressing 4E-BP1FL T37A, 4E-BP135–87 T37A, or 4E-BP135–87 had similar G1 phase cell cycle arrest than that observed in cells expressing 4E-BP144–87 (Fig. S7).
Fig. S7.
Cell cycle analysis of mutant of 4E-BP1. HEK293 cells were transfected with plasmids encoding different 4E-BP1 fragments synthesized as fusion proteins, with GFP [35–87, full-length (FL) where Thr37 is mutated to an alanine (FL Thr37Ala), 35–87 where Thr37 is mutated to an Ala residue (35–87 Thr37Ala)]. Cells were stained with propidium iodide (PI) solution and fixed using 3% paraformaldehyde and 70% ethanol. GFP-positive cells were gated and analyzed for DNA content (PI). The percentage of G1, G2, and S phase cells are indicated and were determined by ModFit software.
4EGI-1 Binds to the eIF4E/m7GTP/4E-BP1 Complex.
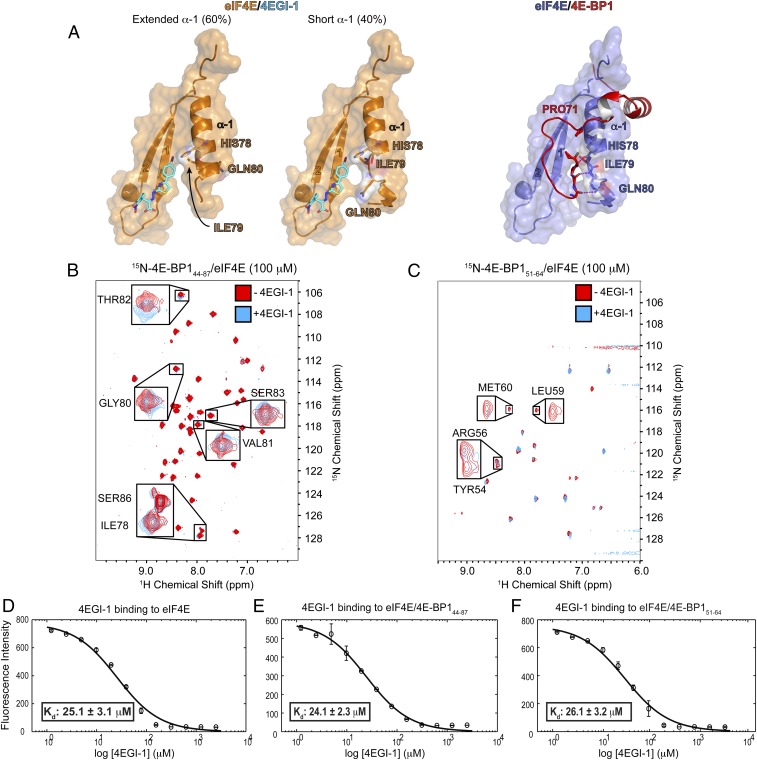
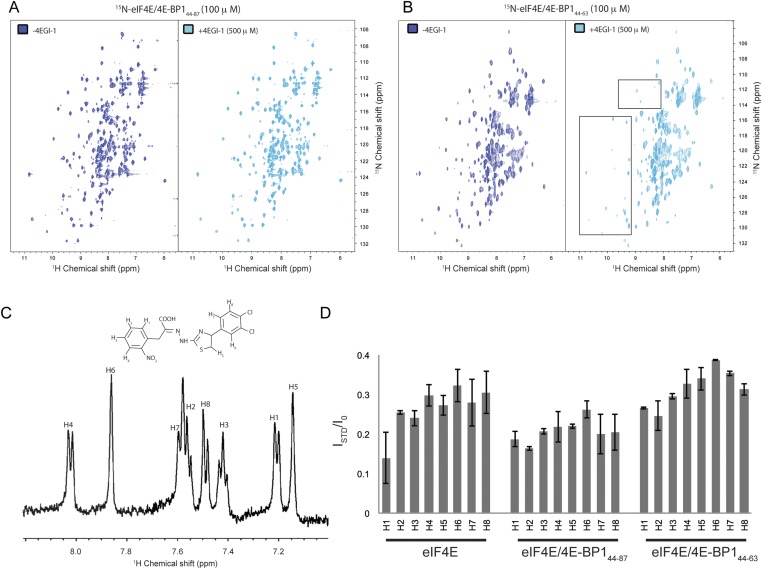
A recent structure describes the binding of the small translation initiation inhibitor, 4EGI-1, to eIF4E (32). 4EGI-1 promotes 4E α-1 to elongate C-terminally by half a turn. This extended helix, found in 60% of the eIF4E/4EGI-1 population, causes 4EGI-1 to allosterically displace eIF4G from eIF4E (Fig. 4A, Left and Middle). In contrast, the short antiparallel β-sheet interaction formed between 4E-BP1 M3 and 4E α-1 prevents the extension of this helix (Fig. 4A, Right). We thus used 2D [1H, 15N] TROSY-HSQC experiments to investigate how 4EGI-1 modulates the binding of 4E-BP1 to eIF4E. Adding up to 10-fold excess of 4EGI-1 did not revert the spectrum of eIF4E/15N-4E-BP144–87 to its free state: small, but yet significant, chemical shift perturbations were observed for the NH resonances corresponding to six residues of 4E-BP1 all located in its C-terminal loop (I78, G80, V81, T82, S83, S86) (Fig. 4B). This result shows that the compound is able to accommodate the C-terminal loop of 4E-BP1 without displacing the fragment of 4E-BP144–87 from eIF4E, indicating that 4EGI-1 binds to the 4E-BP1/eIF4E complex with the shorter α-1 helix. Overlay of the right two panels of Fig. 4A reveals only small clashes between the bromo-phenyl group of 4EGI-1 and the C-terminal loop of 4E-BP1. Furthermore, comparison of structures of different inhibitor complexes shows that this site of eIF4E is quite plastic. In contrast, 4EGI-1 caused severe peak broadening of the shorter 15N-4E-BP151–64 (lacking the C-terminal loop) in complex with unlabeled eIF4E (Fig. 4C). 4EGI-1 therefore displaces a short 4E-BP1 peptide (4E-BP151–64) but not a long fragment of 4E-BP1 (4E-BP144–87). We conducted the same 4EGI-1 titration experiments as described above, but where eIF4E is 15N-labeled. We observed that the addition of 4EGI-1 to the 15N-eIF4E/4E-BP144–87 complex resulted in minor chemical shift changes, showing that 4EGI-1 still binds to eIF4E even when the latter is associated with 4E-BP1. The addition of 4EGI-1 to the 15N-eIF4E/4E-BP144–63 complex (devoid of the C-terminal loop) caused severe peak broadenings in the eIF4E spectrum (Fig. S8 A and B). This observation is in agreement with the short 4E-BP1 fragment being displaced from eIF4E upon 4EGI-1 binding.
Fig. 4.
Effect of 4EGI-1 on the eIF4E/m7GTP/4E-BP1 complex. (A) Comparison of a portion of the eIF4E/m7GTP/4EGI-1 (PDB ID code 4TPW, Left and Middle) and eIF4E/m7GTP/4E-BP1 (Right) structures. (B) HSQC spectrum of unlabeled eIF4E/m7GTP bound to 15N-4E-BP144–87, in the absence (red) or presence (cyan) of 4EGI-1. Residues showing minor chemical shift perturbations are boxed and enlarged. (C) HSQC spectrum as described in B, but where unlabeled eIF4E/m7GTP is bound to 15N-4E-BP151–64. Residues within the eIF4E 54YXXXXLΦ60 consensus-binding motif for which the peaks are broadened and disappear almost completely after the addition of 4EGI-1 are boxed and enlarged. (D–F) Fluorescence intensity quenching assay for 4EGI-1 binding to eIF4E, to eIF4E/m7GTP/4E-BP144–87, or to eIF4E/4E-BP151–64.
Fig. S8.
eIF4E/m7GTP/4E-BP1 complex with 4EGI-1. (A) 2D [1H, 15N] TROSY-HSQC correlated spectrum of 15N-eIF4E/m7GTP bound to 4E-BP144–87 or to (B) 4E-BP144–63, in absence (blue) or presence (cyan) of 4EGI-1. Slight overall chemical shift perturbations can be observed for 15N-eIF4E/m7GTP bound to 4E-BP144–87 upon addition of 4EGI-1. The peaks that are boxed in B are those for which intensities are severely reduced upon titration of 4EGI-1. (C) 1H-NMR spectrum of 4EGI-1 compound showing peak assignment for the aromatic region. 4EGI-1 molecular structure is shown in the upper part of the panel. (D) Saturation-transfer difference (STD) experiments, where magnetization is transferred form eIF4E alone or eIF4E complexed to 4E-BP144–87 or to 4E-BP144–63 to 4EGI-1. ISTD/I0 ratios for each 4EGI-1 aromatic ring proton in the presence of the different protein complexes are shown.
We also used a fluorescence-quenching assay (29) to measure the apparent equilibrium dissociation constants (Kd) for 4EGI-1 binding to eIF4E, eIF4E/4E-BP144–87, and eIF4E/4E-BP151–64. Although the affinities of 4EGI-1 for eIF4E alone and for eIF4E/4E-BP151–64 are similar (Kd of ∼25 μM) (Fig. 4 D and E), including the C-terminal loop (eIF4E/4E-BP144–87) did not significantly affect the affinity of the small molecule for the complex (Kd of 24 μM) (Fig. 4F). This result is consistent with the crystal structure of the eIF4E/4EGI-1 complex, where both the short and the extended form of 4E α-1 are present (32). Thus, whereas the helix extension is needed for the small molecule to displace eIF4G, it is not necessary for its binding to eIF4E.
Discussion
In this study, we determined the crystal structure of eIF4E complexed with the m7GTP cap and with 4E-BP144–84. 4E-BP144–84 contains the consensus-binding motif 54YXXXXLΦ60 but also includes a segment that forms a “hook-shape loop” structure once complexed to eIF4E. This segment contains the 78IPGVS/T82 sequence, which was previously suggested to interact with a remote binding interface on eIF4E (23, 26–28, 39). However, the atomic details of this interaction remained elusive until very recently, limiting our understanding of its contribution to the inhibition of translation initiation. As we were preparing this manuscript, the structure of an eIF4E33–217/m7GTP/4E-BP149–83 complex (similar to the structure described in this study) was published (36). Both structures show that P79 brings about a sharp turn in the C-terminal of 4E-BP1 and that 80GVS/T82 forms a short antiparallel β-interaction with eIF4E. More recently, this binding interface was also found in homologs of the eIF4E/4E-BP complex from Drosophila melanogaster (36, 40), suggesting that the interaction between eIF4E and the nonconsensus motif is widespread among eIF4E binding proteins.
The binding of 4E-BP1 to eIF4E is highly regulated through phosphorylation. The residue S65 is the last site to be phosphorylated before 4E-BP1 dissociates from eIF4E (5, 41). The phosphorylation of S65 causes the greatest reduction in the binding affinity to eIF4E and the most pronounced effect on the ability of 4E-BP1 to inhibit cap-dependent translation (42, 43). In agreement with these results, our structure shows that, in M2, the side chain of S65 is buried in a concave surface of eIF4E whereas other phosphorylation sites, such as T70 (located at the end of M2), are solvent-exposed. We propose that the main function of the C-terminal loop of 4E-BP1, more specifically of M3 comprising the 80GVS/T82 described above, is to constrain the conformation of M2, which includes S65 and T70, and to maintain their side chains in the proper orientation to ensure hierarchical phosphorylation. Because M3 constitutes a second binding site on eIF4E, it also tethers the C-terminal loop of 4E-BP1 to eIF4E whereas the N terminus of 4E-BP1 gets phosphorylated over residues T37/T46. The N-terminal segment of the homolog 4E-BP2 adopts a four-stranded β-domain structure when residues T37/T46 are phosphorylated. This structure was suggested to sequester the helical 54YXXXXLΦ60 motif of 4E-BP2 into a partially buried β-strand, causing dissociation from eIF4E (38). Our structure does not contain 4E-BP1 residues T37/T46, and it is still unclear how the phosphorylation of these residues affects the successive phosphorylation of T70.
Our crystal structure shows that the C-terminal loop (motif 3) of 4E-BP1 and 4EGI-1 bind to a partially overlapping site on eIF4E. Using NMR experiments, we found that 4EGI-1 displaces a 4E-BP1 fragment that does not contain a C-terminal loop (Figs. 2D and 4A). We thus concluded that the allosteric effect of 4EGI-1 is maintained (extension of 4E α-1 by half a turn and dissociation of a short 4E-BP or eIF4G peptide containing the M1 motif alone) (32) only when the short antiparallel β-interaction between eIF4E and the C-terminal loop of 4E-BP1 is not present. Consistently, the same severe peak broadening observed when 4EGI-1 was added to a 15N-labeled eIF4E/eIF4G-IIpeptide complex (32) was also observed when 4EGI-1 was added to the 15N-eIF4E/4E-BP144–63 complex (Fig. S8). NMR and fluorescence quenching experiments also show that 4EGI-1 binds to eIF4E, even when eIF4E is complexed with a 4E-BP1 fragment containing the canonical eIF4E binding motif (M1) and the C-terminal loop of 4E-BP1 (M3). We propose that 4EGI-1 has an additive effect with 4E-BP1, where both inhibit translation initiation by allowing their respective interactions with eIF4E to be maintained.
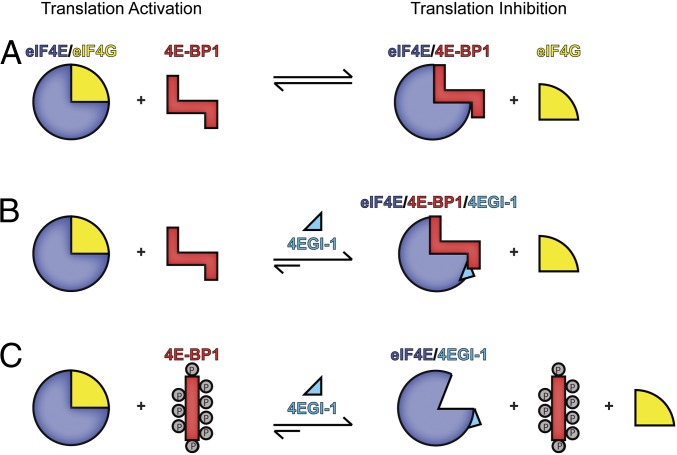
We now understand why 4EGI-1 displaces eIF4G but enhances the binding of 4E-BP1 (29) (Fig. 5). In the absence of 4EGI-1, both 4E-BP1 and eIF4G bind tightly to eIF4E (Fig. 5A). Indeed, unphosphorylated 4E-BP1 and eIF4G-I have similar affinities for eIF4E (15 nM and 27 nM, respectively) (19), and both ligands are pulled down in cap affinity binding experiments (29). Addition of 4EGI-1 allosterically dissociates eIF4G from eIF4E but does not affect binding of 4E-BP1 (Fig. 5B). Thus, with eIF4G being unable to bind to eIF4E, eIF4G can no longer compete with 4E-BP1—leading to the increased binding of 4E-BP1 to eIF4E. Furthermore, if 4E-BP1 dissociates from eIF4E because of its hyperphosphorylation, 4EGI-1 substitutes 4E-BP1 in preventing eIF4G from binding to eIF4E (Fig. 5C). Thus, 4EGI-1 provides an additive tumor-suppressive activity, even if erroneously up-regulated kinase signaling pathways inactivate 4E-BP1. The insights from the structures of eIF4E bound to 4E-BP1 and the dynamically associated 4EGI-1 show the mechanism of the dual activity of the inhibitor for dissociating eIF4G and stabilizing the binding of the tumor suppressor 4E-BP1. Because of the bipartite nature of the interaction between 4E-BP1 and eIF4E, it was proposed that bipartite inhibitors should be more potent than monopartite inhibitors, such as 4EGI-1 (36). Our data suggests that monopartite inhibitors can be very potent, as long as they do not interfere with the interaction between the C-terminal loop of 4E-BP1 and eIF4E.
Fig. 5.
Model of 4EGI-1’s action in cells. (A) Cellular concentrations of eIF4G versus unphosphorylated 4E-BP1 determine which of the two ligands bind to eIF4E, thus activating or inhibiting translation initiation. (B) Addition of 4EGI-1 destabilizes eIF4G binding. (C) When the drug is present during translation and 4E-BP1 is hyperphosphorylated (cannot bind to eIF4E), 4EGI-1 will bind to eIF4E, causing eIF4G to dissociate from eIF4E, inhibiting translation.
The molecular mechanism we describe of an inhibitor dissociating a tumor-promoting protein (eIF4G) and stabilizing a tumor suppressor (4E-BP1) is unique. Understanding the molecular details of these effects may facilitate design of more potent inhibitors that optimize dissociation of eIF4G and stabilization of 4E-BP1 binding to eIF4E. The latter aspect was not evident from the structure of the eIF4E/4EGI-1 complex (5) alone.
Materials and Methods
Constructs and Protein Purification.
We used PCR to amplify different lengths of cDNA coding for human 4E-BP1 (residues 1–118, 17–118, 35–87, 44–118, 44–87, 44–84, 44–63, 51–64, and 64–87) and subcloned them into a pH-GB1 Escherichia coli expression vector. 4E-BP1 fragments were inserted such that they are expressed as fusion proteins with a hexahistidine, a protein G B1 domain solubility enhancement tag (GB1) (44), and a TEV cleavage site at their N terminus, generating pH-GB1-Tev-4E-BP1 constructs. We also subcloned the above-described constructs of 4E-BP1 into a pcDNA3-eGFP [enhanced green fluorescent protein (eGFP)] mammalian expression vector using HindIII-XhoI restriction sites (Addgene plasmid 13031). This construct allowed the expression of the 4E-BP1 fragments as fusion proteins with eGFP at their C terminus (pCDNA3.1-eGFP/4E-BP1 constructs). The plasmids encoding different fragments of mouse eIF4E [full-length or Δ27 (27 residues deleted at its N terminus)], with the addition of a GB1-tag followed by a TEV cleavage site at their N terminus (pET-GB1/TEV/eIF4E derivatives), have been described previously (32). Human eIF4E and mouse eIF4E are nearly identical, with three residues being different: P12T, T17A, and E174D. Of these three differences between the mouse and human eIF4E, only residue E174 is part of the eIF4E construct that was used to crystallize the complex of eIF4E/m7GTP/4E-BP1.
E. coli (BL21) cells were transformed with the appropriate plasmids and grown in Luria Broth (LB) or minimal media (M9). 4E-BP1 protein expression was induced with 1 mM isopropyl β-d-1-thiogalactopyranoside, and cells were grown at 20 °C for 16 h. Cells were harvested and resuspended in a binding buffer (4E-BP1 BB) containing 20 mM NaH2PO4/Na2HPO4, pH 7.8, 500 mM NaCl, 10 mM imidazole, 5 mM 2-β-mercaptoethanol, benzonase, and 0.1 mM phenylmethylsulphonyl fluoride (PMSF). Cells were lysed by sonication at 4 °C and centrifuged at 38,000 × g for 40 min. The supernatant was loaded on a metal-affinity column (Ni-NTA; Qiagen) previously equilibrated with a PMSF-free 4E-BP1 BB. The Ni-NTA resin with the bound proteins was rinsed with a wash buffer (4E-BP1 WB) containing 20 mM NaH2PO4/Na2HPO4, pH 7.8, 500 mM NaCl, 50 mM imidazole, and 5 mM 2-mercaptoethanol. Proteins were eluted from the resin with an elution buffer (4E-BP1 EB) containing 20 mM NaH2PO4/Na2HPO4, pH 7.8, 500 mM NaCl, 200 mM imidazole, and 5 mM 2-mercaptoethanol. When required, an overnight digestion with TEV protease was used to cleave the H-GB1 tag. This tag was separated by reloading the sample onto the metal-affinity column, once diluted 10-fold against the initial 4E-BP1 BB. The eluted proteins were concentrated by ultrafiltration through a 15-mL, 3-kDa cutoff centrifuge filter to a final volume of 2 mL and further purified through a size-exclusion chromatography using a Superdex 75 16/60 preparative column (GE Healthcare Bio-Sciences) previously equilibrated with a buffer (4E-BP1 FPLC buffer) containing 20 mM NaH2PO4/Na2HPO4, pH 7.8, 150 mM NaCl, and 5 mM tris(2-carboxyethyl)phosphine (TCEP). The 4E-BP1 fragments eluted as a single peak. The corresponding fractions were pooled, concentrated, or subjected to a buffer exchange when required (see below).
Mouse eIF4E (residues 1–217 or 27–217) was expressed in E. coli and purified as previously described (32, 45). Briefly, E. coli (BL21) cells were transformed with the appropriate pET-GB1-Tev-eIF4E expression plasmids. Cells were grown, harvested, lysed, and centrifuged (see above) with an eIF4E BB containing 20 mM Hepes, pH 7.4, 100 mM KCl, 0.005% IGEPALCA-630 (Sigma), an EDTA free protease inhibitor tablet, and benzonase. The supernatant was loaded on an adipic-agarose-m7GDP column (45) previously equilibrated with the same eIF4E BB. The adipic-agarose-m7GDP resin was then rinsed once with the eIF4E BB, and then with the same buffer supplemented with 0.1 mM GDP (eIF4E WB). Proteins were eluted with eIF4E BB containing 0.2 mM m7GTP (eIF4E EB). When required, N-terminal tags were cleaved using a TEV protease digestion and removed from eIF4E recombinant protein size-exclusion chromatography using a Superdex 75 16/60 preparative column (GE Healthcare Bio-Sciences) previously equilibrated with eIF4E FPLC buffer (20 mM NaH2PO4/Na2HPO4, pH 7.8, 150 mM NaCl, 5 mM TCEP). For eIF4E/m7GTP/4E-BP1 complex preparation, cells expressing eIF4E or 4E-BP1 were grown and harvested separately. Lysates were then mixed, and the recombinant protein complex was purified as described for eIF4E purification.
Limited Proteolysis, HPLC Purification, and Mass Spectrometry.
The eIF4E/m7GTP/4E-BP1 purified complex was diluted to 0.15 mg/mL with PBS and incubated with subtilisin at an enzyme-to-substrate mass ratio of 1:50 at 37 °C. The reaction was followed for 1 h. The digestion was quenched by the addition of 1 mM PMSF and analyzed by SDS/PAGE. Degradation products were further separated and purified by reverse-phase HPLC. Single peak fractions were pooled and subjected to micro capillary LC-MS/MS analysis using an Orbitrap mass spectrometer (Thermo Scientific) from the Taplin Mass Spectrometry Facility of Harvard Medical School (Fig. S2).
Crystallization, Data Collection, and Structure Determination.
The eIF4EΔ27/m7GTP/4E-BP144–84 complex was purified as described above and passed over a Superdex 75 column previously equilibrated with a buffer containing 5 mM Tris⋅HCl (pH 7.5), 100 mM NaCl, and 1 mM DTT. Crystals grew at room temperature in reservoir buffer containing 0.1 M Tris⋅HCl, pH 8.4, and 22% (wt/vol) polyethylene glycol 4000. Crystals were flash frozen in reservoir buffer containing 10% (vol/vol) glycerol for data collection. The eIF4E/m7GTP/4E-BP1 complex crystallized in the P21 (P1211) space group, with unit cell dimensions of a = 67.6 Å, b = 67.8 Å, c = 79.1 Å, α = γ = 90.0°, β = 112.4° (Fig. 1 and Table S1), and contained two copies of essentially identical complexes (rms = 0.309 over 2,523 atoms) within the asymmetric unit. X-ray diffraction data up to 2.1-Å resolution of the complex was collected at 100 K at the Northeastern Collaborative Access Team (NE-CAT) beamline ID-24E at the Advance Photon Source (Argonne National Laboratory). Diffraction data were processed with an HKL-2000 (www.hkl-xray.com) (46), and the structure was determined by molecular replacement with PHASER (47) using eIF4E complexed to a 4E-BP1 peptide (PDB ID code 1WKW) as a search model. The model was built manually into density using COOT (48) and refined with PHENIX (49). The final model converged to an Rfree of 19.4% and an Rwork of 16.8%. Of all residues, 98.1% were in the most favored region of the Ramachandran space, with the additional 1.9% being in the allowed regions defined by PROCHECK (50). The figures were generated using PyMOL (51). The electrostatic potential was calculated with the nonlinear Poisson–Boltzman equation in the APBS module of PyMOL (52). Solvent accessibility was determined using PISA (37). The coordinates of the eIF4EΔ27/4E-BP144–84 complex have been deposited in the Protein Data Bank (PDB ID code 5BXV).
NMR Experiments.
E. coli strain BL21 (DE3) cells expressing either eIF4E or 4E-BP1 fragments were grown in M9 minimal medial containing 95% (vol/vol) 2H2O supplemented with 15NH4Cl and 13C6-d-glucose, when required, as the sole nitrogen and carbon sources, respectively. Individual proteins or eIF4E/4E-BP1 complexes were purified as described in Constructs and Protein Purification. After size-exclusion purification, the buffer was exchanged to an NMR buffer [20 mM NaH2PO4/Na2HPO4, pH 6.5, 50 mM NaCl, 2 mM DTT, 5% (vol/vol) D2O, concentrated to 0.1–0.4 mM] using a desalting PD-10 column (GE Healthcare). NMR spectroscopy experiments were recorded at 298 K either on Bruker or Varian spectrometers, operating at high field strengths of 600, 750, and 900 MHz, all equipped with a cryogenically cooled probe (Fig. S3).
Backbone assignment.
The backbone assignments of eIF4E and 4E-BP1, alone and in complex (eIF4E/4E-BP1), were done using the TROSY version of the traditional backbone triple resonance experiments, namely HNCA, HNCOCA, HNCO, HNCACO, HNCACB, and HNCOCACB. In addition, a 15N dispersed NOESY-HSQC experiment was used to help with the assignment when necessary. The experiments on the protein complex were performed on samples where one of the partners was 15N- and 13C-labeled and the other was unlabeled. All NMR observable samples were deuterated, except for 4E-BP1 alone, where the sample was protonated. Nonuniform sampling in the two indirect dimensions was used to collect triple resonance data, where 12–15% of the indirect grid was sampled using Poisson gap sampling (53). The data were reconstructed and processed using the hmsIST program (54).
Titration experiments.
For titration experiments, 15N TROSY-HSQC spectra were recorded for eIF4E/m7GTP/4E-BP1complexes at a concentration of 100 μM, where one of the 15N-labeled partners was prepared as described above. The concentration of 4EGI-1 [E] isomer was gradually increased from 0.05 to 1 mM, giving a molar ratio of 0.5–10, relative to the protein concentration of the NMR sample (Fig. 4 and Fig. S8). Data were processed using NMRPipe (55) and visualized and analyzed using either CARA (cara.nmr.ch/doku.php) or Sparky (56).
Relaxation experiments.
Relaxation times T1 and T2 and heteronuclear NOE were measured using an eIF4E/m7GTP/13C-15N-4E-BP144–87 sample. TROSY-based experiments were used for T1, T2, and heteronuclear NOE measurements. Inversion recovery delays used for T1 experiments were 10, 20, 50, 100, 200, 300, 500, 800, 1,000, 1,200, 1,500, and 1,800 ms. For T2 experiments, the relaxation delays were 20, 40, 80, 97, 114, 130, and 140 ms. A compensating Carr–Purcell–Meiboom–Gill (CPMG) block was applied to all of the T2 experiments to ensure that the heating of all of the individual measurements was equivalent to that of the 140-ms experiment. Heteronuclear NOE experiments were performed when the saturation time was 2.5 s whereas the off-saturated time was 0 s. After data processing, peak intensities were extracted using Sparky (56), fitted to exponential decays, and transverse relaxation rates (R1, R2, and net NOE) were plotted in function of the residue number of 4E-BP1 (Fig. 1B).
Paramagnetic relaxation enhancement experiments.
15N-eIF4E/m7GTP was expressed and purified over an adipic-agarose-m7GDP column and further purified over a Superdex 75 16/60 preparative column previously equilibrated with a PRE buffer (containing 20 mM NaH2PO4/Na2HPO4, pH 7.8, 50 mM NaCl). All buffers used during protein purification for this set of experiments did not contain any reducing agents. 4E-BP1 fragments (44–87 WT, 44–87 C62A, and 44–87 C62A/I78C) were purified over Ni-NTA resin and followed by S75 size-exclusion chromatography, also eluted in a PRE buffer. Fractions corresponding to single elution peak were pooled and concentrated by ultrafiltration through a 4-mL, 3-kDa cutoff centrifuge filter to a final volume of 2.5 mL. MTSL (S-(1-oxyl-2,2,5,5-tetramethyl-2,5-dihydro-1H-pyrrol-3-yl)methyl methanesulfonothioate) was dissolved in acetonitrile, added to the purified 4E-BP1 fragments (5- to 10-fold excess vs. protein concentration), and incubated at 4 °C for 4 h. The 4E-BP1/MTSL samples were buffer exchanged over a PD-10 column (GE Healthcare) to fresh PRE buffer to remove any unreacted free MTSL. Purified 15N-eIF4E/m7GTP and 4E-BP1/MTSL fragments were mixed with a twofold excess of 4E-BP1/MTSL, incubated at room temperature for an hour, and concentrated to 2 mL Each sample was loaded on a Superdex 75 16/60 preparative column previously equilibrated with the NMR buffer without DTT and further concentrated to 300 μM. 15N TROSY-HSQC spectra were recorded on a Bruker Avance III 750 spectrometer. Each sample was measured in the absence (oxidized) and in the presence (reduced) of 15 mM ascorbic acid. After data processing, peak intensities were extracted using Sparky (56). The ratios of intensities (Ioxidized/Ireduced) of eIF4E amide resonances were compared and plotted as a function of the eIF4E primary sequence. The results were transferred to PyMOL for visualization of eIF4E/m7GTP residues affected by the presence of the PRE attached into 4E-BP144–87 (Fig. S4).
Saturation-transfer difference experiments.
Five micromolar eIF4E, eIF4E/m7GTP/4E-BP144–87, or eIF4E/m7GTP/4E-BP144–63 complex was buffer exchanged by PD-10 desalting column (GE Healthcare Life Sciences) into D2O-PBS (10 mM phosphate buffer, pH 7.4, 27 mM KCl, and 137 mM NaCl). The 4EGI-1 compound was dissolved in d6-DMSO (20 mM) and diluted to 300 μM with D2O-PBS. NMR experiments were performed at 298 K on a Bruker Avance-500 spectrometer equipped with a cryoprobe. The protein resonances were irradiated using an adiabatic wideband uniform-rate smooth truncation (WURST) pulse for 2 s, covering 1 ppm (500 Hz). The WURST pulse was centered at −0.5 ppm for on-resonance saturation and at −30 ppm for off-resonance saturation, and the data were collected in an interleaved manner (Fig. S8).
Fluorescence-Quenching Experiments.
Eight tryptophans in eIF4E can be quenched by the addition of the 4EGI-1 small molecule (previously described in ref. 32). Briefly, various protein constructs were purified from an adipic-agarose-m7GTP resin (eIF4E/m7GTP, eIF4E/m7GTP/4E-BP144–87, and eIF4E/m7GTP/4E-BP151–64). Proteins were further purified by size-exclusion chromatography using a Superdex 75 16/60 preparative column, preequilibrated with a buffer containing 20 mM Hepes, pH 7.8, and 50 mM NaCl, and concentrated down to 1 μM. The fluorescence measurement was performed in a 96-well plate (flat bottom, black background, Corning 3991) with 95 μL of protein solution. Using the 4EGI-1 [E] isomer, concentrations of 2,500 μM followed by twofold serial dilutions were added. Fluorescence intensity was measured using a top read from a FlexStation3 microplate reader. The results were fitted to a 1:1 binding equilibrium equation using the program GRAFIT 2.0, and the Kd, background fluorescence, and fluorescence intensity of 1 μM eIF4E were fitted as free parameters.
m7GTP Cap-Binding Affinity Assay.
HEK 293T cells were cultured in Dulbecco’s modified Eagle medium (DMEM) (Lonza), supplemented with 10% (vol/vol) FBS (Thermo Scientific) and penicillin/streptomycin (Lonza) to 70–80% confluence in T-25 flasks. Cells were transfected with 2 μg of the pcDNA3-eGFP plasmid or the plasmids encoding mouse 4E-BP1 fragments using Lipofectamine 2000 (Invitrogen) according to the manufacturer’s instructions. After 24 h, cells were lysed with a buffer containing 20 mM Tris⋅HCl, pH 7.6, 137 mM NaCl, 10% (vol/vol) Glycerol, 0.2% Triton X-100, 5 mM β-ME, and protease inhibitors. Cell lysates were incubated with an adipic-agarose-m7GDP resin for 4 h at 4 °C and washed three times using the lysis buffer. As a control, unconjugated adipic-agarose resin was used. Cell lysates and m7GTP-bound proteins were resolved by SDS/PAGE and analyzed by Western blotting using a monoclonal antibody against GFP (2956; Cell Signaling) and eIF4GI (8701; Cell Signaling) and a polyclonal antibody against eIF4E (9742; Cell Signaling). Chemiluminescence was analyzed on a Fuji LAS 3000 with Image Reader LAS-3000 software.
Translation Assay.
HEK 293T cells were cultured to 70% confluence in six-well plates. Cells were transfected with 500 ng of a bicistronic reporter construct pFL-EMCV-IRES-RL containing the firefly luciferase, followed by the EMCV IRES and the Renilla luciferase, and 500 ng of the pcDNA3-eGFP plasmid or the plasmids encoding mouse 4E-BP1 fragments using Lipofectamine 2000 (Invitrogen). Twenty-four hours posttransfection, the cells were lysed in 1× passive lysis buffer (Promega), and a luciferase activity was measured with a dual luciferase reporter assay system (Promega) using a Fluoroskan Ascent FL (Thermo Scientific).
Cell Cycle Analysis.
HEK 293T cells were cultured to 70% confluence in T-25 flasks. The HEK 293T cells were transfected with 2 μg of the pcDNA3-eGFP plasmid or of the pcDNA3-eGFP-4E-BP1 derivative plasmids using Lipofectamine 2000 (Invitrogen). After 24 h, the cells were trypsinized and washed twice with PBS. Fixation was performed using incubation with a fix solution [1× PBS, 2% (wt/vol) glucose, 3% (vol/vol) paraformaldehyde] for 10 min, followed by an incubation with 70% (vol/vol) ethanol for 1 h. Samples were pelleted and resuspended in a staining solution [0.1 mg/mL propidium iodide (PI) and 2 mg/mL RNase A in 1× PBS, 5 mM EDTA, 25 mM Hepes, pH 7.0, 1% BSA]. Samples were stored in the dark at 37 °C for 30 min before analysis. DNA contents were detected by a BD LSRFortessa cell analyzer (BD Biosciences). Collected data were interpreted using ModFit LT 3.3 software (Verity Software House) (Fig. 3).
Acknowledgments
We thank Uhn-Soo Cho and the staff at the Northeastern Collaborative Access Team (NE-CAT) for assistance with data collection, Donald D. Raymond for help with PDB deposition, Hiroyasu Ogawa and Andrew Lassar for assistance with luminometer operation, and the Dana-Farber Cancer Institute Flow Cytometry Facility for help with cell cycle experiments. NMR experiments were carried out in part at the Massachusetts Institute of Technology/Harvard Center for Magnetic Resonance, which is supported by NIH Grant P41 EB002026. We thank Stephen Harrison for discussion and critical reading of the manuscript. This study was supported by NIH Grants CA68262 and GM047467 (to G.W.). N.S. was supported by the Japan Society for the Promotion of Science, M.L.-A. reports support from Fonds de la Recherche en Santé au Québec, and E.P. was supported by a scholarship from the Alexander S. Onassis Public Benefit Foundation. This work is based upon research conducted at the Advanced Photon Source on the NE-CAT beamlines, which are supported by award GM103403 from the National Center for Research Resources at the National Institutes of Health. Use of the Advanced Photon Source is supported by the US Department of Energy, Office of Basic Energy Sciences, under Contract DE-AC02-06CH11357.
Footnotes
The authors declare no conflict of interest.
Data deposition: The atomic coordinates and structure factors have been deposited in the Protein Data Bank, www.pdb.org (PDB ID code 5BXV).
This article contains supporting information online at www.pnas.org/lookup/suppl/doi:10.1073/pnas.1512118112/-/DCSupplemental.
References
- 1.Sonenberg N, Hinnebusch AG. Regulation of translation initiation in eukaryotes: Mechanisms and biological targets. Cell. 2009;136(4):731–745. doi: 10.1016/j.cell.2009.01.042. [DOI] [PMC free article] [PubMed] [Google Scholar]
- 2.Shatkin AJ. mRNA cap binding proteins: Essential factors for initiating translation. Cell. 1985;40(2):223–224. doi: 10.1016/0092-8674(85)90132-1. [DOI] [PubMed] [Google Scholar]
- 3.Gingras AC, Raught B, Sonenberg N. eIF4 initiation factors: Effectors of mRNA recruitment to ribosomes and regulators of translation. Annu Rev Biochem. 1999;68:913–963. doi: 10.1146/annurev.biochem.68.1.913. [DOI] [PubMed] [Google Scholar]
- 4.Beretta L, Gingras AC, Svitkin YV, Hall MN, Sonenberg N. Rapamycin blocks the phosphorylation of 4E-BP1 and inhibits cap-dependent initiation of translation. EMBO J. 1996;15(3):658–664. [PMC free article] [PubMed] [Google Scholar]
- 5.Gingras AC, et al. Hierarchical phosphorylation of the translation inhibitor 4E-BP1. Genes Dev. 2001;15(21):2852–2864. doi: 10.1101/gad.912401. [DOI] [PMC free article] [PubMed] [Google Scholar]
- 6.Holz MK, Ballif BA, Gygi SP, Blenis J. mTOR and S6K1 mediate assembly of the translation preinitiation complex through dynamic protein interchange and ordered phosphorylation events. Cell. 2005;123(4):569–580. doi: 10.1016/j.cell.2005.10.024. [DOI] [PubMed] [Google Scholar]
- 7.Shin S, Wolgamott L, Roux PP, Yoon SO. Casein kinase 1ε promotes cell proliferation by regulating mRNA translation. Cancer Res. 2014;74(1):201–211. doi: 10.1158/0008-5472.CAN-13-1175. [DOI] [PubMed] [Google Scholar]
- 8.Shin S, et al. Glycogen synthase kinase-3β positively regulates protein synthesis and cell proliferation through the regulation of translation initiation factor 4E-binding protein 1. Oncogene. 2014;33(13):1690–1699. doi: 10.1038/onc.2013.113. [DOI] [PubMed] [Google Scholar]
- 9.Allard EK, Grujic M, Fisone G, Kristensson K. Prion formation correlates with activation of translation-regulating protein 4E-BP and neuronal transcription factor Elk1. Neurobiol Dis. 2013;58:116–122. doi: 10.1016/j.nbd.2013.05.014. [DOI] [PubMed] [Google Scholar]
- 10.Gkogkas CG, et al. Autism-related deficits via dysregulated eIF4E-dependent translational control. Nature. 2013;493(7432):371–377. doi: 10.1038/nature11628. [DOI] [PMC free article] [PubMed] [Google Scholar]
- 11.Silvera D, Formenti SC, Schneider RJ. Translational control in cancer. Nat Rev Cancer. 2010;10(4):254–266. doi: 10.1038/nrc2824. [DOI] [PubMed] [Google Scholar]
- 12.Avdulov S, et al. Activation of translation complex eIF4F is essential for the genesis and maintenance of the malignant phenotype in human mammary epithelial cells. Cancer Cell. 2004;5(6):553–563. doi: 10.1016/j.ccr.2004.05.024. [DOI] [PubMed] [Google Scholar]
- 13.Lazaris-Karatzas A, Montine KS, Sonenberg N. Malignant transformation by a eukaryotic initiation factor subunit that binds to mRNA 5′ cap. Nature. 1990;345(6275):544–547. doi: 10.1038/345544a0. [DOI] [PubMed] [Google Scholar]
- 14.De Benedetti A, Graff JR. eIF-4E expression and its role in malignancies and metastases. Oncogene. 2004;23(18):3189–3199. doi: 10.1038/sj.onc.1207545. [DOI] [PubMed] [Google Scholar]
- 15.Mamane Y, et al. eIF4E--from translation to transformation. Oncogene. 2004;23(18):3172–3179. doi: 10.1038/sj.onc.1207549. [DOI] [PubMed] [Google Scholar]
- 16.Grzmil M, Hemmings BA. Translation regulation as a therapeutic target in cancer. Cancer Res. 2012;72(16):3891–3900. doi: 10.1158/0008-5472.CAN-12-0026. [DOI] [PubMed] [Google Scholar]
- 17.Dowling RJ, et al. mTORC1-mediated cell proliferation, but not cell growth, controlled by the 4E-BPs. Science. 2010;328(5982):1172–1176. doi: 10.1126/science.1187532. [DOI] [PMC free article] [PubMed] [Google Scholar]
- 18.Mader S, Lee H, Pause A, Sonenberg N. The translation initiation factor eIF-4E binds to a common motif shared by the translation factor eIF-4 gamma and the translational repressors 4E-binding proteins. Mol Cell Biol. 1995;15(9):4990–4997. doi: 10.1128/mcb.15.9.4990. [DOI] [PMC free article] [PubMed] [Google Scholar]
- 19.Marcotrigiano J, Gingras AC, Sonenberg N, Burley SK. Cap-dependent translation initiation in eukaryotes is regulated by a molecular mimic of eIF4G. Mol Cell. 1999;3(6):707–716. doi: 10.1016/s1097-2765(01)80003-4. [DOI] [PubMed] [Google Scholar]
- 20.Brown CJ, Verma CS, Walkinshaw MD, Lane DP. Crystallization of eIF4E complexed with eIF4GI peptide and glycerol reveals distinct structural differences around the cap-binding site. Cell Cycle. 2009;8(12):1905–1911. doi: 10.4161/cc.8.12.8742. [DOI] [PubMed] [Google Scholar]
- 21.Gross JD, et al. Ribosome loading onto the mRNA cap is driven by conformational coupling between eIF4G and eIF4E. Cell. 2003;115(6):739–750. doi: 10.1016/s0092-8674(03)00975-9. [DOI] [PubMed] [Google Scholar]
- 22.Tomoo K, et al. Structural basis for mRNA Cap-Binding regulation of eukaryotic initiation factor 4E by 4E-binding protein, studied by spectroscopic, X-ray crystal structural, and molecular dynamics simulation methods. Biochim Biophys Acta. 2005;1753(2):191–208. doi: 10.1016/j.bbapap.2005.07.023. [DOI] [PubMed] [Google Scholar]
- 23.Matsuo H, et al. Structure of translation factor eIF4E bound to m7GDP and interaction with 4E-binding protein. Nat Struct Biol. 1997;4(9):717–724. doi: 10.1038/nsb0997-717. [DOI] [PubMed] [Google Scholar]
- 24.Gosselin P, et al. The translational repressor 4E-BP called to order by eIF4E: new structural insights by SAXS. Nucleic Acids Res. 2011;39(8):3496–3503. doi: 10.1093/nar/gkq1306. [DOI] [PMC free article] [PubMed] [Google Scholar]
- 25.Mizuno A, et al. Importance of C-terminal flexible region of 4E-binding protein in binding with eukaryotic initiation factor 4E. FEBS Lett. 2008;582(23-24):3439–3444. doi: 10.1016/j.febslet.2008.09.003. [DOI] [PubMed] [Google Scholar]
- 26.Umenaga Y, Paku KS, In Y, Ishida T, Tomoo K. Identification and function of the second eIF4E-binding region in N-terminal domain of eIF4G: Comparison with eIF4E-binding protein. Biochem Biophys Res Commun. 2011;414(3):462–467. doi: 10.1016/j.bbrc.2011.09.084. [DOI] [PubMed] [Google Scholar]
- 27.Paku KS, et al. A conserved motif within the flexible C-terminus of the translational regulator 4E-BP is required for tight binding to the mRNA cap-binding protein eIF4E. Biochem J. 2012;441(1):237–245. doi: 10.1042/BJ20101481. [DOI] [PubMed] [Google Scholar]
- 28.Lukhele S, Bah A, Lin H, Sonenberg N, Forman-Kay JD. Interaction of the eukaryotic initiation factor 4E with 4E-BP2 at a dynamic bipartite interface. Structure. 2013;21(12):2186–2196. doi: 10.1016/j.str.2013.08.030. [DOI] [PubMed] [Google Scholar]
- 29.Moerke NJ, et al. Small-molecule inhibition of the interaction between the translation initiation factors eIF4E and eIF4G. Cell. 2007;128(2):257–267. doi: 10.1016/j.cell.2006.11.046. [DOI] [PubMed] [Google Scholar]
- 30.Chen L, et al. Tumor suppression by small molecule inhibitors of translation initiation. Oncotarget. 2012;3(8):869–881. doi: 10.18632/oncotarget.598. [DOI] [PMC free article] [PubMed] [Google Scholar]
- 31.Yi T, Kabha E, Papadopoulos E, Wagner G. 4EGI-1 targets breast cancer stem cells by selective inhibition of translation that persists in CSC maintenance, proliferation and metastasis. Oncotarget. 2014;5(15):6028–6037. doi: 10.18632/oncotarget.2112. [DOI] [PMC free article] [PubMed] [Google Scholar]
- 32.Papadopoulos E, et al. Structure of the eukaryotic translation initiation factor eIF4E in complex with 4EGI-1 reveals an allosteric mechanism for dissociating eIF4G. Proc Natl Acad Sci USA. 2014;111(31):E3187–E3195. doi: 10.1073/pnas.1410250111. [DOI] [PMC free article] [PubMed] [Google Scholar]
- 33.Poulin F, Gingras AC, Olsen H, Chevalier S, Sonenberg N. 4E-BP3, a new member of the eukaryotic initiation factor 4E-binding protein family. J Biol Chem. 1998;273(22):14002–14007. doi: 10.1074/jbc.273.22.14002. [DOI] [PubMed] [Google Scholar]
- 34.Martineau Y, Azar R, Bousquet C, Pyronnet S. Anti-oncogenic potential of the eIF4E-binding proteins. Oncogene. 2013;32(6):671–677. doi: 10.1038/onc.2012.116. [DOI] [PubMed] [Google Scholar]
- 35.Marcotrigiano J, Gingras AC, Sonenberg N, Burley SK. Cocrystal structure of the messenger RNA 5′ cap-binding protein (eIF4E) bound to 7-methyl-GDP. Cell. 1997;89(6):951–961. doi: 10.1016/s0092-8674(00)80280-9. [DOI] [PubMed] [Google Scholar]
- 36.Peter D, et al. Molecular architecture of 4E-BP translational inhibitors bound to eIF4E. Mol Cell. 2015;57(6):1074–1087. doi: 10.1016/j.molcel.2015.01.017. [DOI] [PubMed] [Google Scholar]
- 37.Krissinel E, Henrick K. Inference of macromolecular assemblies from crystalline state. J Mol Biol. 2007;372(3):774–797. doi: 10.1016/j.jmb.2007.05.022. [DOI] [PubMed] [Google Scholar]
- 38.Bah A, et al. Folding of an intrinsically disordered protein by phosphorylation as a regulatory switch. Nature. 2015;519(7541):106–109. doi: 10.1038/nature13999. [DOI] [PubMed] [Google Scholar]
- 39.Igreja C, Peter D, Weiler C, Izaurralde E. 4E-BPs require non-canonical 4E-binding motifs and a lateral surface of eIF4E to repress translation. Nat Commun. 2014;5:4790. doi: 10.1038/ncomms5790. [DOI] [PMC free article] [PubMed] [Google Scholar]
- 40.Kinkerlin K, Veith K, Grunwald M, Bono F. Crystal structure of a minimal eIF4E-Cup complex reveals a general mechanism of eIF4E regulation in translational repression. RNA. 2012;18(9):1624–1634. doi: 10.1261/rna.033639.112. [DOI] [PMC free article] [PubMed] [Google Scholar]
- 41.Gingras AC, et al. Regulation of 4E-BP1 phosphorylation: A novel two-step mechanism. Genes Dev. 1999;13(11):1422–1437. doi: 10.1101/gad.13.11.1422. [DOI] [PMC free article] [PubMed] [Google Scholar]
- 42.Karim MM, et al. A quantitative molecular model for modulation of mammalian translation by the eIF4E-binding protein 1. J Biol Chem. 2001;276(23):20750–20757. doi: 10.1074/jbc.M011068200. [DOI] [PubMed] [Google Scholar]
- 43.Mothe-Satney I, Yang D, Fadden P, Haystead TA, Lawrence JC., Jr Multiple mechanisms control phosphorylation of PHAS-I in five (S/T)P sites that govern translational repression. Mol Cell Biol. 2000;20(10):3558–3567. doi: 10.1128/mcb.20.10.3558-3567.2000. [DOI] [PMC free article] [PubMed] [Google Scholar]
- 44.Bao WJ, et al. Highly efficient expression and purification system of small-size protein domains in Escherichia coli for biochemical characterization. Protein Expr Purif. 2006;47(2):599–606. doi: 10.1016/j.pep.2005.11.021. [DOI] [PubMed] [Google Scholar]
- 45.Edery I, Altmann M, Sonenberg N. High-level synthesis in Escherichia coli of functional cap-binding eukaryotic initiation factor eIF-4E and affinity purification using a simplified cap-analog resin. Gene. 1988;74(2):517–525. doi: 10.1016/0378-1119(88)90184-9. [DOI] [PubMed] [Google Scholar]
- 46.Otwinowski Z, Minor W. 1997. Processing of X-ray diffraction data collected in oscillation mode. Macromolecular Crystallography, Methods in Enzymology, eds Carter CW, Jr, Sweet RM (Academic, New York), Vol 276, pp 307–326.
- 47.McCoy AJ. Solving structures of protein complexes by molecular replacement with Phaser. Acta Crystallogr D Biol Crystallogr. 2007;63(Pt 1):32–41. doi: 10.1107/S0907444906045975. [DOI] [PMC free article] [PubMed] [Google Scholar]
- 48.Emsley P, Cowtan K. Coot: Model-building tools for molecular graphics. Acta Crystallogr D Biol Crystallogr. 2004;60(Pt 12 Pt 1):2126–2132. doi: 10.1107/S0907444904019158. [DOI] [PubMed] [Google Scholar]
- 49.Adams PD, et al. PHENIX: Building new software for automated crystallographic structure determination. Acta Crystallogr D Biol Crystallogr. 2002;58(Pt 11):1948–1954. doi: 10.1107/s0907444902016657. [DOI] [PubMed] [Google Scholar]
- 50.Laskowski RA, MacArthur MW, Moss DS, Thornton JM. PROCHECK: A program to check the stereochemical quality of protein structures. J Appl Cryst. 1993;26:283–291. [Google Scholar]
- 51.DeLano WL. 2002 The PyMOL Molecular Graphics System (DeLano Scientific, San Carlos, CA). Available at www.pymol.org.
- 52.Baker NA, Sept D, Joseph S, Holst MJ, McCammon JA. Electrostatics of nanosystems: Application to microtubules and the ribosome. Proc Natl Acad Sci USA. 2001;98(18):10037–10041. doi: 10.1073/pnas.181342398. [DOI] [PMC free article] [PubMed] [Google Scholar]
- 53.Hyberts SG, Takeuchi K, Wagner G. Poisson-gap sampling and forward maximum entropy reconstruction for enhancing the resolution and sensitivity of protein NMR data. J Am Chem Soc. 2010;132(7):2145–2147. doi: 10.1021/ja908004w. [DOI] [PMC free article] [PubMed] [Google Scholar]
- 54.Hyberts SG, Milbradt AG, Wagner AB, Arthanari H, Wagner G. Application of iterative soft thresholding for fast reconstruction of NMR data non-uniformly sampled with multidimensional Poisson Gap scheduling. J Biomol NMR. 2012;52(4):315–327. doi: 10.1007/s10858-012-9611-z. [DOI] [PMC free article] [PubMed] [Google Scholar]
- 55.Delaglio F, et al. NMRPipe: A multidimensional spectral processing system based on UNIX pipes. J Biomol NMR. 1995;6(3):277–293. doi: 10.1007/BF00197809. [DOI] [PubMed] [Google Scholar]
- 56.Goddard TD, Huang CC, Ferrin TE. Software extensions to UCSF chimera for interactive visualization of large molecular assemblies. Structure. 2005;13(3):473–482. doi: 10.1016/j.str.2005.01.006. [DOI] [PubMed] [Google Scholar]
- 57.Larkin MA, et al. Clustal W and Clustal X version 2.0. Bioinformatics. 2007;23(21):2947–2948. doi: 10.1093/bioinformatics/btm404. [DOI] [PubMed] [Google Scholar]


