Significance
Osmolytes influence protein structure by either promoting (protecting osmolytes) or disrupting (denaturing osmolytes) the folding process. Current consensus is that protecting osmolytes [trimethylamine N-oxide (TMAO)] act by being excluded from the protein surface while denaturing osmolytes (urea) bind to it. However there is little knowledge about the molecular mechanism of osmolyte action on hydrophobic macromolecules, which form the core of most proteins. This work, through a combination of single-molecule atomic force microscopy experiments and computer simulations, investigates the collapse behavior of a hydrophobic polymer polystyrene in TMAO and urea. The mechanism of osmolyte action on hydrophobic macromolecules is distinct from that of a protein, but, despite key differences, both mechanisms comply with the standard thermodynamic theory of preferential osmolyte binding.
Keywords: single-molecule force spectroscopy, free energy, preferential binding, TMAO, urea
Abstract
It is currently the consensus belief that protective osmolytes such as trimethylamine N-oxide (TMAO) favor protein folding by being excluded from the vicinity of a protein, whereas denaturing osmolytes such as urea lead to protein unfolding by strongly binding to the surface. Despite there being consensus on how TMAO and urea affect proteins as a whole, very little is known as to their effects on the individual mechanisms responsible for protein structure formation, especially hydrophobic association. In the present study, we use single-molecule atomic force microscopy and molecular dynamics simulations to investigate the effects of TMAO and urea on the unfolding of the hydrophobic homopolymer polystyrene. Incorporated with interfacial energy measurements, our results show that TMAO and urea act on polystyrene as a protectant and a denaturant, respectively, while complying with Tanford–Wyman preferential binding theory. We provide a molecular explanation suggesting that TMAO molecules have a greater thermodynamic binding affinity with the collapsed conformation of polystyrene than with the extended conformation, while the reverse is true for urea molecules. Results presented here from both experiment and simulation are in line with earlier predictions on a model Lennard–Jones polymer while also demonstrating the distinction in the mechanism of osmolyte action between protein and hydrophobic polymer. This marks, to our knowledge, the first experimental observation of TMAO-induced hydrophobic collapse in a ternary aqueous system.
Osmolytes constitute a class of small aqueous solutes used by a variety of organisms to cope with osmotic stress (1). As a side effect, many osmolytes are known to strongly affect protein stability, favoring either the native state (thus referred to as protectant) or the unfolded state ensemble (denaturant) (2–7). The denaturant urea and the protectant trimethylamine N-oxide (commonly abbreviated as TMAO) are among the most effective osmolytes, noted for the diversity of organisms within which they may be found as well as for the diversity of proteins upon which they act (1, 8–11).
The universality of osmolyte action gives some indication as to its mechanism, given that the only thing shared equally by all proteins is the makeup of the backbone (12). Studies of the solubility of various amino acids have led to two main conclusions: first, the main contribution to the solvation free energy arises from the backbone, not the side chains; second, this contribution is positive for aqueous solutions of protective osmolytes, while it is negative in denaturant solutions. In other words, the primary cause of osmolyte-induced folding/unfolding is rooted in the tendency for the protein backbone to avoid protectant solutions, while extending into denaturant solutions (8, 13–15). Although it has yet to be assigned a universally accepted driving force, theoretical analysis has led to some agreement that this model (frequently dubbed the solvophobic model) is likely derived from direct protein–osmolyte interactions whereby protectants are excluded from the protein’s vicinity, and denaturants adsorb to the protein (8, 16–19).
Of particular interest to protein folding models are studies on the effects of osmolytes on hydrophobic interactions, which have primarily been limited to molecular dynamics (MD) simulations (20–22). The only experimental study on hydrophobic clustering in the presence of osmolytes of which we are aware makes use of partially hydrophobic carboxylic acids with varying alkyl chain lengths (23), and it lends credence to the prediction (20) that TMAO destabilizes hydrophobic contact pair formation. However, there have been no experimental studies involving entirely hydrophobic molecules, nor have there been any experimental studies involving larger collections of hydrophobes. Single-molecule force spectroscopy has recently become an attractive method for investigating these problems (24). By depositing polymers on a surface and flooding the system with a liquid, it is possible to force a small population of hydrophobic polymers into solution. Atomic force microscopy (AFM) can be used to stretch polymers into solution, and inferences can be made as to the balance of forces between thermal motion and the interactions between monomers, the solvent, and the surface (25, 26). Over the past 15 years, work investigating the hydrophobic collapse of amphiphilic custom-made polymers (27), various proteins (28–32), and hydrophobic homopolymers such as poly (methyl methacrylate) (33) and polystyrene (34–36) has proven to be of substantial value in answering questions on the nature of hydrophobic interactions under different conditions.
Proteins are, by their nature, heterogenous molecules. As such, isolating individual contributions to a solvent-induced change in stability is a task for which homopolymers may be better suited. To our knowledge, there have been relatively few studies (21, 22, 37–39) of how such osmolytes perturb simple homopolymers. Recently, a systematic computational study of the collapse behavior of simple model Lennard–Jones (LJ) homopolymers with variable polarizability in aqueous solutions of TMAO and urea has provided a unified picture of how these osmolytes act (37). As with proteins, it was found that TMAO acts to stabilize and urea acts to destabilize the globular structure of the model polymers. Surprisingly, and seemingly in contrast to the solvophobic theory outlined above, both osmolytes strongly bind to the polymer surface, which a standard solvophobic model might support as the defining characteristic of denaturants in protein systems. In keeping with the theories of Tanford and Wyman (2, 3), this study highlights that it is actually the difference in relative preferential binding between collapsed and extended state, rather than the absolute magnitude of preferential binding in either state, which needs to be considered in a proper treatment of osmolyte-mediated polymer collapse.
Here we use AFM to measure the force required to unfold a single polystyrene molecule in aqueous solutions of TMAO and urea. In agreement with earlier theoretical predictions based on studies of model polymers (37), these experiments show that, relative to water as a solvent, the force needed to unfold polystyrene is systematically higher in aqueous solution of TMAO and lower in aqueous solution of urea. Pendant drop and contact angle measurements are performed to calculate surface tensions, indicating that both TMAO and urea are expected to be in excess at the polystyrene–water interface. These results are complemented by MD simulations on short chain-length polystyrene in aqueous solutions of TMAO and urea, which echo both the AFM and interfacial tension measurements. The results are analyzed using a thermodynamic preferential binding theory and free-energy calculations to provide a unified molecular level interpretation of osmolyte actions on a hydrophobic polymer.
Results and Discussion
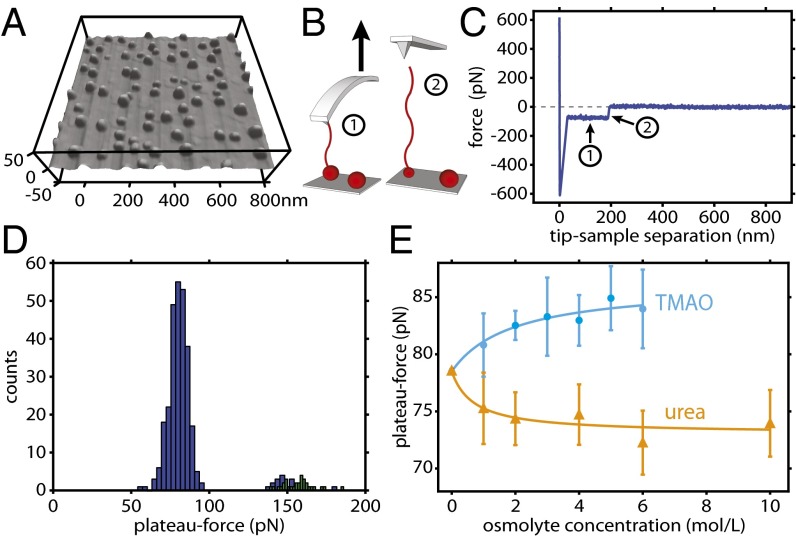
Investigations by several theoretical groups (40–43) have suggested that a hydrophobic polymer in solution will collapse into a surface area-minimized globule (such as those seen by AFM scans; see Fig. 1A) and that forcing a part of the polymer into solution causes the polymer to assemble into coexisting chain and globule regions (Fig. 1B). When this is accomplished by AFM, the polymer will eventually desorb from the tip, allowing a comparison of the force exerted by the polymer to the retraction baseline. This sequence of events is described as a force plateau such as the one shown in Fig. 1C. These models all predict a nearly constant but slightly decreasing force as the chain region lengthens and the globule region shrinks. The polymers used in the present experiment are of such size that a significant decrease in force is not expected to be observed over a typical plateau (36), and so a constant force approximation may be used. AFM scans and single-molecule pulling experiments on a variety of hydrophobic polymers are in agreement with this model (34–36), which will be used to interpret the results presented here. For polystyrene in water, a typical histogram of plateau forces (Fig. 1D) shows a Gaussian distribution near 78 pN, with a second, smaller Gaussian at slightly less than double this number. This second distribution is attributed to events involving two chains. Depending on the mechanism of desorption, the double-chain plateaus might look similar in appearance to single-chain plateaus (Fig. 1D, colored in blue) or have a staircase-like appearance corresponding to two individual desorptions (Fig. 1D, colored in green). In the present experiment, the single-chain Gaussian alone was used as a measure of the force of unfolding polystyrene in the presence of neat water, TMAO, and urea. Measured in this way, average values for unfolding force as a function of osmolyte content are shown in Fig. 1E. For solutions containing TMAO, this force is systematically higher than that in water, but a lower force is required to unfold the same chain in aqueous solutions of urea. The effect of each osmolyte on the polymer chain is thus similar to its effect on proteins: The protective osmolyte TMAO stabilizes the collapsed configuration of polystyrene while denaturant urea destabilizes the collapsed configuration of polystyrene, in keeping with the prediction of TMAO stabilizing collapsed LJ chains (37).
Fig. 1.
Osmolyte effect on polystyrene collapse behavior: experimental design. (A) Contact mode scan of polystyrene on a piranha-cleaned silicon surface in the presence of water (see Supporting Information for details on sample preparation). Single polystyrene chains deposited on the surface collapse into surface area-minimized globules. (B) AFM in force-mapping mode is used to extend the polymer into solution (location 1). (C) The polymer exerts a force on the AFM cantilever equal to the force of extending it from the sphere until (location 2) the polymer desorbs from the cantilever, allowing the cantilever to return to equilibrium, and creating a force plateau in the process. (D) Force plateau measurements are repeated hundreds of times over a force map, giving rise to a distribution of forces. Typically, a second, smaller distribution of forces is observed at double the single-chain force, corresponding to double-chain events. Double-chain events that clearly show two plateaus are colored here in green. (E) Single-chain force plateau averages from single-molecule pulling experiments in water, TMAO, and urea solution. The force required to extend a polystyrene sphere into an extended chain depends on the amount and identity of solute dissolved in water. TMAO (blue) increases the force required to extend polystyrene into water, while urea (orange) decreases it.
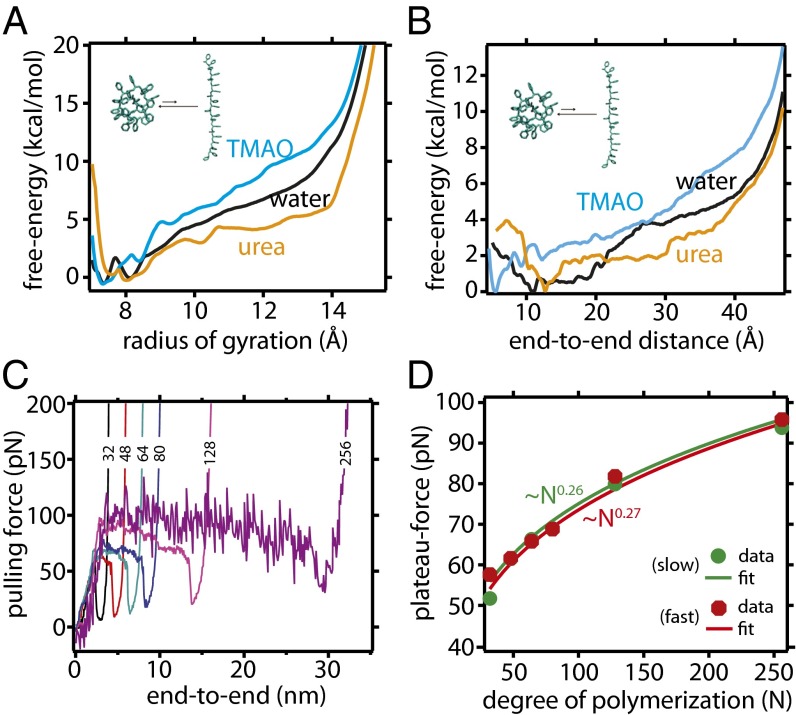
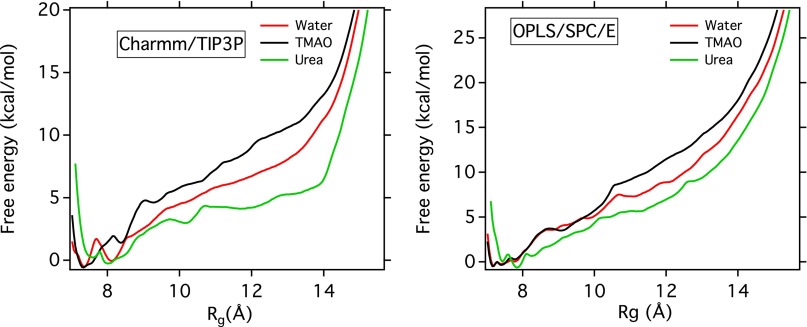
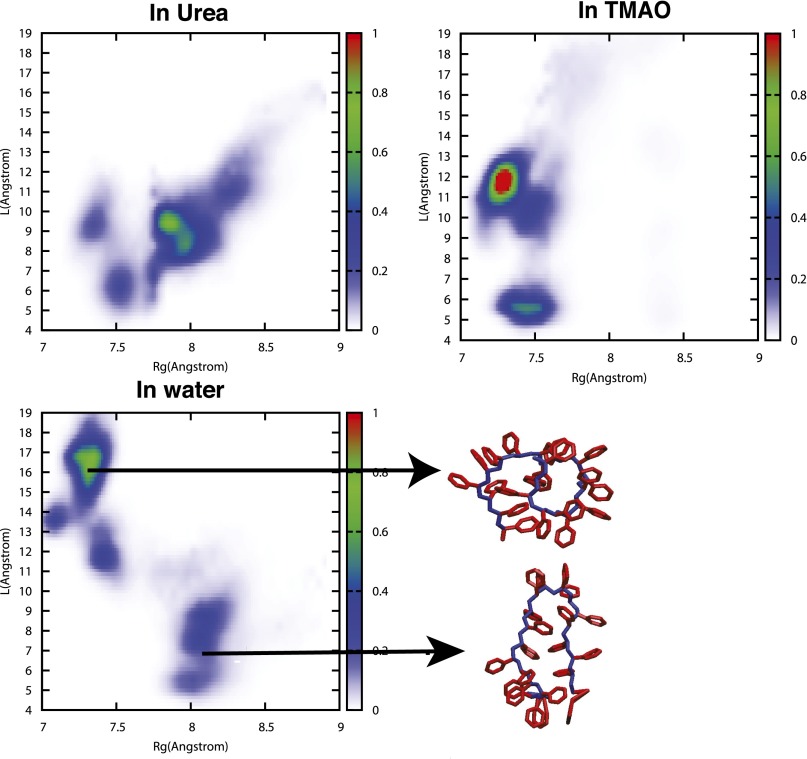
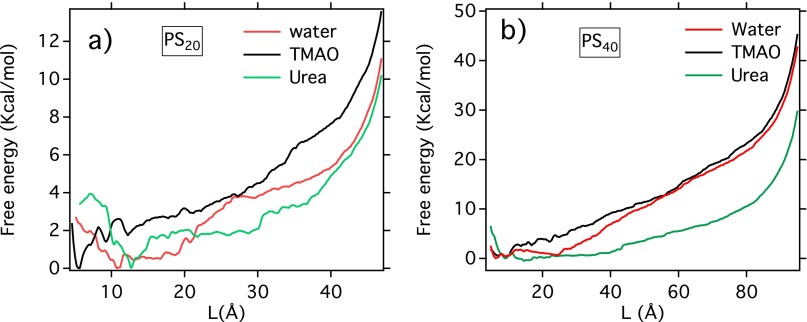
MD simulations of a 20-mer polystyrene chain in the respective osmolyte solution complement the single-molecule experiments and provide a more atomistic view of its conformational preferences in aqueous solutions of TMAO and urea. Fig. 2 A and B shows the calculated potential of mean force (PMF) of the 20-mer chain in neat water, 1 M TMAO solution, and 7 M urea solution along two individual reaction coordinates (the radius of gyration and the end-to-end distance L), based on umbrella-sampling simulations. The free-energy landscape along both reaction coordinates suggests that in all cases, the most stable configuration of polystyrene is a compact one—in agreement with experiments that show that a positive force is required to unfold the polymer. This is in strong contrast to proteins, for which the unfolded state becomes the free-energy global minimum in the presence of a high concentration of urea. Nevertheless, free-energy landscapes along both reaction coordinates unambiguously show that compared with pure water, TMAO lowers the free energy of the collapsed configurations of polystyrene, thereby stabilizing these configurations, while urea has the opposite effect. As illustrated in Fig. S1, these free-energy results are robust with respect to use of a different (OPLS) force field for the polymer and a different water model (SPC/E). For a more complete description of the chain conformations (given by the joint distribution function of and L) see Fig. S2 and SI Text. We also note that, in our previous study of the LJ polymer model (37), we tested the robustness of the results against two different TMAO force fields.
Fig. 2.
MD simulation results. Potentials of mean force W for PS20 as a function of the radius of gyration (A), normalized so that , and along the end-to-end distance L (B), normalized so that . (C) Force vs. end-to-end distance profile of different LJ polymer in the gas phase using steered MD simulation. We average over the force at the plateau region to compute the unfolding force. (D) Scaling of plateau force with degree of polymerization for the gas-phase LJ chain and the corresponding power law fits. Data are shown for two different pulling rates but, irrespective of the pulling rate, the results are well fitted by a power law of with .
Fig. S1.
PMF along the radius of gyration for for Charmm/TIP3P and OPLS/SPC/E force field. The PMFs are normalized so that .
Fig. S2.
Comparison of joint probability distribution of PS20 along radius of gyration and end-to-end distance in water, in 1 M TMAO and in 7 M urea, obtained from umbrella sampling simulations.
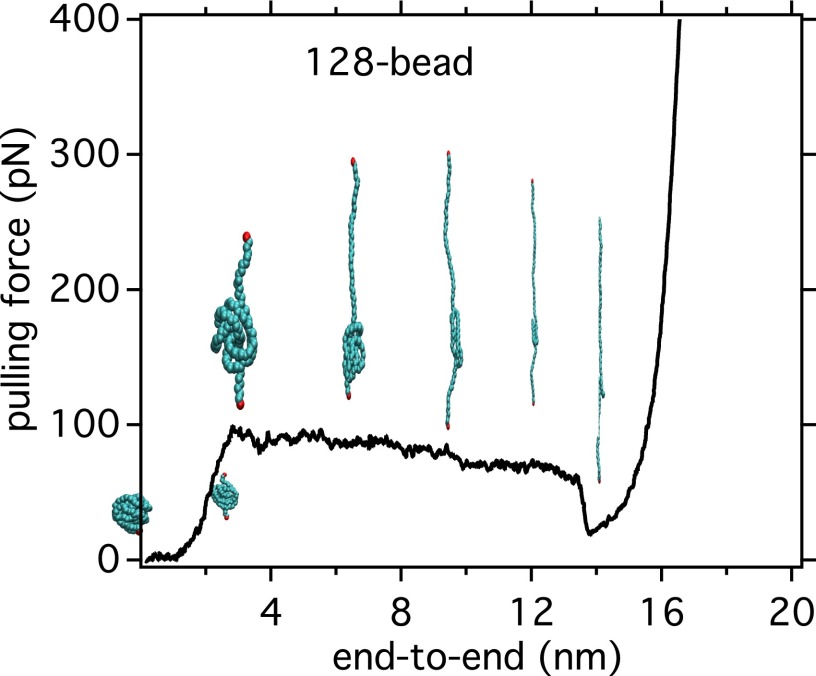
Even though the computer simulation results shown here are for relatively short chains of polystyrene compared with that used experimentally, we verified that the effects of osmolytes on polystyrene are qualitatively similar for a longer chain (PS40; see SI Text and Fig. S3). PS40 is still much smaller than the chains in the above experiments (typically to ). Therefore, as expected, the unfolding forces estimated from the PMF (see Fig. 2B and Table 1) for both PS20 and PS40 are significantly smaller than those measured experimentally for much longer chains. This force increases as the polymer gets longer because there are more interacting sites; direct quantitative comparison with experiment requires extrapolation of the simulation data to much longer chain lengths. Even if present computing resources do not allow simulations on such large chains of polystyrene in explicit solvent, we do this by performing steered MD simulations on a simple model LJ polymer chain (σ = 0.4 nm and ε = 1.0 kJ/mol) of various degrees of polymerization in the gas phase, and assume that because, in the polymer chain, beads also interact with LJ potentials, the scaling of their plateau forces with system size might be similar to that of polystyrene. A representative force-extension curve as obtained from steered MD simulations is discussed in SI Text and shown in Fig. S4, where the coexistence of globular and extended configurations along the plateau region is quite evident. As shown in Fig. 2C, the magnitude of the force plateau increases with the degree of polymerization. Its force dependence (Fig. 2D) is well fit by a scaling law with and . We have verified that these parameters are weakly sensitive to the pulling rate (Fig. 2D). By applying this scaling law to the simulation data on polystyrene (Table 1), we obtain an extrapolated value of ∼60 pN for PS1,500, in reasonable agreement with the experimental value of 70–85 pN. Overall, the experimental single-molecule force measurements and the simulations are in quantitative agreement and provide strong evidence that both the protecting osmolyte TMAO and the denaturing osmolyte urea perturb the conformational equilibrium of a hydrophobic polymer in much the same way as they affect proteins.
Fig. S3.
Free-energy landscape in different osmolyte solution as obtained from computer simulations for polystyrene of chain length (A) 20 and (B) 40.
Table 1.
Unfolding free-energy and the corresponding force (in piconewtons) for stretching a polystyrene ( in kilocalories per mole) from a collapsed configuration of end-to-end distance (in Ångstroms) to an extended configuration of length (chosen based on the onset of elastic region) (in Ångstroms)
| System | F=/ | ||||
| PS20 | |||||
| Water | 10.8 | 39.3 | 28.5 | 5.2 | 12.7 |
| TMAO | 5.7 | 39.3 | 33.6 | 7.5 | 15.5 |
| Urea | 12.7 | 39.3 | 26.6 | 4.4 | 11.4 |
| PS40 | |||||
| Water | 6.2 | 86.1 | 79.9 | 25.8 | 22.4 |
| TMAO | 9.3 | 86.1 | 76.8 | 27.2 | 24.6 |
| Urea | 14.3 | 86.1 | 71.8 | 14.1 | 13.6 |
Fig. S4.
Force vs. end-to-end distance profile of 128-bead LJ polymer in gas phase using steered MD simulation at a pulling rate of 30 nm/ps. Also shown are the representative snapshots of coexisting collapsed and extended configurations over the force-extension profile, particularly in the plateau region. We average over the force at the plateau region to compute the unfolding force.
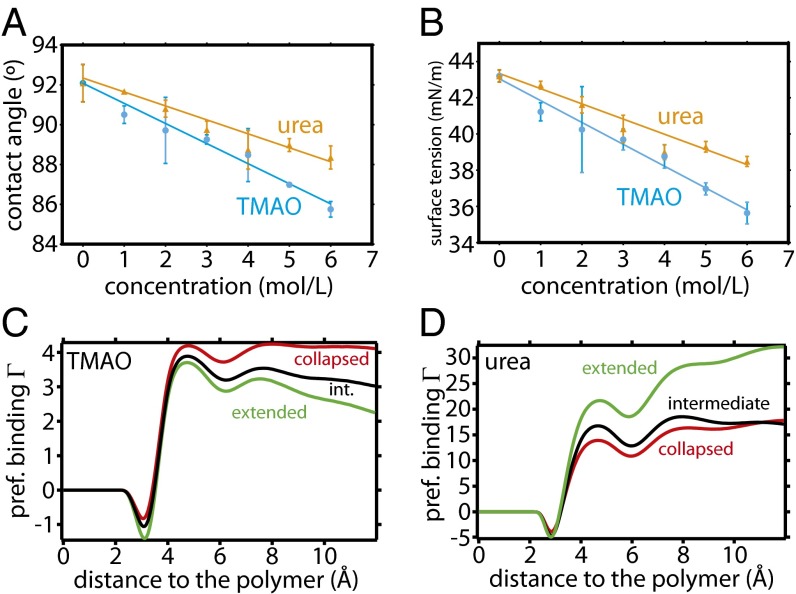
To investigate the behavior of osmolytes at the extended polystyrene–liquid interface, the contact angles formed by droplets of urea solutions and TMAO solutions on a polystyrene film were measured. The reference for water was found to be 92.5°, in good agreement with available data (44). Compared with water, both TMAO and urea were found to induce slight wetting of the surface, decreasing the associated contact angles as depicted in Fig. 3A. These values were combined with values from pendant drop measurements (see SI Text for methods, Fig. S5, and discussion therein) to obtain the polystyrene–liquid interfacial tensions shown in Fig. 3B. To make a connection with the osmolyte effect on the polymer conformational equilibrium, it is useful to first consider the Gibbs surface excess, which is defined as the difference in concentration at the surface relative to the bulk. The surface excess of component s per unit area is given by (45)
| [1] |
where γ is the interfacial tension for a given interface, is the activity of the sth component in the bulk, R is the gas constant, and T is the temperature. For both solutions of TMAO and urea, the dependence of interfacial tension on concentration appears linear with a negative slope. Assuming the activity of the solute is an increasing function of the concentration, which is typical for both ideal and nonideal solutions, Eq. 1 indicates that both TMAO and urea are in excess at the polystyrene–solution interface ().
Fig. 3.
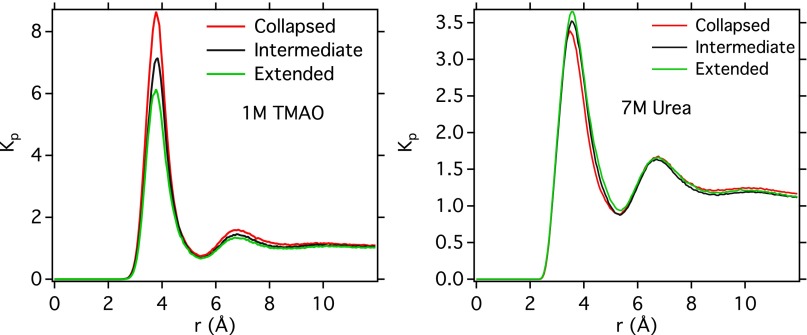
(A) Contact angles of aqueous solutions of osmolytes on polystyrene and (B) polystyrene–liquid interfacial tensions, as calculated using pendant drop and contact angle measurements. Preferential binding coefficients () as a function of distance to PS20 for TMAO (C) and urea (D), as obtained from MD simulations, are plotted for three different polymer conformations (collapsed, red; intermediate, black; extended, green).
Fig. S5.
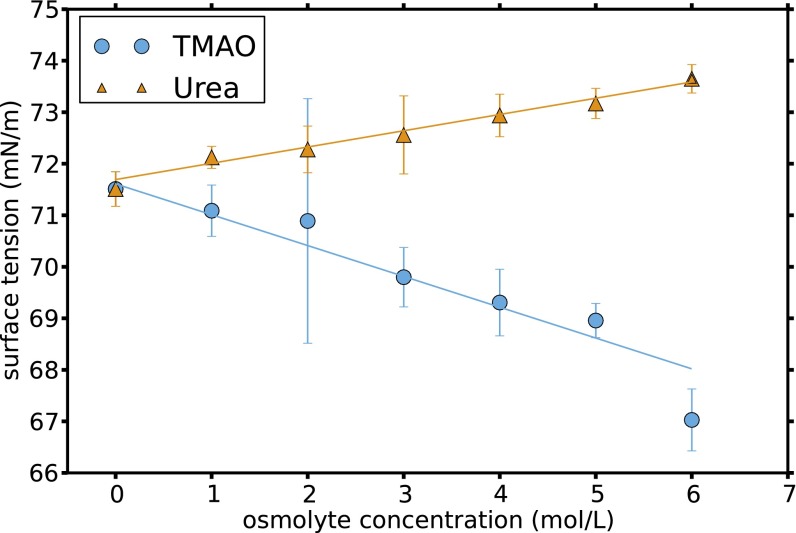
Vapor–liquid interfacial tension plotted as a function of osmolyte concentration.
The observation that the addition of TMAO to a system of polystyrene in water favors collapse, along with the observation that TMAO decreases the macroscopic polystyrene–liquid interfacial tension, is seemingly at odds with both the solvophobic model of osmolyte action and the simple collapse–extension transition model used previously by the Walker group (see ref. 35). Both of these models predict a depletion of TMAO at the polystyrene–liquid interface, apparently in contradiction to the much better-founded Gibbs isotherm (from which Eq. 1 is derived), which demands an accumulation of TMAO at the interface. The key realization in resolving these contradictions is given by Wyman and Tanford (2, 3) and supported by MD simulations in the present study: The surface excess is conformationally dependent (37).
The Wyman–Tanford approach uses the preferential binding coefficient given by Eq. 2 (2, 3) to describe the dependence of polymer conformational equilibria on cosolutes,
| [2] |
Here is the number of molecules of type X bound to polymer and is the total number of molecules of type X in the system (where stands for the osmolyte (urea or TMAO) and stands for water). is extensive in the sense that it is proportional to the polymer surface area; it actually represents the excess of solute molecules s in the macromolecule solvation shell compared with its average concentration in the solution: if the osmolyte accumulates next to the polymer, and if it is depleted near the polymer. should not be confused with , which is basically normalized by the surface accessible area.
Tanford showed that the conformational equilibrium constant and the related free-energy difference between polymer conformational states is proportional to a difference in between the compact (C) and extended (E) polymer states as
| [3] |
where K is the aforementioned folding–unfolding equilibrium constant. According to Eq. 3, it follows that an increase in the concentration of the osmolyte would lead to the polymer unfolding if and, in contrast, would favor the collapsed state over the extended one if .
The values of computed in our MD simulations are shown in Fig. 3 C and D for several polymer conformations—collapsed ( Å), intermediate ( Å), and extended ( Å). At a distance corresponding to the polymer hydration shell (5 Å and beyond), is positive for both osmolytes, which corroborates the experimental interfacial tension measurement. Furthermore, is found to be strongly dependent on polymer conformation for both TMAO and urea. The nature of this dependence, however, varies between TMAO and urea. Even though TMAO strongly interacts with the polymer in all configurations, there is an effective depletion of TMAO on going from the collapsed conformations of polymer to extended conformations ( decreases) (Fig. 3C). The opposite is seen for urea (Fig. 3D). This is similar to what was previously observed for model LJ polymers (37), and, following Eq. 3, it gives rise to the observed effect of both osmolytes on the polymer conformational equilibrium. These findings are further supported by computation of a different intensive parameter known as local bulk partition coefficient (7, 37) (see SI Text and Fig. S6), which has been shown to quantitatively distinguish between protecting osmolytes and denaturants toward protein.
Fig. S6.
Comparison of progression of local-bulk partition coefficient () as a function of polymer–osmolyte radial distance for different PS20 conformation in 1 M aqueous TMAO solution (Left) and 7 M aqueous urea solution (Right).
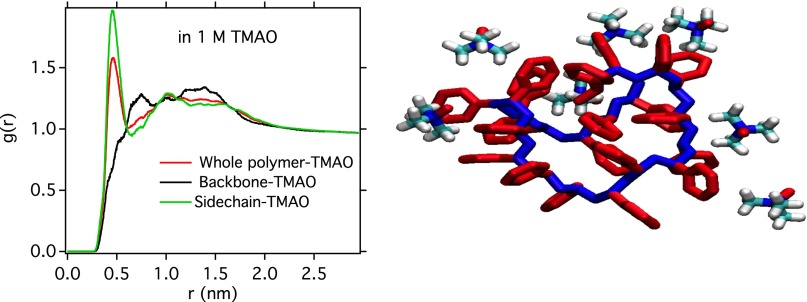
Finding that is conformationally dependent begs the question of why a homopolymer should interact with a surrounding solution differently in different conformations. The simulations performed in this study can shed some light on this. Radial distribution calculations (see Fig. S7) show a preference for TMAO to interact with the more polarizable aromatic pendant groups than with the aliphatic backbone. This, in turn, gives rise to a tendency for polystyrene to bury the aliphatic backbone and partition aromatic pendant groups to the interface when in a collapsed configuration, which is impossible in the extended configuration.
Fig. S7.
(Left) Radial distribution functions of TMAO with different components of PS20. (Right) The pictorial overview of first solvation shells of PS20 in collapsed configurations. The backbones are shown in blue, and side chains are shown in red.
In the final part of this paper, a free-energy perturbation (FEP) analysis is used to gain a more detailed understanding of the thermodynamics of osmolyte binding to the polymer. Following ref. 37, we have computed the free-energy changes (or chemical potentials) for inserting an osmolyte or a water molecule in the bulk solution and in the first hydration shell of the polymer either in the collapsed or an extended conformation.
As evident from Table 2, insertion of a TMAO molecule is more favorable ( is more negative) near a collapsed conformation than near an extended conformation. The reverse is true for urea where is slightly more negative when this molecule is inserted next to an extended conformation than next to a collapsed conformation.
Table 2.
Different free-energy contributions (in kilocalories per mole) for inserting single osmolyte molecules in the first solvation shell of the PS20 in 1 M TMAO and 7 M urea
| System | |||||
| TMAO | |||||
| Bulk | +1.64(0.02) | −13.26(0.01) | −11.62(0.024) | 0 | – |
| Collapsed | −0.39(0.14) | −12.48(0.30) | −12.87(0.26) | −1.25 | 7.2(0.2) |
| Extended | +0.45(0.29) | −12.60(0.28) | −12.15(0.38) | −0.53 | 8.8(0.6) |
| Urea | |||||
| Bulk | −0.23(0.01) | −13.41(0.04) | −13.64(0.03) | 0 | – |
| Collapsed | −0.79(0.37) | −12.90(0.29) | −13.69(0.01) | −0.05 | 42.0(0.3) |
| Extended | −1.46(0.30) | −12.38(0.30) | −13.84(0.25) | −0.20 | 59.5(0.4) |
represents the difference with respect to the bulk solution, and the average number of molecules in first solvation shell of the polymer is also given. SDs are given within parentheses.
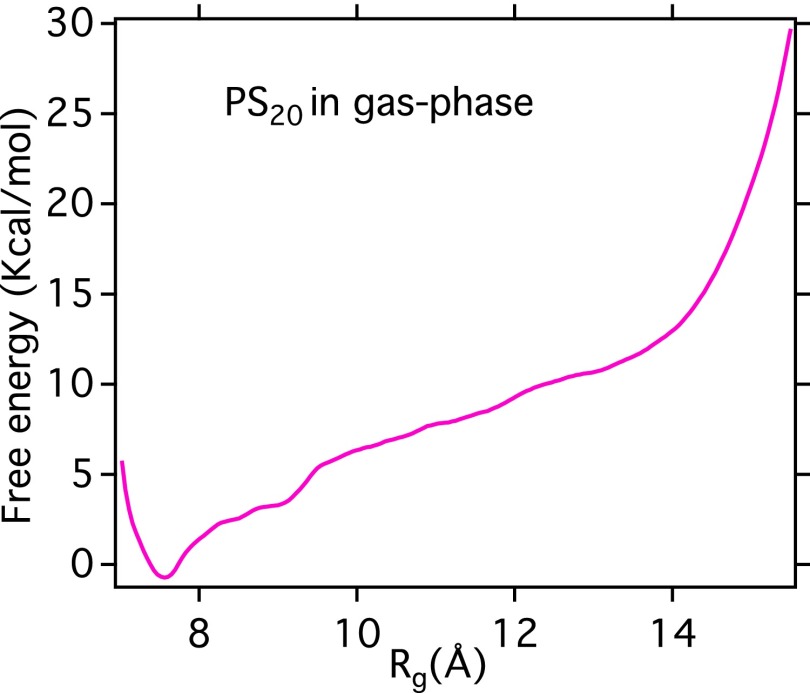
These calculations suggest that the osmolyte–polymer free-energy difference between extended and collapsed configurations () will be guided in such a manner that TMAO molecules would preferentially bind to the polymer collapsed state while urea molecules would be more stable next to the extended state. Hence, there will be a substantial contribution solely coming from cosolutes to the total free-energy difference between collapsed and extended conformation. We will refer this cosolute contribution to the free energy as . However, one has to consider two other contributions to explain the conformational propensities of PS20 in the presence of various osmolytes: (i) the gas-phase (or purely intramolecular) contribution to the free-energy difference between collapsed and extended configuration of polystyrene () and (ii) the water’s contribution to the free-energy difference (), which is not the same in all three solutions since the presence of urea or TMAO will modify the water chemical potential in different ways except at very low-osmolyte concentration. Toward this end, as depicted in Fig. S8, we have computed the gas-phase PMF along Rg, from which we find that the gas-phase PMF of polystyrene () favors the collapsed state by more than 10 kcal/mol. On the other hand, similar estimates of the chemical potential for water in different osmolyte solutions have been calculated (see Table S1) and used to compute .
Fig. S8.
Free-energy profile of PS20 along radius of gyration in gas phase.
Table S1.
Total free-energy cost (with respect to the bulk solution reference) for inserting single water molecules in the first solvation shell of the PS20 in pure water, 1 M TMAO, and 7 M urea (in kilocalories per mole), and average number of water molecules in the polymer first hydration shell
| System | ||
| Pure Water | ||
| Collapsed | −0.16(0.01) | 167.57 |
| Extended | −0.14(0.01) | 230.6 |
| TMAO | ||
| Collapsed | −0.09(0.01) | 144.0 |
| Extended | −0.08(0.04) | 217.0 |
| Urea | ||
| Collapsed | −0.14(0.04) | 106.2 |
| Extended | −0.10(0.03) | 150.0 |
SDs are given within parentheses.
By combining these three ingredients, a simple thermodynamic analysis can be used to estimate the conformational preferences as follows:
| [4] |
where and are the average numbers of solvent molecules of type k (water w or osmolyte s) in the first hydration shell of the polymer in collapsed and extended configurations, respectively, and and are their corresponding differences in chemical potentials in the first solvation shell of polymer and that in bulk. Physically, and are simply equivalent to binding potential energies of the kth component to a site on the polymer surface in their respective configuration. A detailed derivation of the equation has been provided in SI Text. An underlying assumption is that the major free-energy contribution comes from solvent and cosolute reorganization in the first solvation shell of the polymer when it changes conformation. We assume that the chemical potentials of molecules beyond the first hydration shell are similar for both polymer configurations. We also assume that free-energy contribution due to the water–cosolute mutual interactions will be similar for both polymer conformations.
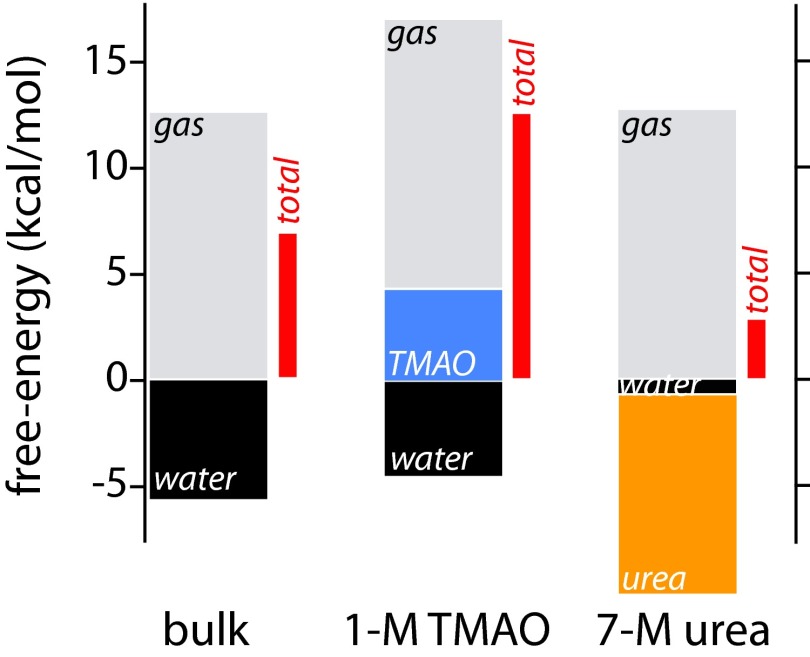
Histograms of these different contributions are shown in Fig. 4. These data help to explain how the osmolytes TMAO and urea affect polymer collapse. The free energy from water molecules in pure water favors the extended state of polymer. However, interactions with water cannot compensate for the polymer intramolecular contribution. Thus, the collapsed state is more stable in neat water. Water’s free-energy contribution in TMAO solution hardly changes from its contribution in neat water, but contributions from TMAO favor the collapsed state. The water contribution becomes negligible in urea solution, and urea contributes almost 10 kcal/mol toward stabilizing the extended state, more than compensating for its displacement of water near the extended state. The collapsed state is still favored in urea solution because of the strength of intramolecular interactions, but its stability is significantly reduced compared with TMAO solution or pure water. These results are in agreement with preferential binding data and provide a molecular interpretation of it.
Fig. 4.
Histograms showing the different contributions to the free-energy cost of binding water (black) or osmolyte molecules (TMAO, blue; urea, orange) in the PS20 first solvation shell (terms in parentheses of Eq. 4, Table 2, and Table S1). The gas-phase contribution (gray) was calculated from separate simulations (see SI Text). The total free-energy change is shown as a red bar to the right of each set of contributions.
Conclusions
This study clearly demonstrates the value to be gained by combining single-molecule force measurements with computer simulations. While the single-molecule force spectroscopy measurements show that the osmolytes TMAO and urea have a significant and contrasting effect on the collapse of a hydrophobic polymer like polystyrene, our extensive free-energy-based conformational analysis, obtained from computer simulation, provides insights difficult or impossible to obtain experimentally. Both experiment and simulation find that both protecting and denaturing osmolytes strongly interact with the polymer (both having a preferential binding constant greater than zero), in contrast with existing explanations of the osmolyte effect on proteins.
A thermodynamic model taking into account the different contributions (gas phase, water, and osmolyte) to the polymer conformational equilibrium suggests that what determines an osmolyte’s effect on polymer conformation is the effective depletion or accumulation of the osmolyte in the first solvation shell of the polymer as the polymer’s conformation changes. Indeed, for TMAO, it is the much more favorable free energy of inserting a single solute molecule near the collapsed configurations of the polymer than near the extended configurations that dictates the system’s propensity to collapse. This leads to a protective effect in systems of polystyrene, but, depending on the polymer, this effect may or may or not be able to overcome the intramolecular van der Waals attractions of the polymer side chains. In contrast, urea is preferentially stabilized next to the extended conformation and therefore acts as a denaturant for polystyrene. It is interesting to note how closely the present results, based on a real homopolymer, mirror the previous study on a model LJ polymer (37). While the primary significance of the present work lies in its being founded on a real hydrophobic polymer, it also highlights the value of studies based on model system.
The combination of experiment and theory provides a powerful tool for the analysis of many problems in biophysical chemistry. In this paper, we report the results of single-molecule AFM experiments to determine the pulling force required to elongate a polystyrene chain in various chemical environments, and we use molecular simulations to provide a detailed microscopic interpretation of how the osmolytes TMAO and urea alter this force. The synergy between experiment and theory, especially with respect to hydrophobic hydration, will hopefully lead to a better understanding of hydrophobicity and an improved capability of including it in biomolecular engineering. There are many possible avenues for future research. For example, recent work in Raman solvation shell spectroscopy (46) may offer an experimental method capable of obtaining complementary information to that which was presented here. Questions on homopolymer responses to the Hofmeister series of salts or aqueous mixtures of urea and TMAO beg to be answered, and the effects of these osmolytes on hydrophobic aggregation at different length scales is worth exploring, both from experimental and theoretical perspectives.
Materials and Methods
Experimental.
Single-molecule force spectroscopy was performed on a single polystyrene chain in different aqueous solutions following methods previously described (34–36). The experimental setup is illustrated in Fig. 1. The contact angles were measured using a sessile drop method, and vapor–liquid interfacial tensions were measured using the pendant drop method. Complete details of the solution preparation, single-molecule force spectroscopy, contact angle measurement, and interfacial tension measurements are provided in SI Text.
Computer Simulation Details.
The computer simulations were mostly performed on a 20-mer of polystyrene chain in neat water, 1M TMAO solution, and 7M urea solution. Some simulations were repeated for 40-mer of polystyrene chain to check robustness of the result. The simulation protocols revolved around determining the potentials of mean force along the polymer radius of gyration and end-to-end distance, using the umbrella sampling technique. FEPs were also used to compute the free energy of inserting a single osmolyte or solvent next to the polystyrene chain. The binding or exclusion of osmolytes toward polymer was quantified using the preferential binding coefficient, . Finally, model LJ polymers of different degrees of polymerization were subjected to steered MD simulations to determine a scaling exponent of plateau force for comparison with the experiments.
SI Materials and Methods
Experimental.
Solution preparation.
Highly concentrated solutions of TMAO and urea were prepared by adding water to a given mass of osmolyte such that the total volume reached the desired amount. It was not possible to measure out a specific volume of water and add solid osmolyte assuming neglible density changes, as the osmolyte itself occupies a large volume at such concentrations. All osmolytes were purchased from Sigma Aldrich. Water was freshly deionized using an 18.2 M MilliQ water purifier. Solutions were iteratively mixed mechanically followed by sonication until no crystals were visible in solution. Immediately before use in measurements, all solutions were filtered using 0.2-μM cellulose syringe filters.
Atomic force spectroscopy.
Force spectroscopy was performed on single polystyrene chains following methods previously described (34–36). Briefly, silicon substrates were prepared by cleaning in a piranha chemical bath [3:1 mixture of concentrated sulfuric acid to a 30% (wt/vol) solution of hydrogen peroxide in water] to remove any residual organic material. The wafers were then rinsed with copious amounts of water and dried under nitrogen. Then 131,000 or 138,000 polystyrene (Polymer Source) was deposited onto the wafers by spin casting from a solution of 1–5 μg/mL in toluene. Silicon nitride cantilevers with spring constants of 17 pN/nm or 60 pN/nm were used in all experiments. The cantilever tip was cleaned by UV ozone for 15 min immediately before use. If, at any point during a force map, it became apparent that the cantilever became contaminated, the experiment was paused and the cantilever was once again cleaned with UV before proceeding. Force curves with complex entropic stretching profiles were discarded from the final dataset, as were force curves containing no pulling events (which comprise the majority of all pulling data).
Cantilevers were individually calibrated using the thermal noise method (47). Force maps of polystyrene were first taken in ultrapure neat water, and then in the presence of osmolyte. Small differences in mean water plateau force between force maps were seen as errors in calibration, and force curves were renormalized accordingly. As such, each osmolyte measurement could be referenced to a neat water measurement. Each data point in Fig. 1E, with the exception of the 10 M urea, comprised an average of two or more osmolyte-containing force maps. All single-molecule experiments were performed using a closed fluid cell with MFP-3D microscope from Asylum Research.
Contact angle measurements.
Flat polystyrene surfaces were prepared by spin casting a 2% wt/vol solution of polystyrene in tetrahydrofuran onto piranha-cleaned silicon wafers at a rotational frequency of 2,000 rpm for a duration of 1 min. The surfaces were left to cure for 24 h at atmospheric pressure in a clean box. Contact angles were taken using the sessile drop method with a KSV tensiometer. Then, 10-μL droplets were deposited using a micropipettor from a fixed height. Each film was tested four times, each time in a different area. A total of five films per concentration per osmolyte were measured this way. The data are thus constructed of 20 measurements per concentration per osmolyte. SDs and means were calculated assuming a normal distribution, and data points more than two SDs from the mean were excluded from the sample set. The entire set of measurements was performed over 3 d to minimize variation in climate conditions. The order of the measurements was randomized to avoid systematic error.
Interfacial tension measurements.
The vapor–liquid interfacial tension was calculated using a pendant drop method. A single finely sanded stainless steel needle with a diameter of 0.9 mm was used for all measurements, and a KSV CAM 101 tensiometer was used to record videos of 1 s in length just as the drop fell from the needle. After each solution was measured, the syringe was replaced and the needle was rinsed five times in 18.2 M MilliQ deionized water. Three droplets per concentration were recorded with a frame rate of 60 Hz, and six randomly chosen frames per video were used to take a measurement for each droplet. For those frames chosen, the solvent–vapor interfacial tension was measured by fitting the frame of the emerging droplet to the Young–Laplace equation via a regression analysis algorithm built into the video software. Each data point shown in Fig. S5 is thus an average of 18 measurements, one from each frame chosen. Polystyrene–solvent interfacial tensions were calculated using drop and contact angle values in Young’s equation (45),
| [S1] |
where is the polystyrene–liquid interfacial tension, is the polystyrene–vapor interfacial tension, and is the liquid–vapor interfacial tension, commonly taken as a measurement for surface tension. The value for polystyrene–vapor interfacial tension was taken from literature using Fowke’s equation (44). Solvent–vapor interfacial tensions were measured using the pendant drop method and compare well with values previously recorded (15, 48).
Computer Simulation Methods and Models.
System and force fields.
Polystyrene is modeled using the analogous hydrocarbon parameters from Charmm force field (49, 50). Water is modeled using the TIP3P model (51) due to its compatibility with Charmm force field. Urea interacts through the OPLS/AA force field (21, 37) and TMAO through the force field developed by Kast et al. (52). To check the robustness of the simulation result, we have also repeated some of the simulations using the OPLS/AA force field (53, 54) for polystyrene and the SPC/E model (55) for water, and we have obtained very similar results. Consistent with our previous work (37), we have simulated three systems: a 20-mer of polystyrene (PS20) solvated in neat water, solvated in 7 M urea solution, and solvated in 1 M TMAO solution. The system of pure aqueous solution is composed of a PS20 chain solvated by 8,993 water molecules. The system in 1 M TMAO solution is composed of a PS20 chain, dissolved in a solution of 100 TMAO molecules and 6,494 water molecules. Finally, the system in 7 M urea solution is composed of a PS20 chain in a solution of 1,000 urea molecules dissolved in 5,454 water molecules. The equilibrated box size was close to nm3 in all cases. To get a sense of how the results scale with chain size, we also simulated the longer PS40 chain in neat water (solvated by 22,392 water molecules) and a PS40 chain in 1 M TMAO solution (composed of a chain, 320 TMAO molecules, and 20,480 water molecules), and, finally, the PS40 chain in a 7 M urea solution (composed of 3,040 urea molecules and 16,580 water molecules). The equilibrated box size was close to nm3 for these simulations.
PMF.
We used the Gromacs 4.5.4 software (56) to determine the free-energy landscape (or PMF) as a function of the end-to-end distance L and the radius of gyration of polystyrene PS20 in the three different osmolyte solutions using an umbrella sampling protocol. First, we carried out equilibrium MD simulations starting with an all-trans extended configuration of the polymer. The simulation protocol was similar to that used in our paper on the model LJ chain (37). The system is first energy-minimized using steepest descents followed by 100 ns of production run in the NPT ensemble. Configurations from the equilibrium simulations were used as the basis for the umbrella sampling free-energy simulations, and the PLUMED (57) extension of Gromacs was used. The value of ranged from 0.7 nm to 1.6 nm at a spacing of 0.05 nm between adjacent windows, while the value of L ranged from 0.5 nm to 4.5 nm. Restraining harmonic force constants of 7,000 kJ⋅mol−1⋅nm−2 were used in the umbrella potential in all positions to ensure a Gaussian distribution of the reaction coordinate around each desired value of the reaction coordinate. Finally, we used the Weighted Histogram Analysis Method (58, 59) to generate unbiased histograms and corresponding free energies. As described later, we also computed the joint probability distribution of and the end-to-end distance and the corresponding PMF as a function of these two variables.
Preferential interaction.
We determined the affinity of the cosolute (urea or TMAO) for the PS20 molecule by computing experimentally relevant preferential binding coefficient () (2, 3, 7, 60, 61),
| [S2] |
which is extensive (i.e., it depends on the size of the hydration shell). Here is the number of molecules of type X bound to polymer, and is the total number of molecules of type X in the system (where stands for the osmolyte (urea or TMAO) and stands for water). As in our previous work (37), we computed the value of as a function of the proximal cutoff distance for the counting of molecules around the polymer [defined as the shortest distance between the central atom of the solvent molecule (O for water, N for TMAO, and C for urea and any polymer bead)]. Again, as before, the polymer was frozen in representative collapsed or extended configurations for each osmolyte solution, and each of the simulation runs was propagated for 15 ns. In this way, was determined from averages over ensembles of five trajectories.
Finally, we used the FEP technique to compute the transfer free energy (chemical potential) for transferring a single TMAO (or urea or water molecule) from bulk solution into the first solvation shell of particular conformations of polymer in 1 M TMAO (or 7 M urea) where the polymer conformation of PS20 was fixed in either a collapsed or an extended conformation. For these calculations, the initial configurations were taken from a representative snapshot of the prior umbrella sampling windows, and the TMAO (or urea or water) molecule was grown in the presence of other TMAO (or urea or water) molecules in solution. The interactions of the molecule being inserted were slowly turned on in two stages: In the first stage, only the van der Waals interactions were turned on, and in the second stage, the electrostatic interactions were turned on. Thermodynamic integration gives these two contributions to the transfer free energy. The difference between the free energy for the insertion proximate to the polymer and the insertion in bulk gives the required transfer free energies. Finally, since the choice of the position near the polymer where the osmolyte and solvent molecules is grown is arbitrary, we repeated such calculations at several positions in each case: three sites for TMAO and urea and two sites for water near each of the collapsed and extended conformations and two sites for each of them in bulk media. They were finally averaged, and the SDs were estimated.
Polymer conformations in different osmolytes.
A more complete description of the chain conformations is given by the joint distribution function of and L. These are shown in Fig. S2. In neat water, two main peaks are observed: One corresponds to a collapsed state (low and large L) and another one to a hairpin state (higher but much lower L). In aqueous TMAO solution, the collapsed state peak shifts toward slightly lower and L, but the most striking effect is observed in the hairpin peak, which shifts toward much lower values of , very close to that of the collapsed state. The situation is more complex in the presence of urea, where many peaks are observed. The main peak is very close to that of the hairpin state in pure water ( an L close to 8 Å), but, most importantly, the collapsed state is almost not present while more extended configurations are sampled.
A closer look at force-extension profiles obtained from computer simulation.
Fig. S4 illustrates computer-simulated representative force vs. end-to-end distance profiles of a model hydrophobic polymer chain as a strand is being pulled out from its globular conformation. To make contact with the experiment in which forces measured for polymers are very large compared with those simulated here, we performed steered MD simulations on simple LJ polymers (σ = 0.4 nm and ε = 1.0 kJ/mol) of various sizes in the gas phase, and we assume that the scaling of their plateau forces with system size might be similar to what would be seen in our polystyrene experiments. Such model polymers act in a way similar to hydrophobic polymers in water. Fig. S4 shows how the force and conformations change with end-to-end distance as a 128-bead polymer is pulled out from a collapsed conformation when the pulling is done at a constant rate of 30 nm/ps. As illustrated in representative snapshots in Fig. S4, the force increases initially, when the polymer is being pulled out of its collapsed conformation to more solvent-accessible extended conformation, until a plateau region appears. Our computer simulation unequivocally shows that this plateau region is where both collapsed and (hydrated) extended configuration of the polymer coexist, as previously described by Li and Walker (35, 36) in single-molecule force spectroscopy studies of polystyrene. Our computer simulated force-extension curve shows that for high end-to-end distances where the globular segment is small compared with the extended coil segment, the force decreases slightly and then rises again as polymer reaches its elastic region. This decrease in the magnitude of the force is, in fact, in accordance with the power law scaling found by fitting the plateau force with degree of polymerization (Fig. 2D): If N is the number of monomers in the globule, the scaling law also predicts that the force will decrease as globule size gets smaller. In a previous paper (35), it was shown that, for a worm-like chain model at large end-to-end distance, when the number of globular monomers is very small, the force will decrease slightly with chain extension. However, this was based on the assumption that the diameter of the collapsed spherical globule is much greater than the diameter of the extended worm-like chain, and this begins to fail toward higher extension length when the number of monomers in the collapsed state is very small, an assumption made in the worm-like chain theory. Our experimental analysis, based on this assumption, is not designed to observe this effect. In future work, we plan to improve our analysis program to pick out these special force curves.
Analysis of osmolyte effect using bulk partition coefficient.
We determined the affinity of the cosolute (urea or TMAO) for the PS20 molecule using the approach described in a previous paper (37) involving the local-bulk partition coefficient, , and the preferential binding coefficient, Γ. Briefly, the local-bulk partition coefficient is defined as (7)
| [S3] |
where is the average number of molecules of type X bound to polymer, and is the total number of molecules of type X in the system (where stands for the cosolute (urea or TMAO) and stands for water). is intensive and reflects the affinity of the cosolute for the polymer regardless of the exposed surface area of the polymer. As in our previous work (37), we computed the value of as a function of the proximal cutoff distance for the counting of molecules around the polymer. Again, as before, the polymer was frozen in representative collapsed or extended configurations for each osmolyte solution, and for each simulation, runs were propagated for 15 ns. In this way, was determined from averages over ensembles of five trajectories.
The relative binding affinity of the cosolutes to different conformational states of a polymer should influence the conformational equilibrium of the polymer. The concentrations of these moieties in the hydration shell of the polymer (relative to their bulk concentrations) is given by the partition coefficient (defined in Eq. S3, where if osmolyte molecules accumulate next to the polymer and if they are depleted. is intensive, i.e., it is insensitive to the polymer exposed surface area. Thus, allows one to compare the partitioning of osmolyte relative to water between the solvation shell of the polymer and bulk solution for different polymer conformations (collapsed or extended). This coefficient is independent of the surface area of conformation.
Our simulations show that responds to conformational changes of polystyrene in much the same way as it does for the model LJ polymer treated in our previous work and also complements our finding based on discussed in the Results and Discussion. For purposes of comparison, we define three polymer states based on the individual radius of gyration termed collapsed ( Å), intermediate ( Å), and extended ( Å), for which we have calculated both and . In Fig. S6, we compare the conformation dependence of as a function of distance from PS20 in both TMAO and urea solutions. We find that both TMAO and urea molecules preferentially partition next to all configurations of PS20 (collapsed, intermediate and extended), leading to local-bulk partition coefficient in all cases. However, of TMAO monotonically decreases on going from a collapsed configuration to a relatively extended configuration. Therefore, even though TMAO strongly interacts with the polymer () in all configurations, there is an effective depletion of TMAO independent of polymer surface area on going from the collapsed conformations of polymer to extended conformations. On the other hand, in the case of urea, is less sensitive to the polymer conformation, with being slightly higher near the extended configuration of PS20 than near its collapsed configurations. Clearly, the conformation dependence of in case of TMAO is opposite to that of urea both in PS20 and, as we previously saw, in the model LJ polymer.
A derivation and justification of Eq. 4.
Let us consider two regions of the polymer solution, α and β. Let α be the shell region of the polymer accessible to both water and osmolyte and let β be the bulk region. At equilibrium of the ith component in both regions,
| [S4] |
where and are the total chemical potentials of the ith species in the shell and bulk regions, respectively. The total chemical potential of component i is the sum of an internal and external part, . Here the external potential is due to the attractive or repulsive sites on the polymer. (For example, in electrolytes, the total chemical potential is called the electrochemical potential , where ϕ is the electrostatic potential, is the corresponding electronic charge, and is the electrostatic potential energy of the charge.) Here the intrinsic part is related to the activity of the ions [].
In the polymer solution, the total chemical potential of component i in the polymer shell can be expressed as
| [S5] |
where is the binding potential energy of component i per site of the polymer. In the bulk solution, because component i does not bind to polymer, it does not feel any potential energy due to the polymer. Hence, in bulk, the total chemical potential of the ith species is its intrinsic chemical potential,
| [S6] |
From this, one sees that the internal parts of the total chemical potential need not be equal at equilibrium. They become equal when there is no external potential.
At equilibrium, the total chemical potential of species i in the shell and bulk must be equal,
| [S7] |
so that
| [S8] |
Now, if the polymer is in an extended (E) state, the binding potential energy of the ith component to a site on the extended polymer surface can be expressed as
| [S9] |
Likewise, when the polymer is in the collapsed state (C), the binding potential energy of the ith component to a site on the the collapsed polymer surface can be expressed as
| [S10] |
Let us now consider the polymer’s chemical potential. At equilibrium, the total chemical potential of polymer () in the E or C configuration solvated in solution of water (w) and cosolute (X) will be equal to the chemical potential in the respective configuration of the polymer in the gas phase. Hence, in the extended configuration, at equilibrium,
| [S11] |
where the sum of the terms involving ϕ represents the total potential energy of binding of water and osmolyte to the sites on the polymer, the external contribution to the polymers chemical potential. Here, is the intrinsic chemical potential of the extended polymer in solution, is the number of X molecules bound in the first solvation shell of extended polymer, and is the average potential energy of binding of cosolute X to a site in the polymer’s first solvation shell (and similar notation goes for the water molecules present in the first solvation shell of the extended polymer). Likewise, in the collapsed polymer configuration, at equilibrium,
| [S12] |
Subtracting Eq. S12 from Eq. S11, we find
| [S13] |
Rewriting the Eq. S13, we find
| [S14] |
Substitution of Eqs. S9 and S10 and rearranging Eq. S16, we obtain
| [S15] |
This is the same expression provided in Eq. 4.
Acknowledgments
This work was supported by grants from the National Institutes of Health (NIH-GM4330 to B.J.B.), the National Science Foundation (NSF) (Grant NSF-CHE-0910943), the Office of Naval Research (ONR to G.C.W.), and the National Science and Engineering Research Council of Canada (NSERC to G.C.W.). We gratefully acknowledge the computational support of the Computational Center for Nanotechnology Innovations at Rensselaer Polytechnic Institute, and the Extreme Science and Engineering Discovery Environment, supported by NSF Grant OCI-1053575.
Footnotes
The authors declare no conflict of interest.
This article contains supporting information online at www.pnas.org/lookup/suppl/doi:10.1073/pnas.1511780112/-/DCSupplemental.
References
- 1.Yancey PH, Clark ME, Hand SC, Bowlus RD, Somero GN. Living with water stress: Evolution of osmolyte systems. Science. 1982;217(4566):1214–1222. doi: 10.1126/science.7112124. [DOI] [PubMed] [Google Scholar]
- 2.Wyman J., Jr Linked functions and reciprocal effects in hemoglobin: A second look. Adv Protein Chem. 1964;19:223–286. doi: 10.1016/s0065-3233(08)60190-4. [DOI] [PubMed] [Google Scholar]
- 3.Tanford C. Extension of the theory of linked functions to incorporate the effects of protein hydration. J Mol Biol. 1969;39(3):539–544. doi: 10.1016/0022-2836(69)90143-0. [DOI] [PubMed] [Google Scholar]
- 4.Timasheff SN. Protein-solvent preferential interactions, protein hydration, and the modulation of biochemical reactions by solvent components. Proc Natl Acad Sci USA. 2002;99(15):9721–9726. doi: 10.1073/pnas.122225399. [DOI] [PMC free article] [PubMed] [Google Scholar]
- 5.Parsegian VA, Rand RP, Rau DC. Osmotic stress, crowding, preferential hydration, and binding: A comparison of perspectives. Proc Natl Acad Sci USA. 2000;97(8):3987–3992. doi: 10.1073/pnas.97.8.3987. [DOI] [PMC free article] [PubMed] [Google Scholar]
- 6.Bolen DW, Rose GD. Structure and energetics of the hydrogen-bonded backbone in protein folding. Annu Rev Biochem. 2008;77:339–362. doi: 10.1146/annurev.biochem.77.061306.131357. [DOI] [PubMed] [Google Scholar]
- 7.Courtenay ES, Capp MW, Anderson CF, Record MT., Jr Vapor pressure osmometry studies of osmolyte-protein interactions: Implications for the action of osmoprotectants in vivo and for the interpretation of “osmotic stress” experiments in vitro. Biochemistry. 2000;39(15):4455–4471. doi: 10.1021/bi992887l. [DOI] [PubMed] [Google Scholar]
- 8.Street TO, Bolen DW, Rose GD. A molecular mechanism for osmolyte-induced protein stability. Proc Natl Acad Sci USA. 2006;103(38):13997–14002. doi: 10.1073/pnas.0606236103. [DOI] [PMC free article] [PubMed] [Google Scholar]
- 9.Wang A, Bolen DW. A naturally occurring protective system in urea-rich cells: Mechanism of osmolyte protection of proteins against urea denaturation. Biochemistry. 1997;36(30):9101–9108. doi: 10.1021/bi970247h. [DOI] [PubMed] [Google Scholar]
- 10.Hochachka PW, Somero GN. Biochemical Adaptation. Mechanism and Process in Physiological Evolution. Oxford Univ Press; Oxford: 2002. [Google Scholar]
- 11.Lin TY, Timasheff SN. Why do some organisms use a urea-methylamine mixture as osmolyte? Thermodynamic compensation of urea and trimethylamine N-oxide interactions with protein. Biochemistry. 1994;33(42):12695–12701. doi: 10.1021/bi00208a021. [DOI] [PubMed] [Google Scholar]
- 12.Rose GD, Fleming PJ, Banavar JR, Maritan A. A backbone-based theory of protein folding. Proc Natl Acad Sci USA. 2006;103(45):16623–16633. doi: 10.1073/pnas.0606843103. [DOI] [PMC free article] [PubMed] [Google Scholar]
- 13.Liu Y, Bolen DW. The peptide backbone plays a dominant role in protein stabilization by naturally occurring osmolytes. Biochemistry. 1995;34(39):12884–12891. doi: 10.1021/bi00039a051. [DOI] [PubMed] [Google Scholar]
- 14.Auton M, Rösgen J, Sinev M, Holthauzen LMF, Bolen DW. Osmolyte effects on protein stability and solubility: A balancing act between backbone and side-chains. Biophys Chem. 2011;159(1):90–99. doi: 10.1016/j.bpc.2011.05.012. [DOI] [PMC free article] [PubMed] [Google Scholar]
- 15.Auton M, Ferreon ACM, Bolen DW. Metrics that differentiate the origins of osmolyte effects on protein stability: A test of the surface tension proposal. J Mol Biol. 2006;361(5):983–992. doi: 10.1016/j.jmb.2006.07.003. [DOI] [PubMed] [Google Scholar]
- 16.Godawat R, Jamadagni SN, Garde S. Unfolding of hydrophobic polymers in guanidinium chloride solutions. J Phys Chem B. 2010;114(6):2246–2254. doi: 10.1021/jp906976q. [DOI] [PubMed] [Google Scholar]
- 17.Fiore A, Venkateshwaran V, Garde S. Trimethylamine N-oxide (TMAO) and tert-butyl alcohol (TBA) at hydrophobic interfaces: Insights from molecular dynamics simulations. Langmuir. 2013;29(25):8017–8024. doi: 10.1021/la401203r. [DOI] [PubMed] [Google Scholar]
- 18.Graziano G. Size and temperature dependence of hydrocarbon solubility in concentrated aqueous solutions of urea and guanidine hydrochloride. Can J Chem. 2002;80(4):388–400. [Google Scholar]
- 19.Cho SS, Reddy G, Straub JE, Thirumalai D. Entropic stabilization of proteins by TMAO. J Phys Chem B. 2011;115(45):13401–13407. doi: 10.1021/jp207289b. [DOI] [PMC free article] [PubMed] [Google Scholar]
- 20.Paul S, Patey GN. The influence of urea and trimethylamine-N-oxide on hydrophobic interactions. J Phys Chem B. 2007;111(28):7932–7933. doi: 10.1021/jp0733668. [DOI] [PubMed] [Google Scholar]
- 21.Zangi R, Zhou R, Berne BJ. Urea’s action on hydrophobic interactions. J Am Chem Soc. 2009;131(4):1535–1541. doi: 10.1021/ja807887g. [DOI] [PubMed] [Google Scholar]
- 22.Athawale MV, Dordick JS, Garde S. Osmolyte trimethylamine-N-oxide does not affect the strength of hydrophobic interactions: Origin of osmolyte compatibility. Biophys J. 2005;89(2):858–866. doi: 10.1529/biophysj.104.056671. [DOI] [PMC free article] [PubMed] [Google Scholar]
- 23.Macdonald RD, Khajehpour M. Effects of the osmolyte TMAO (Trimethylamine-N-oxide) on aqueous hydrophobic contact-pair interactions. Biophys Chem. 2013;184:101–107. doi: 10.1016/j.bpc.2013.10.001. [DOI] [PubMed] [Google Scholar]
- 24.Li ITS, Walker GC. Single polymer studies of hydrophobic hydration. Acc Chem Res. 2012;45(11):2011–2021. doi: 10.1021/ar200285h. [DOI] [PubMed] [Google Scholar]
- 25.Zhang X, Liu C, Wang Z. Force spectroscopy of polymers: Studying on intramolecular and intermolecular interactions in single molecular level. Polymer (Guildf) 2008;49(16):3353–3361. [Google Scholar]
- 26.Janshoff A, Neitzert M, Oberdörfer Y, Fuchs H. Force spectroscopy of molecular systems—Single molecule spectroscopy of polymers and biomolecules. Angew Chem Int Ed Engl. 2000;39(18):3212–3237. doi: 10.1002/1521-3773(20000915)39:18<3212::aid-anie3212>3.0.co;2-x. [DOI] [PubMed] [Google Scholar]
- 27.Nash MA, Gaub HE. Single-molecule adhesion of a stimuli-responsive oligo(ethylene glycol) copolymer to gold. ACS Nano. 2012;6(12):10735–10742. doi: 10.1021/nn303963m. [DOI] [PubMed] [Google Scholar]
- 28.Horinek D, et al. Peptide adsorption on a hydrophobic surface results from an interplay of solvation, surface, and intrapeptide forces. Proc Natl Acad Sci USA. 2008;105(8):2842–2847. doi: 10.1073/pnas.0707879105. [DOI] [PMC free article] [PubMed] [Google Scholar]
- 29.Kienle S, Liese S, Schwierz N, Netz RR, Hugel T. The effect of temperature on single-polypeptide adsorption. ChemPhysChem. 2012;13(4):982–989. doi: 10.1002/cphc.201100776. [DOI] [PubMed] [Google Scholar]
- 30.Walther KA, et al. Signatures of hydrophobic collapse in extended proteins captured with force spectroscopy. Proc Natl Acad Sci USA. 2007;104(19):7916–7921. doi: 10.1073/pnas.0702179104. [DOI] [PMC free article] [PubMed] [Google Scholar]
- 31.Bu T, Wang HCE, Li H. Single molecule force spectroscopy reveals critical roles of hydrophobic core packing in determining the mechanical stability of protein GB1. Langmuir. 2012;28(33):12319–12325. doi: 10.1021/la301940g. [DOI] [PubMed] [Google Scholar]
- 32.Cao Y, Li H. How do chemical denaturants affect the mechanical folding and unfolding of proteins? J Mol Biol. 2008;375(1):316–324. doi: 10.1016/j.jmb.2007.10.024. [DOI] [PubMed] [Google Scholar]
- 33.Yamamoto S, Tsujii Y, Fukuda T. Atomic force microscopic study of stretching a single polymer chain in a polymer brush. Macromolecules. 2000;33(16):5995–5998. [Google Scholar]
- 34.Gunari N, Balazs AC, Walker GC. Force-induced globule-coil transition in single polystyrene chains in water. J Am Chem Soc. 2007;129(33):10046–10047. doi: 10.1021/ja068652w. [DOI] [PubMed] [Google Scholar]
- 35.Li ITS, Walker GC. Interfacial free energy governs single polystyrene chain collapse in water and aqueous solutions. J Am Chem Soc. 2010;132(18):6530–6540. doi: 10.1021/ja101155h. [DOI] [PubMed] [Google Scholar]
- 36.Li ITS, Walker GC. Signature of hydrophobic hydration in a single polymer. Proc Natl Acad Sci USA. 2011;108(40):16527–16532. doi: 10.1073/pnas.1105450108. [DOI] [PMC free article] [PubMed] [Google Scholar]
- 37.Mondal J, Stirnemann G, Berne BJ. When does trimethylamine N-oxide fold a polymer chain and urea unfold it? J Phys Chem B. 2013;117(29):8723–8732. doi: 10.1021/jp405609j. [DOI] [PMC free article] [PubMed] [Google Scholar]
- 38.Rodríguez-Ropero F, van der Vegt NFA. Direct osmolyte–macromolecule interactions confer entropic stability to folded states. J Phys Chem B. 2014;118(26):7327–7334. doi: 10.1021/jp504065e. [DOI] [PubMed] [Google Scholar]
- 39.Reddy PM, Taha M, Venkatesu P, Kumar A, Lee MJ. Destruction of hydrogen bonds of poly(N-isopropylacrylamide) aqueous solution by trimethylamine N-oxide. J Chem Phys. 2012;136(23):234904. doi: 10.1063/1.4729156. [DOI] [PubMed] [Google Scholar]
- 40.Halperin A, Zhulina E. Stretching polymer brushes in poor solvents. Macromolecules. 1991;24(19):5393–5397. [Google Scholar]
- 41.Gräter F, Heider P, Zangi R, Berne BJ. Dissecting entropic coiling and poor solvent effects in protein collapse. J Am Chem Soc. 2008;130(35):11578–11579. doi: 10.1021/ja802341q. [DOI] [PubMed] [Google Scholar]
- 42.Einert TR, Sing CE, Alexander-Katz A, Netz RR. Conformational dynamics and internal friction in homopolymer globules: Equilibrium vs. non-equilibrium simulations. Eur Phys J E Soft Matter. 2011;34(12):1–16. doi: 10.1140/epje/i2011-11130-8. [DOI] [PubMed] [Google Scholar]
- 43.Das P, Xia Z, Zhou R. Collapse of a hydrophobic polymer in a mixture of denaturants. Langmuir. 2013;29(15):4877–4882. doi: 10.1021/la3046252. [DOI] [PubMed] [Google Scholar]
- 44.Saito M, Yabe A. Dispersion and polar force components of surface tension of some polymer films. Text Res J. 1983;53(1):54–59. [Google Scholar]
- 45.Adamson AW, Gast AP. Physical Chemistry of Surfaces. Wiley; New York: 1990. [Google Scholar]
- 46.Rankin BM, Ben-Amotz D. Expulsion of ions from hydrophobic hydration shells. J Am Chem Soc. 2013;135(24):8818–8821. doi: 10.1021/ja4036303. [DOI] [PubMed] [Google Scholar]
- 47.Hutter JL, Bechhoefer J. Calibration of atomic force microscope tips. Rev Sci Instrum. 1993;64(7):1868–1873. [Google Scholar]
- 48.Pegram LM, Record MT., Jr Hofmeister salt effects on surface tension arise from partitioning of anions and cations between bulk water and the air-water interface. J Phys Chem B. 2007;111(19):5411–5417. doi: 10.1021/jp070245z. [DOI] [PubMed] [Google Scholar]
- 49.Best RB, et al. Optimization of the additive CHARMM all-atom protein force field targeting improved sampling of the backbone φ, ψ and side-chain χ1 and χ2 dihedral angles. J Chem Theory Comput. 2012;8(9):3257–3273. doi: 10.1021/ct300400x. [DOI] [PMC free article] [PubMed] [Google Scholar]
- 50.Park S, Zhu X, Yethiraj A. Atomistic simulations of dilute polyelectrolyte solutions. J Phys Chem B. 2012;116(14):4319–4327. doi: 10.1021/jp208138t. [DOI] [PubMed] [Google Scholar]
- 51.Jorgensen WL, Chandrasekhar J, Madura JD, Impey RW, Klein ML. Comparison of simple potential functions for simulating liquid water. J Chem Phys. 1983;79(2):926–935. [Google Scholar]
- 52.Kast KM, Brickman J, Kast SM, Berry RS. Binary phases of aliphatic N-oxides and water: Force field development and molecular dynamics simulation. J Phys Chem A. 2003;107(27):5342–5351. [Google Scholar]
- 53.Jorgensen WL, Maxwell DS, Tirado-Rives J. Development and testing of the opls all-atom force field on conformational energetics and properties of organic liquids. J Am Chem Soc. 1996;118(45):11225–11236. [Google Scholar]
- 54.Rossi G, Monticelli L, Puisto SR, Vattulainen I, Ala-Nissila T. Coarse-graining polymers with the martini force-field: Polystyrene as a benchmark case. Soft Matter. 2011;7(2):698–708. [Google Scholar]
- 55.Berendsen HJC, Grigera JR, Straatsma TP. The missing term in effective pair potentials. J Phys Chem. 1987;91(24):6269–6271. [Google Scholar]
- 56.Hess B, Kutzner C, Van der Spoel D, Lindahl E. Gromacs 4: Algorithms for highly efficient, load-balanced, and scalable molecular simulation. J Chem Theory Comput. 2008;4(3):435–447. doi: 10.1021/ct700301q. [DOI] [PubMed] [Google Scholar]
- 57.Bonomi M, Branduardi D, Bussi G, Camilloni C, Parrinello M. PLUMED: A portable plugin for free-energy calculations with molecular dynamics. Comput Phys Commun. 2009;180(10):1961–1972. [Google Scholar]
- 58.Kumar S, Bouzida D, Swendsen RH, Kollman PA, Rosenberg JM. The weighted histogram analysis method for free-energy calculations on biomolecules. I. The method. J Comput Chem. 1992;13(8):1011–1021. [Google Scholar]
- 59.Grossfield A. 2014 WHAM: the weighted histogram analysis method, version 2.0.9. Available at membrane.urmc.rochester.edu/content/version-209. Accessed July 4, 2015.
- 60.Shukla D, Shinde C, Trout BL. Molecular computations of preferential interaction coefficients of proteins. J Phys Chem B. 2009;113(37):12546–12554. doi: 10.1021/jp810949t. [DOI] [PubMed] [Google Scholar]
- 61.Canchi DR, Jayasimha P, Rau DC, Makhatadze GI, Garcia AE. Molecular mechanism for the preferential exclusion of TMAO from protein surfaces. J Phys Chem B. 2012;116(40):12095–12104. doi: 10.1021/jp304298c. [DOI] [PMC free article] [PubMed] [Google Scholar]


