Significance
Multiphoton microscopy has been the gold standard for in vivo deep-tissue imaging. The long laser wavelength suffers less scattering, and the 3D-confined excitation permits the use of scattered signal light, which greatly improves the imaging depth. However, the direct application of this method to highly turbid media has been limited. Here, we present a microscope system demonstrating high resolution in vivo imaging inside highly turbid tissue. We use advanced wavefront correction with an adaptive correction plane-positioning system to compensate high-order aberrations over an extended corrected field of view. Using this technique, we demonstrate submicron-resolution imaging of neural dendrites and microglia dynamics through the intact skulls of adult mice.
Keywords: neuroimaging, nonlinear microscopy, wavefront shaping, immunology, adaptive optics
Abstract
Multiphoton microscopy is the current method of choice for in vivo deep-tissue imaging. The long laser wavelength suffers less scattering, and the 3D-confined excitation permits the use of scattered signal light. However, the imaging depth is still limited because of the complex refractive index distribution of biological tissue, which scrambles the incident light and destroys the optical focus needed for high resolution imaging. Here, we demonstrate a wavefront-shaping scheme that allows clear imaging through extremely turbid biological tissue, such as the skull, over an extended corrected field of view (FOV). The complex wavefront correction is obtained and directly conjugated to the turbid layer in a noninvasive manner. Using this technique, we demonstrate in vivo submicron-resolution imaging of neural dendrites and microglia dynamics through the intact skulls of adult mice. This is the first observation, to our knowledge, of dynamic morphological changes of microglia through the intact skull, allowing truly noninvasive studies of microglial immune activities free from external perturbations.
Breakthroughs in imaging technologies have been one of the major driving forces of new discoveries in biology (1). In the past two decades, we have witnessed that the advances of superresolution microscopy revolutionized our understanding of the complex dynamics in single cells (2). However, the techniques that work well on cultured cells often fail when being used to observe the cells in their native environment inside a living organism, the most ideal condition for biological studies. These difficulties result from the optical wavefront distortions induced by the inhomogeneous refractive index distribution in biological tissue.
Because of this limitation, imaging inside deep tissue has been a challenging task, and the common goal of state of the art deep tissue-imaging methods is to recover the diffraction-limited resolution. These efforts can be categorized largely into two groups: the first capitalizes the use of longer wavelengths (3, 4) that undergo less scattering, whereas the second controls the optical wavefront, so that the wavefront distortions induced by the sample can be compensated (5–30). Longer wavelength excitation has demonstrated impressive penetration depths in the exposed brain (3) and imaging of the brain vascular structures beneath the skull (4). However, at the current state, using longer wavelengths is not a simple option because it requires special illumination sources [e.g., low repetition rate, high energy pulses (3)] or fluorescent probes (4), and provides only moderate spatial resolutions. In comparison, wavefront shaping allows the use of conventional light sources as well as the wide selection of well-established labels and functional indicators (31).
Previous exciting works in adaptive optics (AO) have exploited these advantages and demonstrated aberration correction for a large field of view (FOV) by averaging the correction wavefront or using only the low-order modes of correction (5–9). However, these methods are valid when imaging transparent tissues or at shallow depth in turbid tissues. When imaging through highly turbid tissues, such as the skulls of adult mice, light is severely distorted before reaching the focus (14). To compensate such high levels of wavefront distortions, the input wavefront has to be controlled accurately using a much greater number of spatial modes, which would be washed out if averaged over an extended area.
To overcome the limitations of conventional AO, sophisticated wavefront control has recently emerged as a technique to compensate high-order wavefront distortions (13–28). This has been made possible by the development of wavefront modulators with a large number of pixels and can be considered as the extreme case of AO. Taking advantage of the complex wavefront shaping, recent works have demonstrated that many degrees of freedom of light can be controlled via multiple scattering (18). However, because of the 3D complexity of the turbid medium, the wavefront correction is only valid for a very limited range, which is approximately the size of a speckle in the extreme case of focusing in the diffusive regime.
To extend the corrected FOV through heterogeneous media, multiconjugate AO was developed for astronomical telescopes (32), which employs several wavefront correctors, each conjugated to a different layer of air turbulence to account for the 3D distribution of wavefront distortion. Deep-tissue imaging faces the similar problem, and others have worked in this area of research showing that correction in conjugated-image planes is also possible for microscopy applications (33–36).
Here, we note that some relevant biological systems, such as the brain, is covered by a single dominant scattering layer (the skull), which suggests that a single conjugated-wavefront correction may substantially increase the corrected FOV. To test this idea, we developed an adaptive correction plane-positioning system to implement single-conjugation AO in vivo. Our experiments show that by placing the wavefront modulator in a plane conjugate to the turbid layer, the corrected FOV can be substantially increased. We obtained high-order wavefront correction without averaging over the FOV, resulting in large improvement in image resolution and contrast through highly turbid media, such as the skulls of adult mice. Using this technique, we show that a simple add-on to a conventional two-photon microscope can recover the microscope’s original resolution in both the spatial and temporal domains when imaging through the intact skulls of adult mice. By recovering the submicron spatial resolution through the skull, we obtained clear images of the neural dendritic structures and microglia cells. By recovering the temporal resolution, we observed the dynamic morphology changes of the microglia through the intact skull, for the first time to our knowledge. Because no skull removal or thinning is involved, our method provides a noninvasive solution to observe the cellular dynamics of the brain, which is important for the study of diseases in the central nervous system (CNS).
Results and Discussion
Turbid Layer-Conjugated Complex Wavefront Shaping.
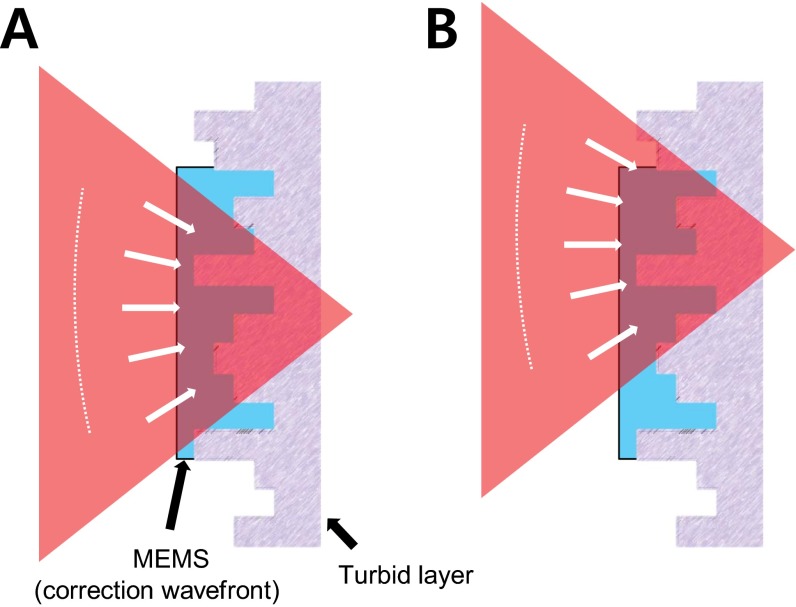
In conventional AO microscope systems, the wavefront modulator, a deformable mirror (DM), is placed at the rear pupil plane of the objective. Wavefront correction at the pupil plane works under the assumption that the correction profile is translation-invariant in the imaging plane. Such a configuration is adopted by perhaps every AO-based microscopy system, which is convenient because the light-intensity profile remains stationary at the pupil plane, and the transverse scanning is equivalent to applying linear-phase slopes on this plane. However, in highly turbid tissues, the translation invariance does not hold. Unless the wavefront-shaping device actively adjusts the correction wavefront for different scan angles, mismatch between the wavefront distortion and compensation will occur during the scanning (Fig. 1A). If the wavefront modulator is instead conjugated to the turbid layer, the majority of the laser beam still goes through the correctly compensated path (Fig. 1B).
Fig. 1.
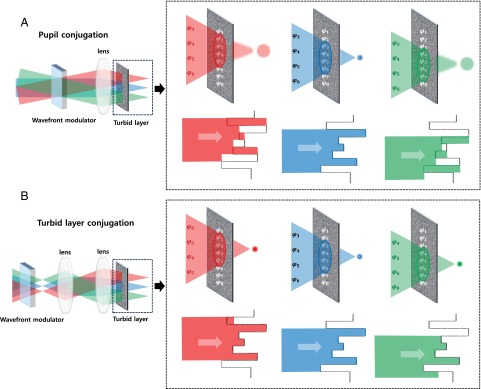
Complex wavefront correction for larger FOV. (A) In conventional AO-based microscopes, the DM is placed at the pupil plane. Each pixel of the modulator corresponds to a specific wave vector at the focal plane of the objective, and translational invariance in the correction profile is implemented. As the beam is scanned, the correction wavefront is translated accordingly across the turbid layer, resulting in decorrelation between the correction profile and the turbid layer. (B) By conjugating the wavefront modulator to the turbid layer, each pixel of the wavefront modulator has a one-to-one correspondence with a specific area of the turbid layer. As the beam is scanned, the light that passes through a specific pixel of the wavefront modulator always impinges on the same position on the sample and the translation induced wavefront decorrelation is therefore reduced (Fig. S1).
Fig. S1.
Beam scanning in the turbid layer-conjugation geometry. (A) The beam is parked at a target location. The schematic illustrates the turbid layer as a thin random phase plate, where the MEMS compensates the phase distortions after the wavefront measurement. Through this window, the aberrations are compensated efficiently and the impinging spherical wave on the MEMS passes through the turbid layer, resulting in a diffraction-limited focus at the target position. (B) As the MEMS is conjugated to the turbid layer, the correction pattern is stationary while the beam is scanned. For an infinitely thin turbid layer, the correction would still be perfect and the correction efficiency will only drop as a function of the area that shifts to the outside of the correction pattern. In reality, biological tissues have finite thickness, and therefore the infinitely thin turbid-layer assumption is inaccurate. Comparing A and B, we can find that the beam incident on the individual pixels of the MEMS changes incident angle because of the translation of the spherical wavefront. Therefore, the wavefront correction is no longer perfect, leading to a reduced Strehl ratio.
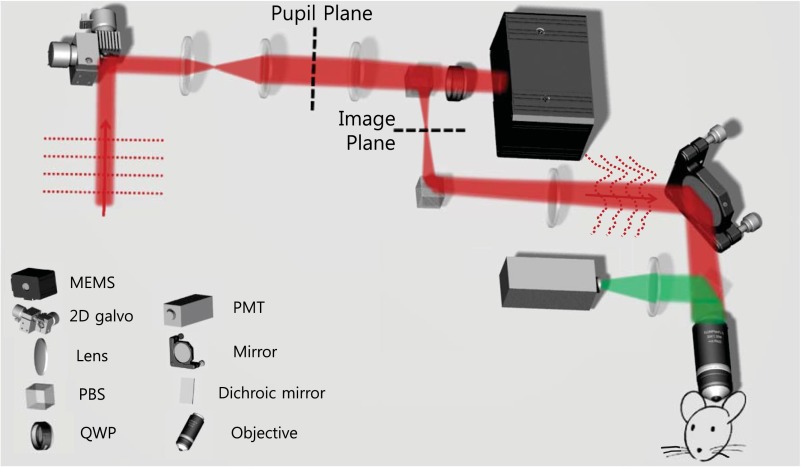
Here, we take advantage of the turbid layer-conjugated geometry and incorporate it into a conventional two-photon microscope, which only requires the addition of a microelectromechanical systems (MEMS)-based DM (Kilo-DM; Boston Micromachines), as shown in Fig. 2. The MEMS plane was conjugated to the surface of the skull, which was between the image and pupil planes of the microscope. The MEMS and relay-beam splitters were placed on a translational stage for adaptive positioning without altering the total optical path length or beam direction. With such a design, the MEMS could be freely translated to optimize the corrected imaging FOV. The optimally positioned MEMS played the dual role of wavefront measurement and wavefront correction that worked noninvasively by using the two-photon fluorescence signal inherent in the sample (Methods).
Fig. 2.
Setup of the two-photon microscope incorporating adaptive positioning of the MEMS mirror. PBS, polarizing beam splitter; PMT, photomultiplier tube; QWP, quarter wave plate.
Proof of Principle Demonstration Through Turbid Layer.
To test the FOV advantage of the turbid layer-conjugated wavefront correction, we prepared a phantom using nontransparent adhesive tape as the turbid medium. We mimicked targeted cells embedded in turbid tissue (e.g., neuroglia under the skull) by sandwiching three layers of nontransparent tape (∼150 µm thick) and fluorescent beads between two coverslips (Fig. 3A).
Fig. 3.
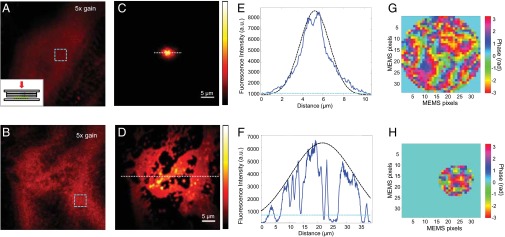
Corrected FOV enhancement with phantom sample. (A and B) Fluorescent beads (0.2 µm) imaged through three layers of nontransparent tape with system correction. (Inset) Sample configuration: three layers of nontransparent adhesive tape and fluorescent beads sandwiched between two coverslips. (C and D) Same area in A and B imaged with full correction by the pupil-conjugated and turbid layer-conjugated configurations, respectively. A and B have been intensified by 5× to make the image visible. (E and F) Signal intensity along the dotted lines in C and D (averaged over six neighboring lines). The dark dotted line shows a Gaussian envelope with FWHM of 4.6 and 26 µm, respectively. We show the average intensity within the turquoise dotted squares in A and B with the turquoise dotted line. (G and H) The correction wavefronts for the pupil-conjugated and turbid layer-conjugated configurations. For the turbid layer-conjugated configuration, the MEMS was conjugated to 100 µm from the image plane. Only the pixels of sufficient signal levels were used, whereas the rest of the MEMS pixels were set to a constant phase value (Methods).
As shown in Fig. 3 A and B, the original image of the beads obtained through the tape was very blurry, the signal was rather weak, and the image contained a significant amount of out-of-focus background. Using pupil-plane correction, we could greatly improve the focus quality (Fig. 3C). However, the spatially varying refractive index distribution led to rapid decorrelation between the scanned wavefront and the turbid tape, and the corrected FOV was only 4.6 µm in diameter. In comparison, using the adaptive-correction plane-positioning setup, we could flexibly conjugate the wavefront-correction plane to the middle of the turbid layer to maximize the corrected FOV. The imaging results (Fig. 3D) show that the turbid-layer conjugation increased the corrected FOV to 26 µm in diameter, increasing the imaging area by a factor of 32.
In Vivo High-Resolution Imaging Through the Intact Skull.
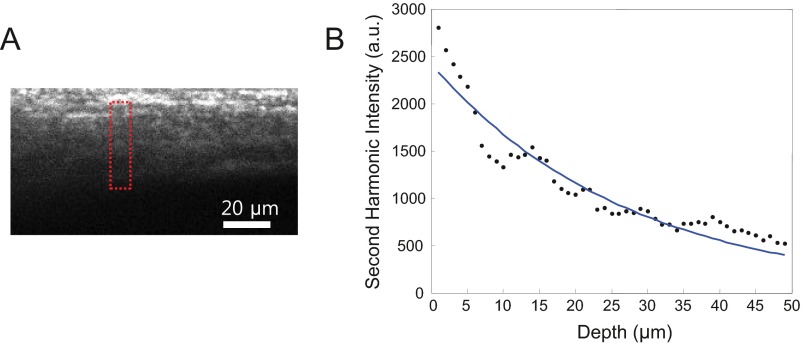
To evaluate our system’s performance on live animals, we imaged YFP-expressing dendrites through the intact skulls of adult mice as shown in Fig. 4. In two-photon microscopy, the laser intensity obtained at the focus scales as I ∝ , where z is the imaging depth and is the scattering mean free path. We measured the scattering mean free path of the skull at 935 nm to be <55 µm (Fig. S2), resulting in <6.5% Strehl ratio through the 150-µm-thick skull. Furthermore, as the confinement of the two-photon excitation volume degraded because of high-order wavefront distortions, both the spatial resolution and contrast were lost, as shown in Fig. 4A. Using wavefront correction, we were able to increase the fluorescence signal by a factor of 6.5 (Fig. 4B). The diffusive haze, which originally wiped out the imaging contrast, has also disappeared because of the reduced out-of-focus excitation and increased Strehl ratio. A single wavefront correction at the conjugation plane can provide an extended corrected FOV of ∼300 µm2. The diffraction-limited resolution was also recovered (Fig. 4D and Fig. S3), allowing clear imaging of the dendritic spines through the intact skull.
Fig. 4.
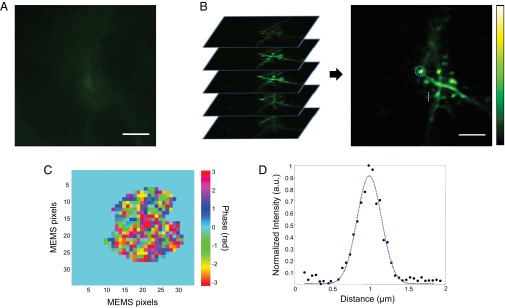
In vivo imaging of dendritic spines through the intact skull. (A) Maximum-intensity projection (MIP) of the volume stack obtained with system correction. Neurons at the superficial layer of the brain were imaged through 150 µm of intact skull. (B) MIP of the volume imaged with wavefront correction after 3D deconvolution. We merged 20 z-stacks with 1-µm axial spacing for the MIP. Submicron-sized spine neck and head structures can clearly be identified. The blue dotted circle denotes the laser beam position during wavefront measurement. A and B share the same color bar and were acquired with the same laser power. (Scale bars: 5 µm.) (C) Wavefront correction profile. (D) Plot along the white dotted line in B (averaged over six neighboring lines), passing through a spine neck. The blue dotted line shows the Gaussian fit with FWHM of 400 ± 30 nm. An original image before deconvolution is provided in Fig. S3.
Fig. S2.
Scattering properties of the skull. (A) MIP of second harmonic generation (SHG) signal from the skull tissue. (B) Averaged SHG signal versus imaging depth. Blue solid line shows the exponential fit with a scattering mean free path of ∼55 µm. In our measurement, a part of the skull that had the least amount of cavities (red dotted square in A) was selected because of the need for a SHG signal source. Because the skull has a very complex 3D structure containing many bone marrow cavities, the SHG measurement can only give an estimate of the actual scattering mean free path. Moreover, because the bone is distributed in 3D, the overall SHG signal contains the ballistic contribution and the signal generated by out-of-focus excitation attributable to aberration and scattering. Therefore, the actual ballistic signal decay may be a steeper function. Previous literature reports a scattering mean free path of ∼35–40 µm for the pig skull (43).
Fig. S3.
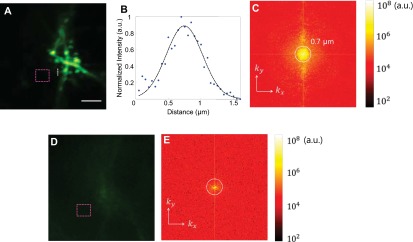
Recovery of diffraction-limited resolution. (A) MIP of the raw data used for the deconvolution in Fig. 4. (Scale bar: 5 µm.) (B) Plot of the dendritic spine neck along the dotted white line in A. Before deconvolution, the original diffraction-limited resolution of the microscope is recovered through the intact skull. The black dotted line shows the Gaussian fit with an FWHM of 0.69 µm, agreeing well with the measured system PSF in a clear medium. (C) The Fourier spectrum of A. (D) The same FOV before correction. (E) The Fourier spectrum of D. As a result of severe wavefront distortions, the out-of-focus excitation overwhelmed the ballistic excitation without correction. As the total power of the laser remained the same (phase-only wavefront shaping), after correction, the out-of-focus excitation was reduced, whereas the laser focus became stronger. To quantify the reduced background, we compared the average signal in the magenta dotted squares in A and D and found that the background was reduced by 2.6.
Through experiments, we found that the wavefront correction for through-skull imaging remained valid for hours. Therefore, we only need to carry out the wavefront measurement once before the time-lapse imaging of dynamic processes (Methods). Within the FOV, the temporal resolution was exactly the same as that of conventional two-photon microscope systems. Exploiting this property, we demonstrated time-lapse imaging of the spontaneous morphology changes of microglia in its natural state as shown in Fig. 5 and Movie S1. For the first time to our knowledge, we observed the dynamic morphology changes of the microglia without removing or thinning the skull, which are known to have deleterious effects on the immune system (37). Because high-resolution imaging of the resident immune cells is crucial to the understanding of the CNS immune system, our noninvasive imaging technique provides an ideal platform for studying CNS diseases (38).
Fig. 5.
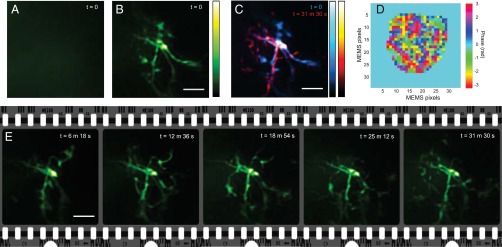
Time-lapse imaging of microglia in its resting state. (A) MIP of the image recorded with system correction. Wavefront distortions through the skull blurred out all information, resulting in a haze. (B) MIP recorded for the same FOV with wavefront correction at the initial state (defined as t = 0). We imaged microglia 180 µm from the skull surface through the 150-µm-thick skull. (C) MIPs of image volumes recorded at t = 0 and t = 31.5 min merged in cyan and red, respectively. Active morphology changes can be clearly seen. The long-term observation also demonstrates the stability of the wavefront compensation. (D) Correction wavefront profile used for all images obtained during the time-lapse imaging. (E) Time trace of the spontaneous microglia dynamics. MIPs are shown for consecutive time frames. The 3D-rendered movie is provided as Movie S1. All MIPs have been 3D-deconvolved. (Scale bars: 5 µm.)
Conclusions
We have demonstrated, for the first time to our knowledge, dynamic submicron resolution imaging of neuroglial morphological changes through the intact skulls of live adult mice. The setup only requires the simple addition of a DM at an intermediate plane in a conventional two-photon microscope with the goal of easy dissemination among a broad range of microscope users. The turbid layer-conjugated correction works at its best for a concentrated thin layer of turbid medium (Fig. S4). In the case of the mouse skull (∼150 µm thick) studied in this work, we obtained a 15-fold improvement in the corrected FOV (Figs. S5 and S6). The improvement for uniform volume of turbid medium will be less, but in general, the conjugation plane correction is expected to remain superior to the pupil-plane correction (Fig. S4). We envision that the additional conjugation of a few DMs, similar to the multiconjugate AO used in astronomy (39), could more effectively compensate thick tissue (40) to achieve a greater corrected FOV, albeit at the cost of system complexity.
Fig. S4.
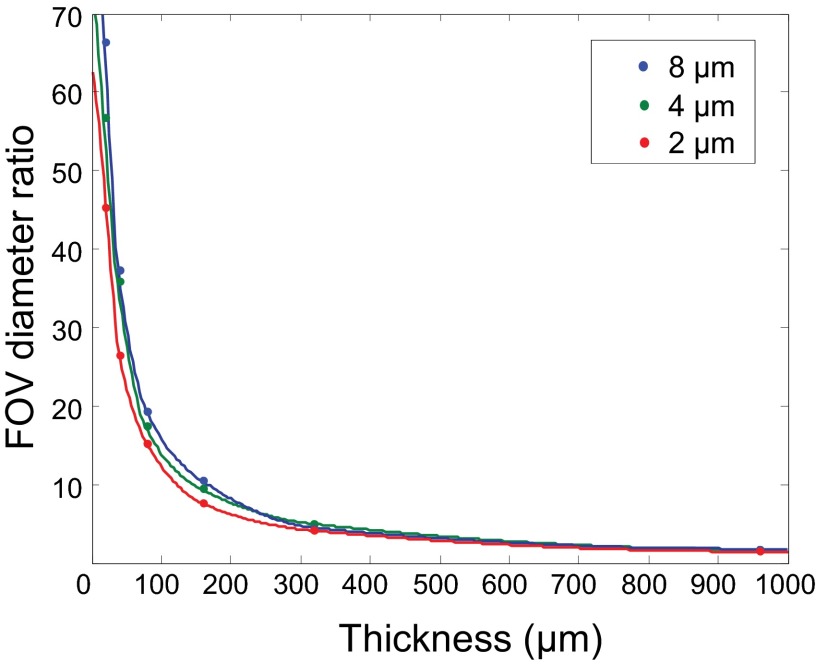
The dependence of FOV improvement on tissue thickness. To investigate the dependence of the FOV improvement with turbid-layer conjugation on the thickness of the tissue volume, we used numerical methods (36) to simulate the light propagation in a random turbid tissue. We set the tissue feature size to 2, 4, and 8 µm (i.e., how fast the refractive index changes over space). The center of the tissue was at 480 µm away from the focal plane, and we varied the tissue thickness from 20 to 960 µm. At 960 µm, there was no space between the focal plane and the tissue (fully occupied tissue volume). The thinner the tissue, the better the single conjugation worked. Although the tissue thickness was varied, we controlled its refractive index profile, so that all tissues reduced the Strehl ratio to 4–5%. We set the averaged refractive index of the tissue to 1.33 and used an NA 0.6 water-dipping lens to focus the incident light. We can see that the FOV advantage decreased as the tissue became thicker and thicker. What is interesting is that even when the tissue fully occupied the volume (960-µm-thick tissue; conjugation plane at 480 µm), single conjugation could still provide ∼threefold correction area compared with the pupil-plane correction. This implies that when correcting spatially varying wavefront distortions, it is always advantageous to conjugate the MEMS mirror to the tissue rather than to the pupil plane.
Fig. S5.
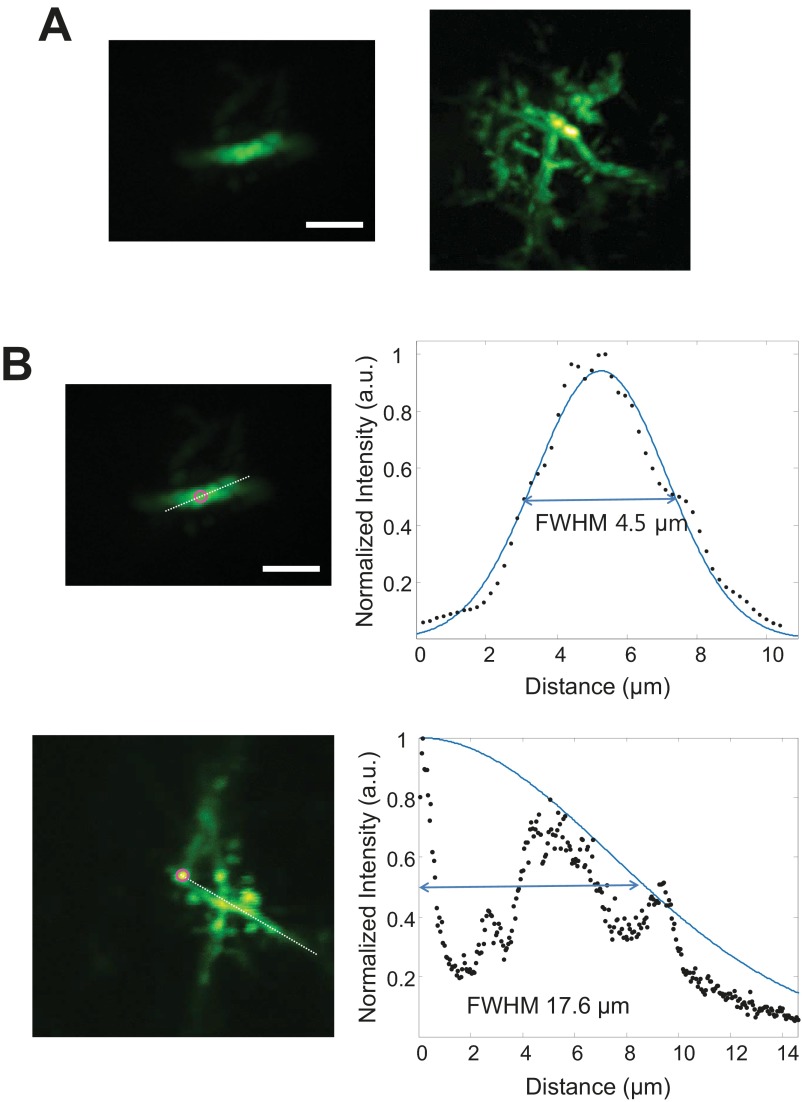
Comparison between pupil-plane correction and turbid-layer conjugation correction for in vivo transcranial optical imaging. (A) MIP of a dendrite obtained with pupil correction (Left) and MIP of neuroglia obtained with skull conjugation (Right). (B) Gaussian fitting of the corrected FOV. The white dashed lines mark the position of the Gaussian fitting. Magenta circles mark the center of the FOV. The FWHM of the pupil correction is 4.5 µm, whereas the skull conjugation shows an FWHM of 17.6 µm, providing a 15-fold area improvement. (Scale bar: 5 µm.)
Fig. S6.
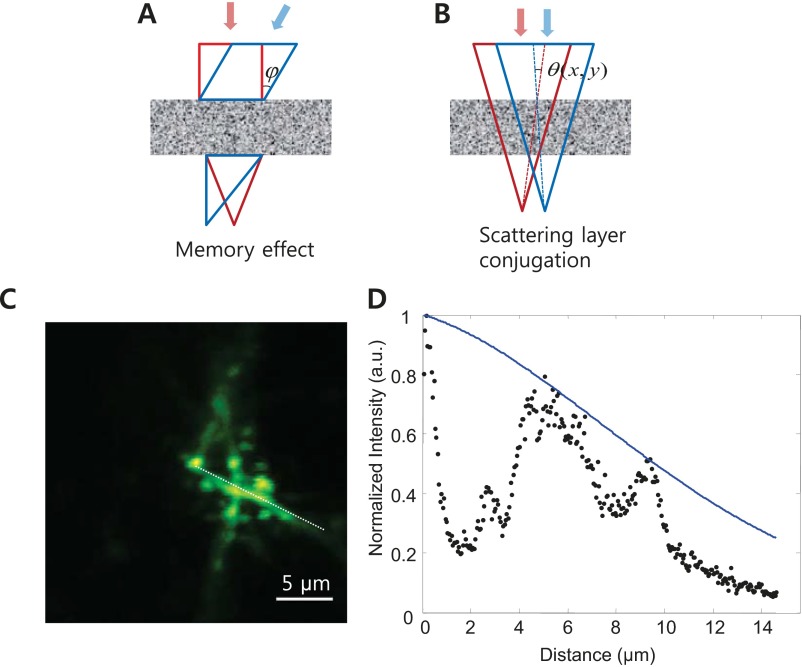
Consideration of the memory effect. (A) In the memory effect, the entire wavefront is tilted by the same angle , leading to tilting of the transmitted beam. (B) In the single-conjugation system, the wavefront corrector and the skull remain fixed with respect to each other. During the raster scanning, the light incident at any specific position on the skull changes its angle. However, unlike the memory effect, the angle change is not uniform [i.e., the angle tilt varies across the optical beam]. Using the dendrite image in C, we obtained the scan range through the skull. We used the averaged angular tilt across the beam as the tilting angle in the memory effect. (D) Black dots show the fluorescence intensity obtained along the dotted white line in C. The solid blue line denotes the expected decay taking into account both the beam translation and the incident angle change. The fitting was based on the memory effect (44): , where (n =1.33), is the average tilting angle, and L is the effective thickness of the turbid layer. The effective thickness L was found to be ∼2.3 µm, which was ∼60 times smaller than the physical thickness of the skull. This finding agreed well with recent work that measured the effective thickness of biological tissue to be over an order of magnitude smaller than its physical thickness (45). The large difference between the physical thickness and the measured effective thickness is attributable to the fact that the memory-effect formula assumes fully diffused transmission, whereas there are still ballistic components through skull in our experiments. These findings are advantageous for bioimaging because they demonstrate that biological tissues (even as turbid as the skull) have an effective thickness orders of magnitude smaller than its physical thickness, which allows a wide FOV imaging after a single wavefront measurement and correction.
Methods
In Vivo Wavefront Measurement and Compensation.
The backbone of the wavefront measurement and compensation method used in this work was based on the iterative multiphoton adaptive-compensation technique (IMPACT) (14). Specifically, we used the two-photon excited fluorescence signal from either YFP-expressing neurons or GFP-expressing microglia as the feedback signal for wavefront measurement. Experimentally, we split the MEMS pixels into two groups. We kept one group stationary as the reference field and modulated the other group, each pixel at a unique frequency. Fourier transformation of the modulated fluorescence signal yielded the phase and amplitude of the electric field controlled by these modulated MEMS pixels at the laser focus. We then displayed the negative phase values on the MEMS to compensate for wavefront distortions. We let the two groups take turns to be the reference and modulated fields. Three iterations concluded the wavefront measurements, which took ∼4.4 s for 952 pixels (4.6-ms measurement time per pixel). Because only a portion of the MEMS pixels contribute to the wavefront correction, the total measurement time could potentially be reduced to ∼1.5 s or less.
The actual imaging for each FOV was done in real time with the same temporal resolution as a conventional two-photon microscope. In the turbid layer-conjugated configuration, the laser beam did not cover every pixel of the MEMS mirror. Therefore, we only measured the pixels that were illuminated by the laser beam during the wavefront measurement. For pixels outside the laser illumination, we kept their phase value at 0. To find out the actual pixels that contributed to the wavefront measurement, we checked the amplitude of the Fourier-transformed signal to locate the pixels that have a decent signal level above a certain threshold (for example, a few times of the noise level). For a scanning range of 20 µm, the beam translation was ∼three pixels on the MEMS. The outer pixels during scanning simply acted as a flat mirror with a zero phase delay.
MEMS Position Calibration.
The MEMS needs to be translated along the optical axis without changing the entire optical path length or direction. To achieve this goal without losing laser power, the MEMS, two polarizing beam splitters, and a quarter wave plate were placed on a translational stage, as shown in Fig. 2. The final polarizing beam splitter can be replaced by a simple mirror. In our setup we had an additional optical path that could be used to bypass the MEMS and pass the laser beam through the final polarizing beam splitter to use the system as a conventional two-photon microscope. We aligned the optical path carefully, which allowed the MEMS to be translated along the optical axis without affecting the beam direction and path length. The conjugate plane positions for the MEMS were calibrated by using a fluorescent target. After finding the plane of focus, we translated the fluorescent target in the axial direction toward the objective using a motorized sample stage. We then formed an image of the fluorescence target through the objective and tube lens pair onto a camera (wide-field imaging). We translated the MEMS until the individual MEMS pixels were also clearly resolved (i.e., MEMS and the fluorescence targets were imaged to the same plane). We only need to perform the calibration once. With this information, we could adaptively conjugate the MEMS mirror to different depths in the sample to achieve optimal imaging FOV. Using this configuration, we imaged the dendrite and microglia with the MEMS conjugated to 150 and 180 µm from the image plane, respectively. From the correction patterns in Figs. 4C and 5D, we can also notice the difference in the conjugation plane position because the laser beam size on the MEMS increases as the conjugate plane is moved away from the focus.
Image Processing.
For all of the images, we determined the background level by taking the average intensity of an empty area on the image. We subtracted the same background from the images obtained with system correction and full wavefront correction. We corrected for animal motion-induced image shifts with the StackReg (41) plugin of ImageJ (National Institutes of Health); 140-fs pulses centered at 935 nm (Chameleon; Coherent) were used with a 20× 1.0 NA water-dipping objective lens (Olympus N20X-PFH), which was underfilled (effective NA, ∼0.6) for the experiments. The spatial resolutions after system correction were measured to be 0.69 and 4.3 µm for the transverse and axial directions, respectively. The measured point spread function (PSF) was used to deconvolve the images through 10 iterations of the Lucy–Richardson algorithm using the DeconvolutionLab (42) plugin of ImageJ. Movie S1 was rendered using the Voltex function of Amira (FEI Visualization Sciences Group).
Animal Preparation.
CX3CR1-GFP and Thy1-YFP strain mice were used for the microglia and dendrite imaging, respectively. The mice were anesthetized using ∼1.5–2% (vol/vol) isoflurane inhalation and placed on a soft heating plate. The skull was exposed by making an incision on the scalp, and a head bar was mounted on the skull using dental cement before the imaging sessions. All animal-related procedures were approved by the institutional animal care and use committee of the Howard Hughes Medical Institute, Janelia Research Campus.
Supplementary Material
Acknowledgments
We thank Dr. Lingjie Kong for help and suggestions. This work was supported by the Howard Hughes Medical Institute.
Footnotes
The authors declare no conflict of interest.
This article is a PNAS Direct Submission. Z.K. is a guest editor invited by the Editorial Board.
This article contains supporting information online at www.pnas.org/lookup/suppl/doi:10.1073/pnas.1505939112/-/DCSupplemental.
References
- 1.Helmchen F, Denk W. Deep tissue two-photon microscopy. Nat Methods. 2005;2(12):932–940. doi: 10.1038/nmeth818. [DOI] [PubMed] [Google Scholar]
- 2.Gustafsson MG. Super-resolution light microscopy goes live. Nat Methods. 2008;5(5):385–387. doi: 10.1038/nmeth0508-385. [DOI] [PubMed] [Google Scholar]
- 3.Horton NG, et al. In vivo three-photon microscopy of subcortical structures within an intact mouse brain. Nat Photonics. 2013;7(3):205–209. doi: 10.1038/nphoton.2012.336. [DOI] [PMC free article] [PubMed] [Google Scholar]
- 4.Hong G, et al. Through-skull fluorescence imaging of the brain in a new near-infrared window. Nat Photonics. 2014;8(9):723–730. doi: 10.1038/nphoton.2014.166. [DOI] [PMC free article] [PubMed] [Google Scholar]
- 5.Booth MJ. Adaptive optics in microscopy. Philos Trans A Math Phys Eng Sci. 2007;365(1861):2829–2843. doi: 10.1098/rsta.2007.0013. [DOI] [PubMed] [Google Scholar]
- 6.Girkin JM, Poland S, Wright AJ. Adaptive optics for deeper imaging of biological samples. Curr Opin Biotechnol. 2009;20(1):106–110. doi: 10.1016/j.copbio.2009.02.009. [DOI] [PubMed] [Google Scholar]
- 7.Débarre D, et al. Image-based adaptive optics for two-photon microscopy. Opt Lett. 2009;34(16):2495–2497. doi: 10.1364/ol.34.002495. [DOI] [PMC free article] [PubMed] [Google Scholar]
- 8.Booth MJ, Neil MA, Juskaitis R, Wilson T. Adaptive aberration correction in a confocal microscope. Proc Natl Acad Sci USA. 2002;99(9):5788–5792. doi: 10.1073/pnas.082544799. [DOI] [PMC free article] [PubMed] [Google Scholar]
- 9.Kam Z, Hanser B, Gustafsson MGL, Agard DA, Sedat JW. Computational adaptive optics for live three-dimensional biological imaging. Proc Natl Acad Sci USA. 2001;98(7):3790–3795. doi: 10.1073/pnas.071275698. [DOI] [PMC free article] [PubMed] [Google Scholar]
- 10.Kner P. Phase diversity for three-dimensional imaging. J Opt Soc Am A Opt Image Sci Vis. 2013;30(10):1980–1987. doi: 10.1364/JOSAA.30.001980. [DOI] [PubMed] [Google Scholar]
- 11.Tao X, Dean Z, Chien C, Azucena O, Bodington D, Kubby J. Shack-Hartmann wavefront sensing using interferometric focusing of light onto guide-stars. Opt Express. 2013;21(25):31282–31292. doi: 10.1364/OE.21.031282. [DOI] [PubMed] [Google Scholar]
- 12.Leray A, Mertz J. Rejection of two-photon fluorescence background in thick tissue by differential aberration imaging. Opt Express. 2006;14(22):10565–10573. doi: 10.1364/oe.14.010565. [DOI] [PubMed] [Google Scholar]
- 13.Psaltis D, Papadopoulos IN. Imaging: The fog clears. Nature. 2012;491(7423):197–198. doi: 10.1038/491197a. [DOI] [PubMed] [Google Scholar]
- 14.Tang J, Germain RN, Cui M. Superpenetration optical microscopy by iterative multiphoton adaptive compensation technique. Proc Natl Acad Sci USA. 2012;109(22):8434–8439. doi: 10.1073/pnas.1119590109. [DOI] [PMC free article] [PubMed] [Google Scholar]
- 15.Kong L, Cui M. In vivo fluorescence microscopy via iterative multi-photon adaptive compensation technique. Opt Express. 2014;22(20):23786–23794. doi: 10.1364/OE.22.023786. [DOI] [PubMed] [Google Scholar]
- 16.Kong L, Cui M. In vivo neuroimaging through the highly scattering tissue via iterative multi-photon adaptive compensation technique. Opt Express. 2015;23(5):6145–6150. doi: 10.1364/OE.23.006145. [DOI] [PubMed] [Google Scholar]
- 17.Vellekoop IM, Mosk AP. Focusing coherent light through opaque strongly scattering media. Opt Lett. 2007;32(16):2309–2311. doi: 10.1364/ol.32.002309. [DOI] [PubMed] [Google Scholar]
- 18.Mosk AP, Lagendijk A, Lerosey G, Fink M. Controlling waves in space and time for imaging and focusing in complex media. Nat Photonics. 2012;6(5):283–292. [Google Scholar]
- 19.Choi Y, et al. Overcoming the diffraction limit using multiple light scattering in a highly disordered medium. Phys Rev Lett. 2011;107(2):023902. doi: 10.1103/PhysRevLett.107.023902. [DOI] [PMC free article] [PubMed] [Google Scholar]
- 20.Park J, Park C, Yu H, Park J, Han S. Subwavelength light focusing using random nanoparticles. Nat Photonics. 2013;7(6):454–458. [Google Scholar]
- 21.Paudel HP, Stockbridge C, Mertz J, Bifano T. Focusing polychromatic light through strongly scattering media. Opt Express. 2013;21(14):17299–17308. doi: 10.1364/OE.21.017299. [DOI] [PubMed] [Google Scholar]
- 22.Park J, Park C, Yu H, Cho Y, Park Y. Dynamic active wave plate using random nanoparticles. Opt Express. 2012;20(15):17010–17016. [Google Scholar]
- 23.Xu X, Liu H, Wang LV. Time-reversed ultrasonically encoded optical focusing into scattering media. Nat Photonics. 2011;5(3):154–157. doi: 10.1038/nphoton.2010.306. [DOI] [PMC free article] [PubMed] [Google Scholar]
- 24.Si K, Fiolka R, Cui M. Breaking the spatial resolution barrier via iterative sound-light interaction in deep tissue microscopy. Sci Rep. 2012;2:748. doi: 10.1038/srep00748. [DOI] [PMC free article] [PubMed] [Google Scholar]
- 25.Si K, Fiolka R, Cui M. Fluorescence imaging beyond the ballistic regime by ultrasound pulse guided digital phase conjugation. Nat Photonics. 2012;6(10):657–661. doi: 10.1038/nphoton.2012.205. [DOI] [PMC free article] [PubMed] [Google Scholar]
- 26.Wang YM, Judkewitz B, Dimarzio CA, Yang C. Deep-tissue focal fluorescence imaging with digitally time-reversed ultrasound-encoded light. Nat Commun. 2012;3:928. doi: 10.1038/ncomms1925. [DOI] [PMC free article] [PubMed] [Google Scholar]
- 27.Conkey DB, Caravaca-Aguirre AM, Piestun R. High-speed scattering medium characterization with application to focusing light through turbid media. Opt Express. 2012;20(2):1733–1740. doi: 10.1364/OE.20.001733. [DOI] [PubMed] [Google Scholar]
- 28.Katz O, Small E, Silberberg Y. Looking around corners and through thin turbid layers in real time with scattered incoherent light. Nat Photonics. 2012;6(8):549–553. [Google Scholar]
- 29.Bertolotti J, et al. Non-invasive imaging through opaque scattering layers. Nature. 2012;491(7423):232–234. doi: 10.1038/nature11578. [DOI] [PubMed] [Google Scholar]
- 30.Katz O, Heidmann P, Fink M, Gigan S. Non-invasive single-shot imaging through scattering layers and around corners via speckle correlations. Nat Photonics. 2014;8(10):784–790. [Google Scholar]
- 31.Chen T-W, et al. Ultrasensitive fluorescent proteins for imaging neuronal activity. Nature. 2013;499(7458):295–300. doi: 10.1038/nature12354. [DOI] [PMC free article] [PubMed] [Google Scholar]
- 32.Hardy J. Adaptive Optics for Astronomical Telescopes. Oxford Univ Press; New York: 1998. [Google Scholar]
- 33.Kam Z, Kner P, Agard D, Sedat JW. Modelling the application of adaptive optics to wide-field microscope live imaging. J Microsc. 2007;226(Pt 1):33–42. doi: 10.1111/j.1365-2818.2007.01751.x. [DOI] [PubMed] [Google Scholar]
- 34.Simmonds RD, Booth MJ. Modelling of multi-conjugate adaptive optics for spatially variant aberrations in microscopy. J Opt. 2013;15(9):094010. [Google Scholar]
- 35.Mertz J, Paudel H, Bifano TG. Field of view advantage of conjugate adaptive optics in microscopy applications. Appl Opt. 2015;54(11):3498–3506. doi: 10.1364/AO.54.003498. [DOI] [PMC free article] [PubMed] [Google Scholar]
- 36.Wu TW, Cui M. Numerical study of multi-conjugate large area wavefront correction for deep tissue microscopy. Opt Express. 2015;23(6):7463–7470. doi: 10.1364/OE.23.007463. [DOI] [PubMed] [Google Scholar]
- 37.Roth TL, et al. Transcranial amelioration of inflammation and cell death after brain injury. Nature. 2014;505(7482):223–228. doi: 10.1038/nature12808. [DOI] [PMC free article] [PubMed] [Google Scholar]
- 38.Saijo K, Glass CK. Microglial cell origin and phenotypes in health and disease. Nat Rev Immunol. 2011;11(11):775–787. doi: 10.1038/nri3086. [DOI] [PubMed] [Google Scholar]
- 39.Marchetti E. MAD the ESO multi-conjugate adaptive optics demonstrator. Proc SPIE. 2002;4839(38):317–328. [Google Scholar]
- 40.Zeng J, Mahou P, Schanne-Klein M-C, Beaurepaire E, Débarre D. 3D resolved mapping of optical aberrations in thick tissues. Biomed Opt Express. 2012;3(8):1898–1913. doi: 10.1364/BOE.3.001898. [DOI] [PMC free article] [PubMed] [Google Scholar]
- 41.Thevenaz P, Ruttimann UE, Unser M. A pyramid approach to subpixel registration based on intensity. Image Processing. IEEE Transactions on. 1998;7(1):27–41. doi: 10.1109/83.650848. [DOI] [PubMed] [Google Scholar]
- 42.Vonesch C, Unser M. A fast thresholded Landweber algorithm for wavelet-regularized multidimensional deconvolution. Image Processing. IEEE Transactions on. 2008;17(4):539–549. doi: 10.1109/TIP.2008.917103. [DOI] [PubMed] [Google Scholar]
- 43.Firbank M, Hiraoka M, Essenpreis M, Delpy DT. Measurement of the optical properties of the skull in the wavelength range 650-950 nm. Phys Med Biol. 1993;38(4):503–510. doi: 10.1088/0031-9155/38/4/002. [DOI] [PubMed] [Google Scholar]
- 44.Feng S, Kane C, Lee PA, Stone AD. Correlations and fluctuations of coherent wave transmission through disordered media. Phys Rev Lett. 1988;61(7):834–837. doi: 10.1103/PhysRevLett.61.834. [DOI] [PubMed] [Google Scholar]
- 45.Schott S, Bertolotti J, Léger JF, Bourdieu L, Gigan S. 2015. Characterization of the angular memory effect of scattered light in biological tissues. arXiv:1502.00270. [DOI] [PubMed]
Associated Data
This section collects any data citations, data availability statements, or supplementary materials included in this article.


