

Significance
IL-21 is a type I cytokine important for immune cell differentiation and function. We found that transcription factors STAT1 and STAT3 play partially opposing roles in IL-21 function in CD4+ T cells. Both STAT1 and STAT3 control IL-21–mediated gene regulation, with some genes, including Ifng, Tbx21, and Il21 reciprocally regulated by these STATs. IFN-γ production was also differentially regulated by these STATs in vitro during CD4+ T-cell differentiation and in vivo during chronic lymphocytic choriomeningitis infection. Importantly, IL-21–induced IFNG and TBX21 expression was higher in CD4+ T cells from patients with autosomal dominant hyper-IgE syndrome or with STAT1 gain-of-function mutations, suggesting that dys-regulated IL-21–STAT signaling partially explains the clinical manifestations of these patients.
Keywords: IL-21, T cells, STATs, IFN-γ, AD-HIES
Abstract
IL-21 is a type I cytokine essential for immune cell differentiation and function. Although IL-21 can activate several STAT family transcription factors, previous studies focused mainly on the role of STAT3 in IL-21 signaling. Here, we investigated the role of STAT1 and show that STAT1 and STAT3 have at least partially opposing roles in IL-21 signaling in CD4+ T cells. IL-21 induced STAT1 phosphorylation, and this was augmented in Stat3-deficient CD4+ T cells. RNA-Seq analysis of CD4+ T cells from Stat1- and Stat3-deficient mice revealed that both STAT1 and STAT3 are critical for IL-21–mediated gene regulation. Expression of some genes, including Tbx21 and Ifng, was differentially regulated by STAT1 and STAT3. Moreover, opposing actions of STAT1 and STAT3 on IFN-γ expression in CD4+ T cells were demonstrated in vivo during chronic lymphocytic choriomeningitis infection. Finally, IL-21–mediated induction of STAT1 phosphorylation, as well as IFNG and TBX21 expression, were higher in CD4+ T cells from patients with autosomal dominant hyper-IgE syndrome, which is caused by STAT3 deficiency, as well as in cells from STAT1 gain-of-function patients. These data indicate an interplay between STAT1 and STAT3 in fine-tuning IL-21 actions.
Interleukin-21 (IL-21) is a type I cytokine that signals via a receptor composed of IL-21R and the common cytokine receptor γ-chain, γc (1). γc is also shared by the receptors for IL-2, IL-4, IL-7, IL-9, and IL-15 and is mutated in humans with X-linked severe combined immunodeficiency (XSCID), a disease characterized by the absence of T and natural killer (NK) cells and the presence of nonfunctional B cells (2). IL-21 is primarily produced by CD4+ T cells and natural killer T (NKT) cells, but it has pleiotropic actions on both adaptive and innate immune cells, including T, B, NK, NKT, and dendritic cells (1). In T cells, IL-21 can act as a comitogen and cooperates with IL-7 and IL-15 to expand CD8+ T cells (3), promotes Th17 differentiation (4–6), and induces BCL6 expression (7) to promote T follicular helper cell development (8, 9). In B cells, IL-21 promotes plasma cell differentiation (10, 11), and in combination with IL-4, drives IgG1 and IgG3 class switch (11, 12). Defective signaling by IL-21 appears to substantially explain the B-cell defect observed in patients with XSCID (11, 13). Furthermore, IL-21 can enhance the cytotoxic activity of NK and NKT cells (1) and induce the apoptosis of conventional dendritic cells (14).
IL-21 activates multiple signaling pathways, including the JAK-STAT, PI 3-kinase (PI3K), and MAPK pathways (15). Of these, the JAK-STAT pathway has been most extensively studied. IL-21 induces phosphorylation of JAK1 and JAK3, which in turn leads to phosphorylation and nuclear translocation of STAT3, which then binds to IFN-γ–activated sequence (GAS) motifs and modulates expression of IL-21–responsive genes. IL-21 also activates STAT1, but the function of IL-21–activated STAT1 is largely unknown, although IL-21 was suggested to use STAT1 to promote CD8+ T-cell cytotoxicity and apoptosis of mantle cell lymphoma (16, 17). We now have elucidated the roles of STAT1 in IL-21 signaling and identified an interplay between STAT1 and STAT3 in mediating the actions of IL-21 in CD4+ T cells, and have also found increased IL-21–mediated induction of STAT1 phosphorylation in cells from patients with autosomal dominant hyper-IgE syndrome (AD-HIES), and in patients with a STAT1 gain-of-function (GOF) mutation, which correlates with increased IFNG (interferon gamma) and TBX21 (T-box 21) expression after IL-21 stimulation.
Results
IL-21 Induces Sustained STAT1 and STAT3 Activation in CD4+ T Cells.
IL-21 was previously shown to induce strong and sustained STAT3 phosphorylation (pSTAT3) but only weaker and more transient STAT1 phosphorylation (pSTAT1) in total splenocytes, B cells, and CD8+ T cells (18, 19). We first compared IL-21–induced pSTAT1 and pSTAT3 in preactivated CD4+ and CD8+ T cells. IL-21 induced strong pSTAT1 and pSTAT3 at 30 min (Fig. 1 A and B). pSTAT1 as well as pSTAT3 was still detected at 4 and 8 h of stimulation (Fig. 1 A and B), and when we deleted Stat3 by crossing Stat3-floxed mice to CD4-Cre transgenic mice (referred to as Stat3−/− herein), IL-21 induced more pSTAT1 at 4 and 8 h in Stat3−/− CD4+ T cells than in WT cells (Fig. 1 A and C); this increase was minimally observed in CD8+ T cells (Fig. 1 B and C). Interestingly, we observed diminished IL-21–induced expression of Socs3 and Socs1 in Stat3−/− cells (Fig. 1D). Because SOCS3 and SOCS1 can negatively regulate cytokine signaling by blocking STAT protein phosphorylation (20), this might in part explain the increased pSTAT1 in the absence of STAT3. Using ImageStream to image fluorescently labeled pSTAT1 and pSTAT3 within CD4+ T cells, we confirmed that both STAT1 and STAT3 translocated to the nucleus after IL-21 stimulation (Fig. 1E and Fig. S1).
Fig. 1.

IL-21–induced STAT1 phosphorylation is enhanced in the absence of STAT3 in CD4+ T cells. (A and B) CD4+ (A) and CD8+ (B) T cells from Stat3+/+ and Stat3−/− mice were stimulated with 5 μg/mL plate-bound anti-CD3 + 2 μg/mL soluble anti-CD28 for 2 d, rested 1 d, then not stimulated or stimulated with IL-21 for 30 min, 4 h, and 8 h. Levels of pSTAT3, STAT3, pSTAT1, and STAT1 were assessed by Western blotting. Data are representative of three to five experiments. (C) Quantification of Western blotting images by ImageJ. (D) IL-21–mediated Socs3 and Socs1 mRNA expression in CD4+ T cells is STAT3-dependent. CD4+ T cells from Stat3+/+ and Stat3−/− mice were stimulated with IL-21 as in A for 4 h, mRNA expression of Socs3 (Left) and Socs1 (Right) was analyzed by RT-PCR. Shown is expression relative to Rpl7; data are representative of three experiments. (E) IL-21–activated STAT1 and STAT3 translocate to the nucleus. CD4+ T cells were stimulated with IL-21 as in A for 30 min. Samples were fixed and stained with DAPI (nuclear stain, purple), and with antibodies to pSTAT1 (green) or pSTAT3 (yellow), and analyzed by ImageStream. Overlapped DAPI and pSTAT1 or pSTAT3 staining (Merge) indicates nuclear translocation. Data are representative of three independent experiments.
Fig. S1.

IL-21-activated STAT1 and STAT3 translocate to the nucleus. CD4+ T cells were stimulated with IL-21 as in Fig. 1A for 30 min. Samples were then fixed and stained with DAPI, and with antibodies to pSTAT1 or pSTAT3, and analyzed by ImageStream. Data shown are numbers of cells with overlapping DAPI and pSTAT signals both before and after IL-21 stimulation. Representative data are shown in Fig. 1E.
Both STAT1 and STAT3 Contribute to IL-21–Mediated Gene Regulation in CD4+ T Cells.
We next used RNA-Seq in WT, Stat1−/−, and Stat3−/− CD4+ T cells to elucidate the roles of STAT1 and STAT3 in IL-21–mediated gene regulation (Fig. 2A). Consistent with its activation by IL-21 (Fig. 1), STAT1 was responsible for the regulation of ∼10% (173 of 1,648) of the genes (fold-change > 1.5) after IL-21 stimulation (Fig. 2B and Dataset S1). Although STAT3 is considered to be the major transcription factor responsible for IL-21’s effect, it only affected ∼40% (834 of 2,101) of the genes regulated by IL-21 (Fig. 2B and Dataset S2), suggesting contributions of STAT-independent (e.g., MAPK and PI3K) pathways, which are also involved in IL-21–mediated signaling (19). Moreover, we observed augmented IL-21–induced expression of a number of genes in the absence of STAT1 or STAT3, suggesting that these STAT proteins also directly or indirectly inhibit expression. Notably, nearly ∼50% (84 of 173) of IL-21–regulated, STAT1-dependent genes were also STAT3-dependent (Fig. 2C and Dataset S3). Some genes were differentially regulated by STAT1 and STAT3. For example, the Th1 cell signature genes Tbx21 (Fig. 2D) and Ifng (Fig. 2E) were not induced by IL-21 in the absence of STAT1, but their expression was elevated in the absence of STAT3, consistent with an inducing role for STAT1 and repressive role for STAT3. This finding is also consistent with a report showing that IL-21 induces Tbet expression in CD8+ T cells via STAT1 (16). We hypothesized that IL-21–activated STAT1 and STAT3 directly regulated the expression these genes and therefore used ChIP-Seq to determine STAT1 and STAT3 binding in CD4+ T cells after IL-21 stimulation. IL-21–induced STAT3 bound at sites 5′ of the Tbx21 and Ifng loci (Fig. 2 F and G) containing GAS motifs (Table S1), and the level of STAT3 binding was lower in Stat1-deficient cells (Fig. 2 F and G). STAT1 binding was detected at the same sites and additionally at multiple sites where STAT3 binding was minimal (Fig. 2 F and G). In contrast to Tbx21 and Ifng, IL-21–induced expression of the Il21 gene was elevated in the absence of STAT1 but decreased in the absence of STAT3 (Fig. 2H), and correspondingly, IL-21–mediated STAT3 binding was enhanced in Stat1-deficient cells (Fig. 2I), and STAT1 and STAT3 bound at distinct sites for regulating Il21 expression (Fig. 2I). These data collectively indicate key roles for STAT1 for IL-21–induced gene expression in CD4+ T cells and suggest that STAT1 and STAT3 can regulate gene expression through binding at the same or different sites at the Tbx21, Ifng, and Il21 loci.
Fig. 2.
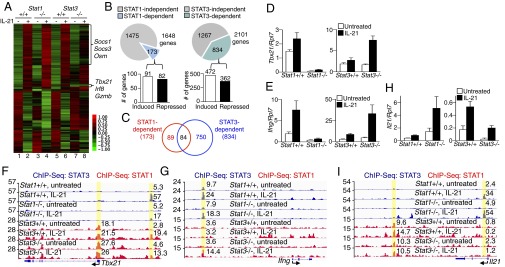
IL-21–mediated gene regulation in CD4+ T cells requires both STAT1 and STAT3. (A–C) CD4+ T cells from Stat1+/+, Stat1−/−, Stat3+/+, and Stat3−/− mice were preactivated with plate-bound anti-CD3 + anti-CD28 for 3 d, rested overnight, and not stimulated or stimulated with IL-21 for 4 h. Gene expression was determined by RNA-Seq. For each sample, RNA was prepared from combined cells from three mice. (A) Heat map comparing the IL-21–mediated gene expression in CD4+ T cells with the indicated genotypes. (B) Number of IL-21 regulated genes that are STAT1- or STAT3-dependent (pie charts, Upper) and the number of these genes that are induced or repressed (bar graphs). (C) Venn diagram showing numbers of genes that are independently or coregulated by STAT1 and STAT3. (D and E) IL-21–mediated mRNA expression of Tbx21 (D) and Ifng (E) in Stat1+/+, Stat1−/−, Stat3+/+, and Stat3−/− CD4+ T cells was determined by RT-PCR. Shown are combined results from three mice with expression relative to Rpl7. (F and G) Preactivated CD4+ T cells from Stat1+/+, Stat1−/−, Stat3+/+, and Stat3−/− mice were stimulated with IL-21 for 1 h, and STAT1 and STAT3 binding at Tbx21 (F) and Ifng (G) loci was determined by ChIP-Seq analysis. Tag numbers for peaks are indicated. (H) As in D and E, IL-21–mediated mRNA expression of the Il21 gene was determined by RT-PCR. Shown are combined results of three mice and expression relative to Rpl7. (I) As in F and G, STAT1 and STAT3 binding at the Il21 locus was determined by ChIP-Seq analysis.
Table S1.
STAT3-bound GAS motifs (bold) at the Tbx21, Ifng, and Il21 loci
| Loci | Sequence and motif |
| Tbx21 (upstream) | chr11:96987806–96988206 |
| 1–50 | CTGGAACTTAAGAACTATTGTTAGGGGGCTAGAGAGATGGCTCGGTGGTT |
| 51–100 | AAGAGCGTTGGTTGGTCTTCCAGAGTTCCTGTGTTCAAATCCCAGCAACC |
| 101–150 | ACATGGTGGCTCACAATGATCTCATGGGATCTATGCCCTCCTCTGCATGC |
| 151–200 | AGATAAACAGGAAGACAGAGCACTCATATACATACATAAATAAATTTTTA |
| 201–250 | AAAGAGAGAACTGTTGTTTGGGGGATTGACAACATATGGGGAGGTCAAGG |
| 251–300 | GTCACCACCCTTTGGCTCCAGATAGCCTTAACATGCCGTTTTCCTTTAAT |
| 301–350 | ACACAAGACTTCGAGCAAGATCCTGAGACAGAGTCTTTTTCTTGCCCACG |
| 351–400 | GACTACAGGTTCTTCCTCGAGTCTAGCTTTAATTCATTACTTAGAGAGGG |
| Ifng (upstream) | chr10:117855863–117856263 |
| 1–50 | CTAAAGCCCCAAGAATGTCCTCAGGTTCAGAGGGTTCAAACACTGGTATA |
| 51–100 | ACTTGGAGGCAGGATTCAAACACAATCCAGTTCCCACATTGGCACCTCTT |
| 101–150 | ACCACCATACTACAGTGAAAAAATGTTTTAGAAGTATGACAGCAATGATG |
| 151–200 | CCATATAATCATGCAAGTATTAACATGCAATTGTCTACACACACACACAC |
| 201–250 | ACACGTGAAATTTGATGTTTGCTATAACCTCAAAGGTAAGGAAGCCAAAG |
| 251–300 | AGAGTATCTTATCTTTAAACAACTCTACTTCCTGCTCAGACCTGCACTTC |
| 301–350 | TGTGAGCACATGGGCACGCATCGCCCCGCCCTATGGAGCGGAAGCATGAT |
| 351–400 | GTCAGCGCCTGGGGTGGGGGTGGGGTGGGGAAAGGCAACTTCTTTCTTCT |
| Il21 (intron) | chr3:37130101–37130501 |
| 1–50 | ACACACTGAGAAATGTTCTCACTTATTGGAAATGTCCTTTCAATAAGTTT |
| 51–100 | GAATGAGCTACTTTCAGTTTAGAGGCCACTCATTTGAAAGGACCTAGTAA |
| 101–150 | ACACAAGAATGATCATGTGCAGAGCTGGAGAGTGAACTGTGGAGCAGAGG |
| 151–200 | GGCGGCGTGACTCACTCACTTTCTAAACTCTTACGCTGTCATTTACCATA |
| 201–250 | ATTCTCTTCTTTGAGTGTCTCTGTGTGGTGCCCTCATTACTGGCAATACT |
| 251–300 | CTCCTTGTTTTCCCGATTTATGCAATTAAAGGCCTAGCTGTGCGAGCATT |
| 301–350 | TCCCCAGTTTCATTTACATTGGTACCAAGCTGAAGACCAGAATAAAGATG |
| 351–400 | TTCTCAGGGCAGAGACAGCAGAAGCCCCTCCACACTGAATGCCAAGCCAC |
Opposing Effects of STAT1 and STAT3 on IL-21–Mediated IFN-γ Expression.
By ChIP-Seq, we observed STAT1 binding in preactivated CD4+ T cells even without IL-21 stimulation (Fig. 2 F, G, and I), and indeed, the basal level of phosphorylated STAT1 was also higher in preactivated Stat3-deficient CD4+ T cells (Fig. 1A). We thus investigated if T-cell receptor (TCR) signaling in naïve CD4+ T cells augmented STAT1 phosphorylation in these cells, and found that TCR signaling strongly induced STAT1 phosphorylation at 24 and 48 h after stimulation and persisted for at least 72 h (Fig. 3A, lanes 3–8 vs. 1 and 2), but augmented STAT1 phosphorylation in Stat3-deficient CD4+ T cells was only detected at 48 and 72 h (Fig. 3 A and B, lanes 6 and 8 vs. 5 and 7). Addition of an IFN-γ blocking antibody diminished STAT1 phosphorylation induced by TCR signaling (Fig. 3A, lanes 9–14), suggesting that TCR-mediated IFN-γ expression induced STAT1 activation. Importantly, however, STAT1 phosphorylation was still higher in Stat3-deficient CD4+ T cells even in the presence of anti–IFN-γ (Fig. 3A, lanes 12 vs. 11 and 14 vs. 13, and Fig. 3B), indicating that IFN-γ was not responsible for this difference and suggesting that other cytokines might contribute to the augmented STAT1 phosphorylation. Because IL-21–induced Ifng mRNA expression was enhanced in Stat3-deficient CD4+ T cells (Fig. 2E), it was possible that IFN-γ signaling contributed to the IL-21–induced augmented STAT1 phosphorylation in these cells; however, an IFN-γ blocking antibody did not significantly affect STAT1 phosphorylation induced by IL-21 (Fig. 3 C and D), indicating that IL-21 worked independently from IFN-γ signaling for inducing higher STAT1 activation in Stat3-deficient CD4+ T cells.
Fig. 3.

STAT3 suppresses IL-21–mediated Tbet and IFN-γ expression in CD4+ T cells. (A) Naïve CD4+ T cells from Stat3+/+ and Stat3−/− mice were stimulated with 5 μg/mL plate-bound anti-CD3 + 2 μg/mL soluble anti-CD28 without or with 10 μg/mL anti-IFN-γ for 24–72 h. Levels of pSTAT1 and STAT1 were determined by Western blotting. Data are representative of three experiments. (B) Quantification of Western blotting images by ImageJ. Numbers indicate the ratios of pSTAT1 levels in Stat3−/− cells vs. Stat3+/+ cells and dividing this value by total STAT1 levels in Stat3−/− cells relative to Stat3+/+ cells. (C) CD4+ T cells from Stat3+/+ and Stat3−/− mice were stimulated with 5 μg/mL plate-bound anti-CD3 + 2 μg/mL soluble anti-CD28 for 3 d, rested 1 d, and then not stimulated or stimulated with IL-21 for 4 h, and 8 h, without or with the addition of 10 μg/mL anti–IFN-γ. Levels of pSTAT1 and STAT1 were determined by Western blotting. Data are representative of two experiments. (D) Quantification of Western blotting images by ImageJ as in B. (E) Naïve CD4+ T cells from Stat3+/+ and Stat3−/− mice were stimulated with 5 μg/mL plate-bound anti-CD3 + 2 μg/mL soluble anti-CD28 without or with 100 ng/mL IL-21 for 24 h, and Tbet expression was analyzed by flow cytometry. Data are representative of three experiments. (F) Naïve CD4+ T cells from Stat3+/+ and Stat3−/− mice were treated as in E, and Ifng expression was determined at different points relative to Rpl7; data are representative of three experiments. (G and H) Naïve CD4+ T cells from Stat3+/+ and Stat3−/− (G), or Stat1+/+ and Stat1−/− (H), mice were treated as in E for 4 d, without or with the addition of 10 μg/mL anti–IFN-γ. Cells were washed and restimulated with PMA + ionomycin and golgiplug for 4 h, and intracellular IFN-γ and IL-17 were analyzed by flow cytometry. Data are representative of three experiments.
Above, we showed that IL-21 could induce Tbx21 and Ifng expression in preactivated CD4+ T cells after 4 h of stimulation, with an enhanced effect in the absence of STAT3. However, it was previously reported that IL-21 suppresses IFN-γ expression during T-cell differentiation (21). We therefore investigated the effect of IL-21 on IFN-γ expression during CD4+ T-cell differentiation. After 24 h of stimulation, IL-21 induced Tbet expression in CD4+ T cells, and Tbet expression was enhanced when Stat3 was deleted (Fig. 3E). IL-21 diminished Ifng expression in Stat3-sufficent cells during 4 d of differentiation (Fig. 3F), but it increased Ifng expression in Stat3-deficient cells (Fig. 3F). These results are consistent with lower IFN-γ protein production after 4 d of differentiation with IL-21 in WT cells but increased IFN-γ expression in similarly treated Stat3-deficient cells (Fig. 3G). Consistent with the fact that IL-21 acted independently of IFN-γ signaling, addition of anti–IFN-γ suppressed intracellular IFN-γ expression in WT CD4+ T cells, but it did not affect the increased IFN-γ expression in Stat3-deficient cells (Fig. 3G). STAT1 is absolutely required for IFN-γ expression, as the basal expression of intracellular IFN-γ was abolished in Stat1-deficient CD4+ T cells (Fig. 3H). As a result, the IL-21–mediated IFN-γ expression that we observed in Stat3-deficient cells could not be detected in Stat1-deficient cells.
Although the IL-21–induced augmented STAT1 phosphorylation was independent of IFN-γ signaling, expression of IFN-γ mRNA (Figs. 2E and 3F) and protein (Fig. 3G) was increased in these cells. Therefore, we asked if the increased IFN-γ expression affected IL-21–mediated gene expression, particularly for Th1 signature genes (e.g., Ifng and Tbx21) whose induction by IL-21 was enhanced in Stat3-deficient cells. We performed a kinetic analysis by stimulating WT and Stat3-deficient CD4+ T cells with IL-21, without or with anti–IFN-γ, and determined gene expression by RNA-Seq after 24 and 72 h of stimulation. By Ingenuity Upstream Regulator Analysis, we identified 53 STAT1-regulated genes whose expression was induced by IL-21, with higher induction in Stat3-deficient cells at the 24 and 72 h time points (Fig. 4A and Dataset S4), including Ifng, Tbx21, Ifit1, and Ifit2 (Fig. 4 B–E). The addition of anti–IFN-γ reduced IL-21–induced expression of these Th1 signature genes in both WT and Stat3-deficient cells (Fig. 4 and Dataset S4), suggesting that even though IFN-γ signaling did not affect the augmented STAT1 phosphorylation induced by IL-21, it was partly responsible for IL-21–mediated gene expression in Stat3-deficient cells.
Fig. 4.

IFN-γ signaling partially controls IL-21–mediated gene expression. (A) CD4+ T cells from Stat3+/+ and Stat3−/− mice were stimulated with 5 μg/mL plate-bound anti-CD3 + 2 μg/mL soluble anti-CD28 for 3 d, rested 1 d, then not stimulated or stimulated with IL-21 for 24 h or 72 h, without or with 10 μg/mL anti–IFN-γ. Gene expression was determined by RNA-Seq. Heat map showing a list of STAT1-regulated genes (identified by Ingenuity Upstream Regulator Analysis) whose expression is induced by IL-21, and the induction was further increased in Stat3-deficient cells. (B–E) Expression of Ifng (B), Tbx21 (C), Ifit1 (D), and Ifit2 (E), which are in the list of genes shown in A, was confirmed by RT-PCR. Shown are representative of two experiments.
Opposing Effects of STAT1 and STAT3 During Lymphocytic Choriomeningitis Infection.
The opposing effects of STAT1 and STAT3 on IFN-γ production in CD4+ T cells were further examined in vivo using lymphocytic choriomeningitis (LCMV) infection. We infected Stat1−/−, Stat3−/−, and control mice with LCMV clone 13 and determined IFN-γ production in antigen-specific CD4+ T cells. Consistent with our in vitro results, the numbers of antigen-specific (Fig. 5A) and IFN-γ–producing (Fig. 5B) CD4+ T cells were decreased in Stat1−/− mice infected with LCMV compared with WT littermates, but increased in Stat3−/− mice (Fig. 5 C and D). Interestingly, however, the numbers of antigen-specific (Fig. 5E) and IFN-γ–producing (Fig. 5F) CD8+ T cells were not significantly altered in Stat3−/− mice. These data suggest that STAT1 and STAT3 play opposing roles in regulating IFN-γ production in CD4+ cells. IL-21 signaling is likely involved, as previous reports showed that IL-21 is induced and plays a protective role in LCMV infection (22–24), although other STAT1- or STAT3-activating cytokines—including perhaps IL-6, IL-10, or type I IFN, which are involved in LCMV responses (25–28)—might also contribute.
Fig. 5.

STAT1 and STAT3 have opposing effects on regulation of IFN-γ expression in CD4+ T cells during LCMV infection. (A and B) Stat1+/+ and Stat1−/− mice were infected with 2 × 10⁵ pfu of LCMV clone 13, and total spleen cells were isolated at day 6 after infection. (A) Percentages (Left) and numbers (Right) of LCMV-specific CD4+ T cells were identified by I-Ab gp66 tetramer staining. (B) Total spleen cells were stimulated with LCMV-specific gp66-77 peptide for 5 h, percentages of CD4+ CD44+ IFN-γ+ cells were determined. (Left) Individual mice; (Right) summary of data from multiple animals. In A and B, data are from two experiments with a total of six to seven mice per group. (C–F) Stat3+/+ and Stat3−/− mice were infected with 2 × 10⁶ pfu of LCMV clone 13 and total spleen cells were isolated at day 9 after infection. (C) Percentages (Left) and numbers (Right) of LCMV-specific CD4+ T cells were identified by I-Ab gp66 tetramer staining. (D) Total spleen cells were stimulated as in B; percentages of CD4+ CD44+ IFN-γ+ cells were determined. (Left) Individual mice; (Right) summary of data from multiple animals. (E) Percentage (Left) and numbers (Right) of LCMV-specific CD8+ T cells were identified by H-2Db gp33 and H-2Db gp276 tetramer staining. (F) Total spleen cells were stimulated with LCMV-specific gp33-41 or gp276-286 peptides for 5 h, and the percentage of CD8+ CD44+ IFN-γ+ cells was determined. (Left) A representative analysis and the right two panels summarize data from multiple animals. In C–F, data are from three experiments with 10–11 mice per group.
Higher IL-21–Induced STAT1 Phosphorylation and IFNG and TBX21 Expression in CD4+ T Cells from Patients with AD-HIES and STAT1 GOF Mutation.
To clarify the roles of STAT1 and STAT3 in the response to IL-21 in humans, we used CD4+ T cells from patients with AD-HIES, a genetic disorder caused by dominant-negative mutations in STAT3. In most cases, mutations occur in the SH2 or DNA binding domains, leading to the partial loss of STAT3 activity (29), and Th17 cell differentiation is typically defective in these patients (30). We stimulated preactivated CD4+ T cells purified from AD-HIES patients (Table S2) with IL-21, and compared pSTAT1 levels and IFNG and TBX21 mRNA expression with those seen with healthy controls. In normal human donors, IL-21 induced pSTAT1 in CD4+ T cells by 30 min and then declined, but was still detected after 4 h (Fig. 6A). In CD4+ T cells from patients with AD-HIES, pSTAT1 was higher than in cells from normal donors, particularly at 4 h after IL-21 treatment (Fig. 6 A and B). Interestingly, CD4+ T cells from some AD-HIES patients also expressed higher levels of total STAT1 (Fig. 6A). Moreover, IL-21 induced IFNG and TBX21 mRNA expression in human CD4+ T cells, and particularly for TBX21 the fold-induction was higher in AD-HIES CD4+ T (Fig. 6 C and D and Fig. S2), consistent with the suppressive effect of STAT3 on the expression of these genes. We also examined the effect of IL-21 on CD4+ T cells from two patients with STAT1 GOF mutation (Table S2). Similar to the effect of IL-21 in CD4+ T cells from patients with AD-HIES, IL-21–induced STAT1 phosphorylation was enhanced in STAT1 GOF CD4+ T cells (Fig. S3 A and B), and the IL-21–induced IFNG and TBX21 expression was also augmented (Fig. S3 C and D). These data indicate that STAT1/STAT3 interplay influences IL-21–mediated gene regulation.
Table S2.
Summary of patients with Stat1 or Stat3 mutation in this study, and clinical score of patients with AD-HIES
| Patient ID | Type of mutation | Age (y) | Sex | DNA change/amino acid change | STAT3 domain | HIES clinical score |
| 1 | STAT3 LOF | 17 | F | 1909 G to A/V637M | SH2 | 56 |
| 2 | STAT3 LOF | 63 | M | 1865 C to T/T622I | SH2 | 92 |
| 3 | STAT3 LOF | 29 | F | 1909 G to A/V637M | SH2 | 81 |
| 4 | STAT3 LOF | 44 | F | 1909 G to A/V637M | SH2 | 93 |
| 5 | STAT3 LOF | 14 | M | 1166 C to T/T389I | DNA | 55 |
| 6 | STAT1 GOF | 61 | F | 704 A to C/E235A | Coiled-coil | N/A |
| 7 | STAT1 GOF | 32 | F | 704 A to C/E235A | Coiled-coil | N/A |
Fig. 6.

IL-21–induced STAT1 phosphorylation is enhanced in CD4+ T cells from patients with AD-HIES. CD4+ T cells from normal donors (ND) and AD-HIES patients (HIES) were stimulated with 2 μg/mL plate-bound anti-CD3 and 1 μg/mL soluble anti-CD28 for 3 d, rested 1 d, then not stimulated or stimulated with IL-21 for 30 min and 4 h. Levels of pSTAT1 and STAT1 were determined by Western blotting; β-actin was used as a loading control. (A) Data are shown for five patients and five normal controls. (B) Quantification of Western blotting images in A by ImageJ. Numbers indicate the ratios comparing pSTAT1 levels in cells from patients relative to cells from normal donors. (C and D) IL-21–induced IFNG and TBX21 mRNA expression is enhanced in CD4+ T cells from patients with AD-HIES. CD4+ T cells from normal donors and AD-HIES patients were activated as described in panel A, then not stimulated or stimulated with IL-21 for 4 h. mRNA expression of IFNG (C) and TBX21 (D) was determined by RT-PCR. Shown is fold-induction by IL-21 relative to ACTB, data from five experiments, with the level for untreated samples set to 1.
Fig. S2.

IL-21-induced IFNG and TBX21 mRNA expression is enhanced in CD4+ T cells from patients with AD-HIES. Shown are individual plots comparing IFNG (A) and TBX21 (B) expression in each sample with or without IL-21 stimulation. Combined results are shown in Fig. 6 C and D.
Fig. S3.

IL-21-induced IFNG and TBX21 mRNA expression is enhanced in CD4+ T cells from patients with STAT1 GOF. CD4+ T cells from normal donors (ND) and STAT1 GOF patients were stimulated with 2 μg/mL plate-bound anti-CD3 and 1 μg/mL soluble anti-CD28 for 3 d, rested 1 d, then not stimulated or stimulated with IL-21 for 30 min and 4 h. (A) Levels of pSTAT1 and STAT1 were determined by Western blotting; β-actin was used as a loading control. (B) Quantification of Western blotting images by ImageJ. Numbers indicate the ratios comparing pSTAT1 level in cells from STAT1 GOF patients relative to cells from normal donors. Expression of IFNG (C) and TBX21 (D) was determined by RT-PCR. IFNG expression in one of seven normal donor sample was unusually high and therefore was considered an outlier and not shown here.
Discussion
The role of STAT3-independent pathways in IL-21 signaling is not well understood. Here, we investigated the possible role of STAT1 in regulating IL-21 function in CD4+ T cells, and we now show that STAT1, as well as STAT3, is a mediator of the actions of IL-21 in these cells. Our RNA-Seq analysis revealed that 10% of the IL-21–regulated genes in CD4+ T cells were STAT1-dependent and that almost half of these genes were coregulated by both IL-21–activated STAT1 and STAT3, suggesting that STAT1 not only exerts its own actions but that it also interplays with STAT3 for fine-tuning IL-21–mediated gene regulation. Conceivably, some of these genes may be regulated by STAT1-STAT3 heterodimers, although it is possible that some require both STAT1 and STAT3 homodimers instead of heterodimers. Previously, it was shown that there is enhanced IFN-γ–mediated STAT3 activation in Stat1-deficient mouse embryonic fibroblasts (31) and enhanced IL-6 mediated STAT1 activation in Stat3-deficient mouse embryonic fibroblasts (32), revealing that cytokines can activate more of one STAT when another is absent. The balance of STAT1 and STAT3 is intriguing given that STAT1 is classically activated by interferons, mediating an antiviral and tumor-suppressor response, whereas STAT3 is an oncogene (33). We now have shown that STAT1 and STAT3 have opposing roles in regulating IFN-γ expression in CD4+ T cells, both in vitro when stimulated with IL-21 and in vivo when the mice were infected with LCMV. Moreover, we found that IL-21–mediated activation of STAT1 suppressed STAT3-dependent Il21 expression, which presumably normally serves to auto-amplify IL-21 signaling. Thus, STAT1 activation may be a mechanism for limiting IL-21–mediated immune responses.
Several possible mechanisms may account for the interplay of STAT1 and STAT3 induced by IL-21. First, we found that IL-21–mediated induction of the Socs1 and Socs3 genes was diminished in the absence of STAT3, suggesting that the prolonged STAT1 activation may be a result of the attenuation of a negative regulatory signal. Second, the absence of either STAT1 or STAT3 would prevent the formation of STAT1/STAT3 heterodimers, presumable favoring formation of STAT3 or STAT1 homodimers, respectively, with potential effects on gene expression. Third, our ChIP-Seq analysis revealed altered STAT3 binding to DNA in the absence of STAT1, a finding that may help to explain altered expression of STAT3-dependent genes in the absence of STAT1. Fourth, the opposing effects of STAT1 and STAT3 may also result from differential effects on other molecules. For example, we found that STAT1 and STAT3 reciprocally regulated expression of both IFN-γ and Tbet (which is a critical mediator of IFN-γ) (34) after stimulation with IL-21 in vitro. Thus, multiple mechanisms might contribute to the opposing effects of STAT1 and STAT3 upon IL-21 stimulation.
Corresponding to our data in the mouse, we also demonstrated increased IL-21–induced STAT1 activation and higher IFNG and TBX21 expression in CD4+ T cells from patients with AD-HIES. AD-HIES patients have recurrent infections, including chronic mucocutaneous candidiasis and impaired Th17 cell differentiation (30). Interestingly, patients with GOF mutation of STAT1 also suffer from chronic mucocutaneous candidiasis as a result of defective Th17 cell differentiation (35), further supporting the idea of opposing effects of STAT1 and STAT3 and that a balance of these STAT proteins is critical for normal host defense.
Materials of Methods
Mice.
All mice were used under animal protocols approved by the National Heart, Lung, and Blood Institute Animal Care and Use Committee. CD4+ T cells lacking STAT3 were described previously (14). Stat1−/− mice were backcrossed to the C57BL/6 background for six generations. See SI Materials and Methods for more information.
Isolation and Activation of T Cells.
Murine total and naïve T cells were isolated from spleen using magnetic beads (Miltenyi Biotec). Human CD4+ T cells from peripheral blood mononuclear cells were isolated using Dynabeads (Invitrogen). Cells were preactivated as reported (14). See SI Materials and Methods for more information.
Flow Cytometry.
Surface and intracellular staining were performed per the standard protocol. For nuclear translocation of pSTAT proteins, cells were stained as described previously (14), and analyzed on an ImageStream system. See SI Materials and Methods for more information
LCMV Clone 13 Infection.
For LCMV clone 13 infection, see SI Materials and Methods.
Immunoblot Analysis.
Immunoblotting were performed per the standard protocol. See SI Materials and Methods for more information.
RNA-Seq and ChIP-Seq.
RNA-Seq and ChIP-Seq were performed as reported (14, 36). See SI Materials and Methods for more information.
Statistical Analysis.
Statistical analysis was performed by Student’s t test. See SI Materials and Methods for more information.
SI Materials and Methods
Mice.
All mice were used under animal protocols approved by the National Heart, Lung, and Blood Institute Animal Care and Use Committee and followed the NIH Guidelines “Using Animals in Intramural Research.” CD4+ and CD8+ T cells lacking STAT3 were generated by crossing Stat3-floxed mice with CD4-Cre mice. Stat1−/− mice on a 129S6 background were from Taconic Farms and were then backcrossed to the C57BL/6 background for six generations.
Isolation and Activation of Mouse Splenic CD4+ and CD8+ T Cells.
Mouse CD4+ and CD8+ T cells were prepared by passing spleens through a cell strainer, and erythrocytes were removed by ACK lysis buffer. Total CD4+ and CD8+ T cells were isolated by negative selection (Miltenyi Biotec), with cell purity of 90–95%. Cells were cultured at 37 °C in RPMI-1640 complete medium [10% (vol/vol) FBS, 10 IU/mL penicillin, 100 μg/mL streptomycin, 200 μM l-glutamine, and 55 μM 2-mercaptoethanol] and preactivated with plate-bound anti-CD3 (5 μg/mL) + soluble anti-CD28 (2 μg/mL) for 2 or 3 d. Cells were washed and rested, and then stimulated with 100 ng/mL IL-21 (R&D Systems) for the indicated time periods.
Nuclear Translocation of pSTAT1 and pSTAT3.
Total CD4+ T cells were preactivated, rested overnight, and not treated or treated with IL-21 for 30 min. Cells were fixed with 2% (vol/vol) paraformaldehyde at 37 °C for 10 min, permeabilized with 90% (vol/vol) ice-cold methanol for 30 min on ice, and washed twice with FACS buffer (PBS and 1% FBS). Cells were stained with pSTAT1 (Y701)-PE, pSTAT3 (Y705)-Alexa Fluor 647 antibodies, and DAPI (4′,6-diamidino-2-phenylindole) for 30 min, and analyzed on an ImageStream imaging flow cytometer (Amnis Corp).
FACS Analysis of IFN-γ Production.
Naïve (CD62L+ CD44− CD25−) mouse CD4+ T cells were isolated (90–95% pure) by negatively selecting total CD4+ cells followed by positively selecting CD62L+ cells (Miltenyi Biotec). Cells were cultured for 4 d in complete medium with plate-bound anti-CD3 and soluble anti-CD28, with or without addition of IL-21. Cells were then washed and restimulated with PMA (50 ng/mL), ionomycin (1 μM), and golgiplug (1:1,000) for 4 h. Cells were fixed and permeabilized, and stained with IL-17A-PE and IFNγ-APC antibodies (BD Biosciences) at 4 °C for 30 min, washed, and resusepended in FACS buffer (PBS with 1% FBS), and analyzed on a FACSCalibur or FACSCanto flow cytometer.
LCMV Infection.
Stat1+/+ and Stat1−/− mice were infected intravenously with 2 × 10⁵ pfu of LCMV clone 13, and total spleen cells were isolated 6 d later. Stat3+/+ and Stat3−/− mice were infected intravenously with 2 × 10⁶ pfu of LCMV clone 13, and total spleen cells were isolated 9 d later.
Isolation and Activation of Human CD4+ T Cells.
Cells from study subjects were obtained under an Institutional Review Board-approved study of the clinical features and genetics of patients with AD-HIES or STAT1 GOF at the Clinical Center at the NIH. Buffy coats from normal donors were used as controls. Peripheral blood mononuclear cells (PBMCs) were isolated by gradient centrifugation using lymphocyte separation medium. CD4+ T cells from PBMCs were isolated using Dynabeads untouched human CD4 T-cell kit (Invitrogen). Purified CD4+ T cells were activated with plate-bound anti-CD3 and soluble anti-CD28 for 3 d. Cells were then washed, rested overnight, and then stimulated with 100 ng/mL IL-21 for indicated time points.
Immunoblot Analysis.
After IL-21 stimulation, mouse or human T cells were lysed in RIPA buffer for 15 min. Whole-cell lysates (5–10 μg per sample) were separated by SDS/PAGE and analyzed by immunoblotting with antibodies to β-actin, STAT1 (Santa Cruz Biotechnology), STAT3, pSTAT1 (Y701), and pSTAT3 (Y705) (BD Transduction Laboratories). pSTAT1 and STAT1 band intensities in mouse experiments were quantified using ImageJ. The activation ratio was calculated by comparing pSTAT1 levels in cells lacking STAT3 relative to WT cells and dividing this value by the total STAT1 levels in cells lacking STAT3 relative to WT cells.
RNA Analysis.
Total RNA was isolated using the RNeasy Plus Mini Kit (Qiagen). First-strand cDNA was synthesized using the Omniscript reverse transcription kit (Qiagen) and oligo(dT) (Invitrogen). Quantitative RT-PCR was performed on a 7900H Sequence Detection System (Applied Biosystems) using real-time primers and TaqMan probes from Applied Biosystems. RNA expression was normalized relative to that of Rpl7 (mouse) or ACTB (human).
RNA-Seq Analysis.
After stimulation of cells under different experimental conditions, total RNA was isolated, and 5 μg per sample were used for mRNA purification using Dynal oligo(dT) beads (Invitrogen). Double-stranded cDNA was synthesized with random hexamer primers, SuperScript II, DNA polymerase I, and T4 DNA polymerase (Invitrogen) and fragmented by Bioraptor. After end repair (Epicentre DNA END-Repair kit) and the addition of an “A” nucleotide to the 3′ ends with Taq DNA polymerase, two mixed Solexa adaptors (Illumina) were ligated to DNA ends using T4 DNA ligase (New England Biolabs). Next, 250- to 450-bp fragments were isolated on 2% (wt/vol) E-Gels (Invitrogen) and amplified for 18 cycles using PE 1.0 and 2.0 primers (Illumina) and Phusion High Fidelity PCR Master Mix (New England Biolabs). PCR products were run on a gel, and 250- to 450-bp fragments were purified. Final PCR products were sequenced on an Illumina HiSEq. 2000 platform. Sequenced reads (50 bp, single end) were mapped to the mouse genome (NCBI37/mm9, July 2007) using Bowtie 0.12.9, and only the reads that mapped onto exons of each RefSeq gene were measured and normalized using reads per kilobase per million mapped reads. Analyses of differential gene expression were performed using R package edgeR.
ChIP-Seq Analysis.
Total CD4+ T cells were preactivated, washed and rested overnight, and then either not stimulated or stimulated with IL-21 for 1 h. Cells were fixed with 1% formaldehyde at 37 °C for 10 min, and chromatin from 2.5 × 10⁷ cells was sonicated for 20 cycles (15-s on/45-s off) to produce 250- to 450-bp fragments. STAT3- or STAT1-linked chromatin was immunoprecipitated using anti-STAT3 (13-7000, Invitrogen) or anti-STAT1 (sc-346, Santa Cruz Biotechnology) antibody bound to Dynabeads. The ends of isolated DNA were repaired using the DNA END-Repair kit (Epicentre Biotechnologies), and a 3′ “A” nucleotide was added with Taq polymerase. Two mixed Solexa adaptors (Illumina) were ligated to DNA ends and primers complementary to these adaptors (PE 1.0 and 2.0, Illumina) were used to amplify the DNA for 18 cycles. DNA fragments of 250–450 bp were purified from 2% (wt/vol) E-gels and used for cluster generation and sequencing. PCR products were barcoded and sequenced on an Illumina HiSEq. 2000 platform. Sequenced reads (50 bp, single end) were obtained with the Illumina CASAVA1.8 pipeline and mapped to the mouse genome (NCBI37/mm9, July 2007) using Bowtie 0.12.9. Only uniquely mapped reads were retained. To eliminate bias caused by PCR amplification, only nonredundant reads were kept for further analysis. The mapped outputs were converted to browser-extensible data files, which were further converted to binary tiled data files using IGVTools 2.3.32 for viewing on the IGV browser (www.broadinstitute.org/igv/home). Tiled data files represent the average alignment or feature density for a specified window size across the genome. We mapped reads into nonoverlapping 200-bp windows, and the reads were shifted 100 bp from their 5′ starts to represent the center of the DNA fragment associated with the read.
Statistical Analysis.
Statistical analysis was performed by Student’s t test. *P < 0.05; **P < 0.01; NS, not statistically different. In RNA-Seq data analysis, negative binomial distribution was performed to evaluate differentially expressed genes using thresholds P < 1e−10.
Supplementary Material
Acknowledgments
We thank Dr. Jian-Xin Lin (National Heart, Lung, and Blood Institute) for critical comments. This work was supported by the Divisions of Intramural Research, National Heart, Lung, and Blood Institute, National Institute of Neurological Disorders and Stroke, and National Institute of Allergy and Infectious Diseases, National Institutes of Health. RNA-Seq and ChIP-Seq were performed in the National Heart, Lung, and Blood Institute DNA Sequencing and Genomics Core.
Footnotes
Conflict of interest statement: W.J.L. and R.S. are inventors on NIH patents related to IL-21.
Data deposition: The data reported in this paper have been deposited in the Gene Expression Omnibus (GEO) database, www.ncbi.nlm.nih.gov/geo (accession no. GSE63204).
This article contains supporting information online at www.pnas.org/lookup/suppl/doi:10.1073/pnas.1511711112/-/DCSupplemental.
References
- 1.Spolski R, Leonard WJ. Interleukin-21: Basic biology and implications for cancer and autoimmunity. Annu Rev Immunol. 2008;26:57–79. doi: 10.1146/annurev.immunol.26.021607.090316. [DOI] [PubMed] [Google Scholar]
- 2.Noguchi M, et al. Interleukin-2 receptor gamma chain mutation results in X-linked severe combined immunodeficiency in humans. Cell. 1993;73(1):147–157. doi: 10.1016/0092-8674(93)90167-o. [DOI] [PubMed] [Google Scholar]
- 3.Zeng R, et al. Synergy of IL-21 and IL-15 in regulating CD8+ T cell expansion and function. J Exp Med. 2005;201(1):139–148. doi: 10.1084/jem.20041057. [DOI] [PMC free article] [PubMed] [Google Scholar]
- 4.Korn T, et al. IL-21 initiates an alternative pathway to induce proinflammatory T(H)17 cells. Nature. 2007;448(7152):484–487. doi: 10.1038/nature05970. [DOI] [PMC free article] [PubMed] [Google Scholar]
- 5.Nurieva R, et al. Essential autocrine regulation by IL-21 in the generation of inflammatory T cells. Nature. 2007;448(7152):480–483. doi: 10.1038/nature05969. [DOI] [PubMed] [Google Scholar]
- 6.Zhou L, et al. IL-6 programs T(H)-17 cell differentiation by promoting sequential engagement of the IL-21 and IL-23 pathways. Nat Immunol. 2007;8(9):967–974. doi: 10.1038/ni1488. [DOI] [PubMed] [Google Scholar]
- 7.Ozaki K, et al. Regulation of B cell differentiation and plasma cell generation by IL-21, a novel inducer of Blimp-1 and Bcl-6. J Immunol. 2004;173(9):5361–5371. doi: 10.4049/jimmunol.173.9.5361. [DOI] [PubMed] [Google Scholar]
- 8.Nurieva RI, et al. Generation of T follicular helper cells is mediated by interleukin-21 but independent of T helper 1, 2, or 17 cell lineages. Immunity. 2008;29(1):138–149. doi: 10.1016/j.immuni.2008.05.009. [DOI] [PMC free article] [PubMed] [Google Scholar]
- 9.Vogelzang A, et al. A fundamental role for interleukin-21 in the generation of T follicular helper cells. Immunity. 2008;29(1):127–137. doi: 10.1016/j.immuni.2008.06.001. [DOI] [PubMed] [Google Scholar]
- 10.Kwon H, et al. Analysis of interleukin-21-induced Prdm1 gene regulation reveals functional cooperation of STAT3 and IRF4 transcription factors. Immunity. 2009;31(6):941–952. doi: 10.1016/j.immuni.2009.10.008. [DOI] [PMC free article] [PubMed] [Google Scholar]
- 11.Ozaki K, et al. A critical role for IL-21 in regulating immunoglobulin production. Science. 2002;298(5598):1630–1634. doi: 10.1126/science.1077002. [DOI] [PubMed] [Google Scholar]
- 12.Pène J, et al. Cutting edge: IL-21 is a switch factor for the production of IgG1 and IgG3 by human B cells. J Immunol. 2004;172(9):5154–5157. doi: 10.4049/jimmunol.172.9.5154. [DOI] [PubMed] [Google Scholar]
- 13.Recher M, et al. IL-21 is the primary common γ chain-binding cytokine required for human B-cell differentiation in vivo. Blood. 2011;118(26):6824–6835. doi: 10.1182/blood-2011-06-362533. [DOI] [PMC free article] [PubMed] [Google Scholar]
- 14.Wan CK, et al. The cytokines IL-21 and GM-CSF have opposing regulatory roles in the apoptosis of conventional dendritic cells. Immunity. 2013;38(3):514–527. doi: 10.1016/j.immuni.2013.02.011. [DOI] [PMC free article] [PubMed] [Google Scholar]
- 15.Leonard WJ, Zeng R, Spolski R. Interleukin 21: A cytokine/cytokine receptor system that has come of age. J Leukoc Biol. 2008;84(2):348–356. doi: 10.1189/jlb.0308149. [DOI] [PMC free article] [PubMed] [Google Scholar]
- 16.Sutherland AP, et al. IL-21 promotes CD8+ CTL activity via the transcription factor T-bet. J Immunol. 2013;190(8):3977–3984. doi: 10.4049/jimmunol.1201730. [DOI] [PubMed] [Google Scholar]
- 17.Gelebart P, et al. Interleukin-21 effectively induces apoptosis in mantle cell lymphoma through a STAT1-dependent mechanism. Leukemia. 2009;23(10):1836–1846. doi: 10.1038/leu.2009.100. [DOI] [PubMed] [Google Scholar]
- 18.Konforte D, Paige CJ. Identification of cellular intermediates and molecular pathways induced by IL-21 in human B cells. J Immunol. 2006;177(12):8381–8392. doi: 10.4049/jimmunol.177.12.8381. [DOI] [PubMed] [Google Scholar]
- 19.Zeng R, et al. The molecular basis of IL-21-mediated proliferation. Blood. 2007;109(10):4135–4142. doi: 10.1182/blood-2006-10-054973. [DOI] [PMC free article] [PubMed] [Google Scholar]
- 20.Krebs DL, Hilton DJ. SOCS proteins: Negative regulators of cytokine signaling. Stem Cells. 2001;19(5):378–387. doi: 10.1634/stemcells.19-5-378. [DOI] [PubMed] [Google Scholar]
- 21.Suto A, Wurster AL, Reiner SL, Grusby MJ. IL-21 inhibits IFN-gamma production in developing Th1 cells through the repression of Eomesodermin expression. J Immunol. 2006;177(6):3721–3727. doi: 10.4049/jimmunol.177.6.3721. [DOI] [PubMed] [Google Scholar]
- 22.Yi JS, Du M, Zajac AJ. A vital role for interleukin-21 in the control of a chronic viral infection. Science. 2009;324(5934):1572–1576. doi: 10.1126/science.1175194. [DOI] [PMC free article] [PubMed] [Google Scholar]
- 23.Elsaesser H, Sauer K, Brooks DG. IL-21 is required to control chronic viral infection. Science. 2009;324(5934):1569–1572. doi: 10.1126/science.1174182. [DOI] [PMC free article] [PubMed] [Google Scholar]
- 24.Fröhlich A, et al. IL-21R on T cells is critical for sustained functionality and control of chronic viral infection. Science. 2009;324(5934):1576–1580. doi: 10.1126/science.1172815. [DOI] [PubMed] [Google Scholar]
- 25.Harker JA, Lewis GM, Mack L, Zuniga EI. Late interleukin-6 escalates T follicular helper cell responses and controls a chronic viral infection. Science. 2011;334(6057):825–829. doi: 10.1126/science.1208421. [DOI] [PMC free article] [PubMed] [Google Scholar]
- 26.Cui W, Liu Y, Weinstein JS, Craft J, Kaech SM. An interleukin-21-interleukin-10-STAT3 pathway is critical for functional maturation of memory CD8+ T cells. Immunity. 2011;35(5):792–805. doi: 10.1016/j.immuni.2011.09.017. [DOI] [PMC free article] [PubMed] [Google Scholar]
- 27.Ray JP, et al. Transcription factor STAT3 and type I interferons are corepressive insulators for differentiation of follicular helper and T helper 1 cells. Immunity. 2014;40(3):367–377. doi: 10.1016/j.immuni.2014.02.005. [DOI] [PMC free article] [PubMed] [Google Scholar]
- 28.Havenar-Daughton C, Kolumam GA, Murali-Krishna K. Cutting edge: The direct action of type I IFN on CD4 T cells is critical for sustaining clonal expansion in response to a viral but not a bacterial infection. J Immunol. 2006;176(6):3315–3319. doi: 10.4049/jimmunol.176.6.3315. [DOI] [PubMed] [Google Scholar]
- 29.Sowerwine KJ, Holland SM, Freeman AF. Hyper-IgE syndrome update. Ann N Y Acad Sci. 2012;1250:25–32. doi: 10.1111/j.1749-6632.2011.06387.x. [DOI] [PMC free article] [PubMed] [Google Scholar]
- 30.Milner JD, et al. Impaired T(H)17 cell differentiation in subjects with autosomal dominant hyper-IgE syndrome. Nature. 2008;452(7188):773–776. doi: 10.1038/nature06764. [DOI] [PMC free article] [PubMed] [Google Scholar]
- 31.Qing Y, Stark GR. Alternative activation of STAT1 and STAT3 in response to interferon-gamma. J Biol Chem. 2004;279(40):41679–41685. doi: 10.1074/jbc.M406413200. [DOI] [PubMed] [Google Scholar]
- 32.Costa-Pereira AP, et al. Mutational switch of an IL-6 response to an interferon-gamma-like response. Proc Natl Acad Sci USA. 2002;99(12):8043–8047. doi: 10.1073/pnas.122236099. [DOI] [PMC free article] [PubMed] [Google Scholar]
- 33.Bromberg J, Darnell JE., Jr The role of STATs in transcriptional control and their impact on cellular function. Oncogene. 2000;19(21):2468–2473. doi: 10.1038/sj.onc.1203476. [DOI] [PubMed] [Google Scholar]
- 34.Szabo SJ, et al. A novel transcription factor, T-bet, directs Th1 lineage commitment. Cell. 2000;100(6):655–669. doi: 10.1016/s0092-8674(00)80702-3. [DOI] [PubMed] [Google Scholar]
- 35.Liu L, et al. Gain-of-function human STAT1 mutations impair IL-17 immunity and underlie chronic mucocutaneous candidiasis. J Exp Med. 2011;208(8):1635–1648. doi: 10.1084/jem.20110958. [DOI] [PMC free article] [PubMed] [Google Scholar]
- 36.Lin JX, et al. Critical role of STAT5 transcription factor tetramerization for cytokine responses and normal immune function. Immunity. 2012;36(4):586–599. doi: 10.1016/j.immuni.2012.02.017. [DOI] [PMC free article] [PubMed] [Google Scholar]
Associated Data
This section collects any data citations, data availability statements, or supplementary materials included in this article.