

Significance
Advancing our understanding of the underlying molecular mechanisms of aging, as well as their contributions to age-associated diseases, will have a profound impact on public health. Studying the replicative aging phenomenon in the budding yeast Saccharomyces cerevisiae has led to significant findings on how aging is regulated by evolutionarily conserved enzymes and molecular pathways. We have developed a microfluidic system that enables the visualization and analysis of the complete replicative lifespan of a single yeast cell. This system overcomes current technical challenges in low-throughput yeast lifespan analysis by providing a fast, high-throughput, and accurate analytical method at the single-cell level. This approach opens a new avenue for aging and longevity research using yeast genetic screens.
Keywords: microfluidics, high-throughput, replicative aging, calorie restriction, Saccharomyces cerevisiae
Abstract
Saccharomyces cerevisiae has been an important model for studying the molecular mechanisms of aging in eukaryotic cells. However, the laborious and low-throughput methods of current yeast replicative lifespan assays limit their usefulness as a broad genetic screening platform for research on aging. We address this limitation by developing an efficient, high-throughput microfluidic single-cell analysis chip in combination with high-resolution time-lapse microscopy. This innovative design enables, to our knowledge for the first time, the determination of the yeast replicative lifespan in a high-throughput manner. Morphological and phenotypical changes during aging can also be monitored automatically with a much higher throughput than previous microfluidic designs. We demonstrate highly efficient trapping and retention of mother cells, determination of the replicative lifespan, and tracking of yeast cells throughout their entire lifespan. Using the high-resolution and large-scale data generated from the high-throughput yeast aging analysis (HYAA) chips, we investigated particular longevity-related changes in cell morphology and characteristics, including critical cell size, terminal morphology, and protein subcellular localization. In addition, because of the significantly improved retention rate of yeast mother cell, the HYAA-Chip was capable of demonstrating replicative lifespan extension by calorie restriction.
Aging and age-associated diseases are becoming the fastest-growing area of epidemiology in most developed countries (1–4). Identification of molecular mechanisms that lead to the development of interventions to delay the onset of age-associated diseases could have tremendous global impacts on public health (5). The budding yeast Saccharomyces cerevisiae was the first eukaryotic genome to be sequenced, and has been instrumental in discovering molecular pathways involved in all aspects of eukaryotic cells (6–9). S. cerevisiae is an important model for discovering evolutionarily conserved enzymes that regulate aging, such as Sir2 and Tor1 (10).
Yeast replicative lifespan (RLS) is determined by manually separating the daughter cells from a mother cell on a Petri dish with a microscope-mounted glass needle, and counting the number of divisions throughout the life of the cell. Tens or hundreds of cells per strain have to be dissected and counted to determine whether the lifespans of two strains are statistically different (11–14). This method has not changed appreciably since the initial discovery of yeast replicative aging in 1959 (15). A well-trained yeast dissector can monitor and handle no more than 300 cells at once, and a typical lifespan experiment usually thus lasts ∼4 wk. Most lifespan experiments include an overnight 4 °C incubation everyday throughout the experiment for practical purposes, adding another factor that can complicate data interpretation. This tedious and low-throughput procedure has substantially hindered progress. Therefore, new strategies are required to take advantage of the power of yeast genetics and apply high-throughput unbiased genetic screen approaches to yeast aging research.
Microfluidic devices have been developed to capture yeast cells for high-resolution imaging analysis during vegetative growth (16–20). Recently, such devices have been designed that enable the tracking of yeast cells throughout their lifespan, making it possible to record and study cellular phenotypic changes during aging (21–23). However, many issues prevent the use of microfluidic devices in a high-throughput manner for lifespan screens. First, although the time required to monitor the entire lifespan of the yeast cell has been dramatically reduced, the throughput is limited to 1–4 channels per device (21–23). Second, mother cells were immobilized underneath soft elastomer [polydimethylsiloxane (PDMS)] micropads (21, 22). Although several hundred trapping micropads can be assembled for each microfluidic channel, this trap design suffers from a low retention rate of ∼30% by the end of the lifespan; this seriously limits the number of usable cells in the lifespan calculation to ∼100, which restricts statistical significance of the lifespan analysis. Third, the ability for trapping micropads to retain old cells depends on the larger size of old cells compared with young cells (21, 22). However, old cells often generate large daughter cells that also become trapped by the micropads. Fourth, the micropad design often allows more than one cell to be trapped; multiple cells can be trapped underneath one micropad, whereas no cells are trapped under others. Finally, in one of the designs, cell-surface labeling and chemical modification of the device are required, which has proven to be technically challenging for fabrication and to introduce adverse effects on replicative lifespan (23).
Here, we present a microfluidic platform called high-throughput yeast aging analysis chip (HYAA-Chip), which solves all of the described challenges and limitations. This innovative design can trap up to 8,000 individual yeast cells in cup-shaped PDMS structures evenly distributed to 16 discrete channels; captured cells are cultivated and aged as fresh medium continuously flows through, which removes newly budded daughter cells. The HYAA-Chip provides automated whole-lifespan tracking with fine spatiotemporal resolution and large-scale data quantification of single yeast cell aging by combining simple fabricated microfluidics with high-resolution time-lapse microscopy. The HYAA-Chip is label-free, independent of size differences between mother and daughter cells, has up to 96% single-cell trapping efficiency, and up to 92% retention rate for the initially trapped mother cells.
Results
Design of the HYAA-Chip.
The HYAA-Chip is composed of molded PDMS and contains 16 parallel microfluidic channels grouped into four modules, each of which includes four channels branched from a single medium inlet and merged into a single outlet (Fig. 1A and Fig. S1A). Each microfluidic channel features a sample inlet and 520 single-cell trapping structures in its microfluidic chamber. In a typical aging experiment, fresh medium is introduced continuously through the medium inlet, and suspended yeast cells are injected through the sample inlet connected directly to each channel (Fig. 1B). As a result, each channel is occupied by one strain, allowing the simultaneous analysis of multiple strains in the same experiment. This design allows aging analysis of up to 16 strains in a single type of medium or four strains in up to four different media. There are a total of 8,320 single-cell traps in each device. It should be noted that the number of single cells to be tracked for testing can be adjusted by tuning the microscope program and experimental conditions, such as time-lapse interval, the number of capture positions, and the type of objective lens.
Fig. 1.

Design and working mechanism of the HYAA-Chip for studying aging in yeast. (A) Optical image of the fabricated HYAA-Chip. (Scale bar: 10 mm.) (B) Microscopic image of branched trapping channels linked in parallel. (Scale bar: 1 mm.) (C) SEM of trap arrays in the HYAA-Chip at a 40° tilt angle. (Scale bar: 50 μm.) (Inset) SEM image of a magnified single-trap structure. (D) Schematic view showing the HYAA-Chip working mechanism. (E) Example images of a single yeast cell showing the working mechanism procedure. (Scale bar: 10 μm.)
Fig. S1.

Design of the HYAA-Chip and the trap structure. (A) Exported image from the AutoCAD file of the HYAA-Chip. The AutoCAD design file is available upon request. (B) Magnified view of the single trap in AutoCAD file showing detailed design and dimensions. The unit is microns.
The HYAA-Chip enables massively parallel replicative lifespan determination and aging analysis for budding yeast. The trap structure is cup-shaped with an outlet opening of 3 μm through the center (Fig. 1C and Fig. S1B). This outlet opening enables a fraction of fluid flow pushing a cell to be trapped. The height and main opening of the trap are 5 and 6 μm, respectively. The dimension of the trap was empirically optimized to ensure that the following conditions are met: (i) only a single cell is captured in each trap; (ii) the trapped cells are stably retained during the entire course of the aging experiment; and (iii) the trap does not pose a spatial constraint to cell size increase during aging. Detailed operation and cell-loading procedures for the HYAA-Chip are described in SI Materials and Methods. Once cell trapping is complete, the cultivation of trapped cells is conducted with continuous medium flow. As the trapped cells grow and bud, daughter cells are produced, detached from their mother cells, and then removed by medium flow (Fig. 1D). Independent of the position from which the daughter cells budded from the mother cell surface, the daughter cells are pushed by the trap structure shape into two positions within the trap: the main larger opening against the flow direction or the smaller outlet opening (Fig. 1E). The daughter cells are washed away continuously from the mother cells by the medium, which flows at a rate that is significantly lower than that used for yeast cell-loading. The continuous medium flow removes daughter cells throughout the entire lifespan of the mother cells. By combining the HYAA-Chip with high-resolution multiposition time-lapse microscopy, the rapid and automated tracking of up to thousands of single cells is accomplished over their entire lifespan in a single experiment.
Microfluidic system designs for studying yeast aging have been reported previously (24–26); however, they did not permit assays of yeast replicative lifespan because they are unable to track the entire lifespan of mother cells due to the low efficiency in removing daughter cells. The designs reported previously can track trapped mother cells for only up to 18 h (24) and for up to eight divisions (25). Although another system could track the whole lifespan of trapped mother cells, the retention rate of these cells in the original traps over the time course was ∼40–60% (26). More than 40% of monitored cells were lost before reaching the end of their lifespan. In addition, the systems were not designed to analyze multiple strains simultaneously. In contrast to these previous designs, the HYAA-Chip features completely redesigned trapping structures with a greater than 90% retention rate, as well as the capability to assay multiple strains (in different mediums) in the same experiment, resulting in high-throughput quantification of the replicative lifespan in yeast. To our knowledge, these features make our system the first truly high-throughput and reliable platform for examining the replicative lifespan, which sets us apart from any of the previously reported designs.
Trapping Single Yeast Cells.
Trapping single yeast cells with high efficiency is crucial for high-throughput single-cell imaging analysis. The single-cell trapping and medium flow velocity distribution were simulated by the finite element method (FEM). The simulation showed cell trajectories, distribution of flow velocity magnitudes, and flow streamlines (Movie S1). The flow-velocity field and streamlines show that, initially, a suspended cell is most likely to be dragged toward the opening of an empty trap due to lower flow resistance (Fig. S2A). Once a single cell is loaded within the trap (Fig. S2B), the opening is occluded, generating an altered hydrodynamic flow. Therefore, subsequent cells bypass the occupied trap (Fig. S2C). This mechanism ensures that each trap captures only a single cell.
Fig. S2.

Single yeast cell trapping. (A–C) Magnified view of simulated medium flow velocity field and streamlines for a single trap (A) before and (B) after single cell trapping, as well as (C) while bypassing a subsequent cell. Streamlines indicate the medium flow direction. Colors represent the magnitude of medium flow velocity. (D) Image of immobilized single yeast cells in a trap array to demonstrate the spacing between columns and rows. (Scale bar: 30 μm.) (E) Efficiency of single-cell trapping according to different column and row spacing in the trap array. Error bars represent the SD of four independent tests.
The spacing in the trap array is an important parameter for efficient single-cell trapping. We tested three different column spacing parameters (6, 12, and 18 μm) and three different row spacing parameters (6, 12, and 18 μm; Fig. S3). Yeast cell culture (106−107 cells/mL) and yeast extract-peptone-dextrose (YPD) medium were simultaneously introduced by syringe pumps into the HYAA-Chip at the rates of 5 μL/min and 20 μL/min, respectively. The efficiency was determined by the ratio of the number of trapped single cells to the total number of traps in the device, and it varied from 75.3% to 96.2%, depending on the column and row spacing (Fig. S2E). We determined that the column spacing should be equal to or smaller than the row spacing for higher trapping efficiency. The single-cell trapping efficiency was highest (96.2 ± 2.3%) when the device had 6-μm column and 6-μm row spacing. However, channels with this spacing were prone to clogging by the daughter cells removed from the trapped mother cells. Therefore, the trap array was optimal at 12-μm column and 12-μm row spacing, which ensured high single-cell trapping efficiency (91.7 ± 1.8%) and minimal channel clogging.
Fig. S3.

Images of different trap arrays using different column and row spacing in the HYAA-Chip. The spacing shown is as follows: (A) 6-μm column and 12-μm row; (B) 6-μm column and 18-μm row; (C) 12-μm column and 12-μm row; (D) 12-μm column and 18-μm row; (E) 18-μm column and 12-μm row; and (F) 18-μm column and 18-μm row. (Scale bars: 100 μm.)
Automated Tracking of the Whole Lifespan of Single Yeast Cells.
To track the entire lifespan of budding yeast cells, the HYAA-Chip was mounted onto the stage of an inverted microscope equipped with an incubator system. Three representative yeast strains were used in the test experiments, including WT, short-lived sir2Δ, and long-lived fob1Δ. Trapped yeast cells were cultured with continuous flow of YPD media and maintained at 30 °C. Time-lapse images of multiple positions over the array were recorded at 10-min intervals with a 40× objective lens for 96 h. The aging time-course from young mother cell until death is shown in Fig. 2A. Initially, the trapped young mother cell grew to a critical size and started budding. As cytokinesis was completed, the detached daughter cell was washed away by continuous flow of medium. With successive cell divisions, the cell size increased. The mother cell continued producing daughter cells until senescence, which was quickly followed by cell lysis.
Fig. 2.

Tracking the complete lifespan of trapped yeast cells. (A) Time course of the aging process from young mother until death for a single cell in the trap. Times given in each image indicate the culture duration of the trapped mother cell. (Scale bar: 10 μm.) (B) Retention rate of the initially trapped single yeast cells throughout the 96-h duration of five independent experiments. Average retention rate at the 96-h duration was 90.94 ± 1.2%. (C) Replicative lifespan analyses of WT, sir2Δ, and fob1Δ strains. Average lifespans: WT, 25.76 divisions (n = 458); sir2Δ, 13.32 divisions (n = 423); fob1Δ, 33.88 divisions (n = 474). Detailed statistical data are shown in Table S3. (D) The high-throughput replicative lifespan assay of 12 single-gene deletion mutations previously reported to affect lifespan. Percent change of average replicative lifespan for each mutation strain relative to experiment-matched wild-type cells for our test results, using the HYAA-Chip and the literature findings using the conventional microdissection method, is shown. More detailed data are shown in Table S2.
The lifespan data were collected by counting the total number of daughter cells produced by each single mother cell. Although some initially trapped mother cells were lost during long-term cultivation, the retention rate of these early cells was quite high, ranging from 89.15% to 92.56% throughout all five 96-h experiments (Fig. 2B). The budding events were identified by comparing sequential images. Based on the obtained data, the lifespan of the three different yeast strains (WT, sir2Δ, and fob1Δ) were determined by plotting the fraction of viable cells vs. the generation of daughter cells (Fig. 2C). The average lifespan of the WT strain was 25.76 divisions, whereas sir2Δ and fob1Δ underwent 13.32 and 33.88 divisions, respectively. These results are consistent with those obtained using the conventional microdissection method (Fig. S4), suggesting that yeast replicative lifespan measurements can be accurately reproduced by the HYAA-Chip. However, this new method can complete automated whole-lifespan tracking of a large number of single cells in 3–4 d instead of 3–4 wk, as required for the conventional microdissection method, thereby greatly reducing the labor and time required for each experiment (Table S1). In addition, the HYAA-Chip demonstrated high reproducibility of replicative lifespan measurement across replicated experiments (Fig. S5).
Fig. S4.

Comparison of yeast replicative lifespan measurements. (A) HYAA-Chip lifespan assay. (B) Conventional manual microdissection lifespan assay. More detailed data are shown in Table S1.
Table S1.
Detailed comparison of yeast replicative lifespan analyses using the HYAA-Chip vs. the conventional manual microdissection method for the WT, sir2Δ, and fob1Δ strains
| HYAA-Chip (time to complete assay, 3–4 d) | Manual microdissection (time to complete assay, 21–28 d) | |||||||
| Mean RLS | Minimum RLS | Maximum RLS | No. of cells | Mean RLS | Minimum RLS | Maximum RLS | No. of cells | |
| WT | 25.76 | 5 | 46 | 458 | 26.38 | 3 | 49 | 80 |
| sir2Δ | 13.32 | 3 | 27 | 423 | 13.34 | 3 | 29 | 119 |
| fob1Δ | 33.88 | 4 | 61 | 474 | 35.98 | 7 | 62 | 120 |
Fig. S5.

Reproducibility of the HYAA-Chip lifespan assay in WT cells. Each bar represents an average value of five independent RLS assays using the HYAA-Chip. Mean replicative lifespan, 24.74 ± 0.64 divisions; median replicative lifespan, 25.1 ± 1.28 divisions; maximum replicative lifespan, 45 ± 2.12 divisions.
Automated tracking of aging cells in the HYAA-Chip allowed for the tracking of cell-cycle dynamics in single cells. Cell-cycle time, which is defined as the time interval between two successive budding events, was tracked for each cell over its entire lifespan and plotted as a function of lifespan fraction for WT, sir2Δ, and fob1Δ (Fig. S6). This study would be nearly impossible with the traditional approach. The average division time of the cells continuously ranged between 70 and 100 min until the cells approached death. As expected (13), the cell-cycle time increased dramatically for all strains as the cells neared the end of their lifespan. Eventually, the mother cell became permanently arrested and then lysed. However, cell-cycle dynamics were very different near the end of life between the three strains. Compared with the other strains, the last few cell-cycle times before death of the long-lived fob1Δ strain were much longer and exhibited larger SD. Changes in cell size seemed to correlate with the cell cycle time. Throughout most of the lifespan, the cell cycles were regular and cell size increased gradually. As the cell approached the end of its lifespan with drastically prolonged cell cycle, cell size also increased dramatically (Fig. S7). Although an inverse correlation between cell size and lifespan has been reported (27), the underlying molecular mechanism causing these changes in cell cycle time and cell size remains poorly understood.
Fig. S6.

Comparison of cell-cycle times in the WT, sir2Δ, and fob1Δi strains. The length of the last division before cell death was 180.4 ± 12.3 min for WT, 145.1 ± 10.9 min for the sir2Δ mutant, and 289.3 ± 115.8 min for the fob1Δ mutant. Data represent the average and SD.
Fig. S7.

Rate of cell size increase throughout the entire lifespan of budding yeast. Cell size increased gradually and then more dramatically as the cells reached senescence. An 81.3% increase in cell size was observed during the last four divisions.
High-Throughput Measurement of Yeast Replicative Lifespan with the HYAA-Chip.
The HYAA-Chip enables a large-scale replicative lifespan assay of up to 16 strains in a single experiment. To validate the high-throughput capability and reliability of the HYAA-Chip, we tested, simultaneously on the same microfluidic device, 12 single-gene deletion mutations previously reported to alter the yeast replicative lifespan. All mutants used were on the BY4742 background and from the ORF deletion library. The parental strain BY4742 was also included in the same experiment. To avoid possible bias, the experiment was performed blind with only a randomly assigned numerical identifier used to differentiate each strain during the test.
Our results demonstrate that the HYAA-Chip lifespan assay accurately determined that three mutants have a shortened lifespan (bre1Δ, chl1Δ, and rpn4Δ) and nine mutants have a longer lifespan (fob1Δ, hsp104Δ, idh1Δ, rpl22aΔ, sas2Δ, sip2Δ, tma19Δ, tor1Δ, and ubr2Δ) than the WT strain (Fig. 2D and Fig. S8). Table S2 compares the detailed test results by HYAA-Chip against published data for each strain. These results not only provide convincing evidence for the high efficiency and high-throughput capability of this novel yeast replicative lifespan assay, but also demonstrate that lifespan measurements made by the HYAA-Chip were consistent with those obtained using the conventional microdissection approach.
Fig. S8.

Comparison of RLS between 12 single-gene deletion mutants. The 12 single-gene mutations previously reported to alter replicative lifespan were tested simultaneously within a single experiment using the HYAA-Chip. As an experiment-matched control, a WT strain was also tested with the mutations in the same experiment.
Table S2.
Comparison analysis of the replicative lifespan of 12 single-gene deletion mutants as determined by the HYAA-Chip and the manual microdissection method
| Mutant | HYAA-Chip | Manual microdissection* | Ref. | |||||||||
| RLS | Cell no. | WT RLS | WT cell no. | RLS change, % | P value† | RLS | Cell no. | WT RLS | WT cell no. | RLS change, % | ||
| bre1Δ | 17.16 | 100 | 23.17 | 100 | −25.94 | 7.89E-08 | 17.6 | 65 | 24.4 | 45 | −27.9 | 40 |
| chl1Δ | 19.31 | 100 | 23.17 | 100 | −16.66 | 0.000431 | 16.0 | NR | 25.0 | NR | −36.0 | 41 |
| fob1Δ | 30.82 | 100 | 23.17 | 100 | 33.02 | 1.39E-08 | 27.4 | 45 | 21.6 | 45 | 26.9 | 42 |
| hsp104Δ | 25.95 | 100 | 23.17 | 100 | 12.00 | 0.053973 | 32.4 | 20 | 30.4 | 20 | 6.6 | 43 |
| idh1Δ | 27.87 | 100 | 23.17 | 100 | 20.28 | 0.001036 | 33.5 | 285 | 26.5 | 445 | 26.4 | 44 |
| rpl22aΔ | 29.97 | 100 | 23.17 | 100 | 29.35 | 5.82E-05 | 35.8 | 285 | 27.1 | 204 | 32.1 | 44 |
| rpn4Δ | 18.05 | 100 | 23.17 | 100 | −22.10 | 1.64E-07 | 13.3 | 117 | 25.5 | 120 | −47.8 | 45 |
| sas2Δ | 31.77 | 100 | 23.17 | 100 | 37.12 | 5.99E-10 | 32.4 | 105 | 26.7 | 125 | 21.3 | 46 |
| sip2Δ | 28.62 | 100 | 23.17 | 100 | 23.52 | 0.000112 | 31.1 | 125 | 26.4 | 145 | 17.8 | 47 |
| tma19Δ | 27.33 | 100 | 23.17 | 100 | 17.95 | 0.000884 | 33.4 | 45 | 25.3 | 65 | 32.0 | 47 |
| tor1Δ | 29.03 | 100 | 23.17 | 100 | 25.29 | 8.59E-06 | 29.6 | 65 | 24.2 | 65 | 22.3 | 14 |
| ubr2Δ | 31.18 | 100 | 23.17 | 100 | 34.57 | 1.72E-10 | 40.9 | 60 | 30.5 | 60 | 34.1 | 45 |
Testing Effects of Calorie Restriction.
Calorie restriction (CR), which involves a dietary regimen low in calories without malnutrition, extends the lifespan of most model organisms including yeast, worms, flies, and mammals (28–31). CR is commonly performed in yeast by reducing the glucose concentration in otherwise glucose-rich medium. To examine if we could detect the longevity effect of CR in this high-throughput microfluidic setting, we performed lifespan assays with the HYAA-Chip using the synthetic complete (SC) media containing 2.0% (normal condition), 0.5% (moderate CR), and 0.05% (severe CR) (wt/vol) glucose. As shown in Fig. 3A, the WT lifespan was progressively and significantly extended as glucose concentration was reduced. The effect of CR on the average cell-cycle time was small and insignificant, indicating that cells were not starved under these conditions (Fig. S9). However, significant variation in cell-cycle time was observed for cells under CR conditions, likely due to oscillations of cellular metabolic states under CR (32).
Fig. 3.
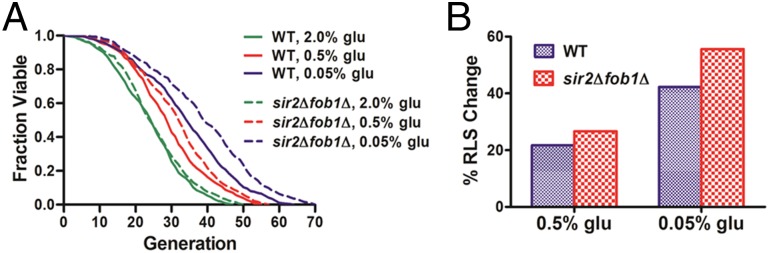
Effects of calorie restriction on aging. (A) Lifespan analyses of WT and sir2Δfob1Δ double mutant in SC media supplemented with 2, 0.5, and 0.05% glucose. Average lifespans for WT: 24.16 divisions for 2% (wt/vol) glucose (n = 222), 29.41 divisions for 0.5% glucose (n = 252), and 34.37 divisions for 0.05% glucose (n = 260). Average lifespans for sir2Δfob1Δ: 25.2 divisions for 2% (wt/vol) glucose (n = 212), 31.92 divisions for 0.5% glucose (n = 235), and 39.22 divisions for 0.05% glucose (n = 251). Detailed statistical data are shown in Table S3. (B) Percent change of average RLS by CR for WT and sir2Δfob1Δ double mutant relative to the experiment-matched 2% (wt/vol) glucose condition. WT: 21.73% for 0.5% glucose and 42.26% for 0.05% glucose; sir2Δfob1Δ: 26.67% for 0.5% glucose and 55.63% for 0.05% glucose.
Fig. S9.

Effects of calorie restriction on cell-cycle time. Comparison of cell-cycle times (average ± SD) for 2, 0.5, and 0.05% glucose for the WT strain. Last cell-cycle time before death: 2% (wt/vol) glucose, 187.6 ± 15.4 min; 0.5% glucose, 208.7 ± 13.1 min; 0.05%, 231.1 ± 16.3 min.
Recently, Huberts et al. (33) reported that CR-induced lifespan extension could not be detected with their microfluidic dissection platform. In contrast, we observed a robust CR longevity effect with the HYAA-Chip that is consistent with results obtained from the conventional microdissection-based lifespan assay. One possible explanation for this discrepancy is the very low retention rate of the cells in Huberts’ device. As noted in their paper (33), 85% of all cells were lost before reaching the end of the lifespan, and in their analysis, experimental data obtained from cells that were washed out before death were incorporated into the lifespan curve as right-censored data using the Kaplan–Meier analysis. Notably, due to the very low retention rate of their platform, the contribution of the washed out cells to the resultant data were significantly larger than that of the retained cells that were tracked throughout their entire lifespan. Our analysis of their raw data from retained and washed out cells confirmed that the right-censored data might have been the cause of the reported lack of lifespan extension by CR. When we analyzed only the cells that were tracked throughout their entire lifespan, we found that, under all CR conditions except 0.5% glucose, a lifespan extension effect was observed in the range of 9.61% to 27.76%, which is contrary to their report (Fig. S10). Consistent with previous dissection-based methods, the lifespan peaked and then declined as the glucose concentration decreased. This finding suggests that a high cell retention rate is critical for the accuracy and reliability of the microfluidic platform for studying aging.
Fig. S10.

Lower retention rate of mother cells trapped in a microfluidic system could prevent accurate and reliable measurement of replicative lifespan. (A) RLS curves for various CR conditions based on raw data published by Huberts et al. (33). Only retained cells tracked throughout their entire lifespan were analyzed for the lifespan curve [n = 397 cells for 2% (wt/vol) glucose, excluding 2,409 cells washed out during the experiment; n = 221 cells for 0.5% glucose, excluding 1,154 cells washed out during the experiment; n = 151 cells for 0.25% glucose, excluding 450 cells washed out during the experiment; n = 114 cells for 0.1% glucose, excluding 472 cells washed out during the experiment; n = 175 cells for 0.05% glucose, excluding 476 cells washed out during the experiment]. (B) Detailed comparison with the previously published data (33).
To further verify the reliability of the HYAA-Chip for assessing CR-induced longevity effects, we performed the lifespan assay on the sir2Δfob1Δ double mutant using SC media containing 2.0%, 0.5%, and 0.05% glucose (Fig. 3A). As expected (34), the lifespan of this mutant was robustly extended as the glucose concentration was reduced. Lifespan extension due to CR was 26.67% on 0.5% glucose and 55.63% on 0.05% glucose relative to the mean lifespan on 2.0% (wt/vol) glucose (Fig. 3B). The CR longevity effect for sir2Δfob1Δ was larger than that for WT cells. These results are consistent with previously published data obtained using the conventional microdissection method (34).
Critical Cell Size Correlates Negatively with Remaining Lifespan.
Nascent yeast cells must grow to a critical size before initiating DNA replication and undergoing the first round of mitosis (35) (Fig. 4 A and B). The time to reach the critical size is generally longer than the regular cell cycle. We found that the critical size correlated negatively with the remaining replicative lifespan of the cell (Fig. 4C). Cells that began budding at a smaller size had a longer remaining lifespan, whereas cells that began budding at a larger size had a shorter lifespan. The effect of cell size and growth rate on replicative lifespan has been reported for various mutants (27). Large-cell mutants grew proportionally faster and had a shorter lifespan than small-cell mutants. However, the types of cell size studied were the birth size of daughter cells at cell division and the averaged overall size of daughter cells for aging, rather than the critical size of mother cells when mitosis is initiated. Cell-cycle regulation could change the rate of cell growth (36). Thus, our observation suggests that the regulation responsible for determining the critical size may be involved in controlling aging, and that critical size could be used as a longevity marker for budding yeast.
Fig. 4.

Critical cell size can be a marker for longevity in the budding yeast. (A and B) Time-course images of a cell show growth to the critical size for initiation of budding. Times given in each image indicate the culture duration of the trapped mother cell. The cell began dividing with a (A) relatively smaller critical size, resulting in a relatively longer lifespan of 23 generations. When the cell began dividing with a (B) relatively larger critical size, the lifespan was shorter, consisting of only eight generations. (Scale bar: 10 μm.) (C) Correlation between the critical cell size and lifespan. The red line indicates a linear regression of the correlation (n = 270, R2 = 0.7185). (D) Critical cell size of WT strain grown in 2, 0.5, and 0.05% (wt/vol) glucose in SC media and the fob1Δ strain grown in 2% (wt/vol) glucose. Average critical cell sizes: WT 2% (wt/vol) glucose, 5.85 μm (n = 215); WT 0.5% glucose, 4.96 μm (n = 220); WT 0.05% glucose, 4.39 μm (n = 237); fob1Δ 2% (wt/vol) glucose, 5.17 μm (n = 232). Asterisks indicate statistically significant differences (P < 0.0001) compared with WT grown in 2% (wt/vol) glucose in SC medium. Detailed statistical data are shown in Table S3.
We also examined whether a correlation exists between critical size and replicative lifespan for long-lived mutants and CR-induced longevity. Indeed, fob1Δ exhibited a smaller critical size than WT under normal glucose conditions. In addition, the average critical cell size of WT decreased with decreasing glucose concentration as cells grown in 0.05% glucose showed the smallest critical cell size (Fig. 4D) and longest lifespan. These data reaffirm that a small critical size can be an indicator for longevity in yeast.
Terminal Morphological Characteristics.
Terminal morphology, or the budding state, of a mother cell varies when it reaches senescence. As shown in Fig. 5A, these states can be classified as unbudded (Movie S2), round-budded (Movie S3), or elongated-budded (Movie S4). In the round- and elongated-budded states, the last daughter cells do not separate from the mother cells when they die. Determination of terminal morphology can be accomplished by microscopic visualization of cells at the end of their lifespan. However, only a few studies (21, 37) have reported data for this phenotype because tracking the terminal morphology of a large number of individual mother cells is labor-intensive and time-consuming when traditional lifespan assay methods are used. Budded death patterns of yeast with a relatively small number of cells were evaluated (21), as well as the unbudded and unclassified budded states (37).
Fig. 5.

Characterization of terminal morphology in aging cells. (A) Example images of three different terminal morphologies: the unbudded, round-budded, and elongated-budded states. (Scale bar: 10 μm.) (B–D) Lifespan of cells that arrested in the unbudded and budded (round-budded and elongated-budded) states for (B) WT (n = 418), (C) sir2Δ (n = 407), and (D) fob1Δ (n = 440). (E) Proportion of cells arrested in the three states for the WT, sir2Δ, and fob1Δ strains.
We investigated three types of budding state at senescence of the WT, sir2Δ, and fob1Δ strains using the HYAA-Chip to determine the relationship between terminal morphology and lifespan for each strain (Fig. 5 B–D). Cells arrested in budded and unbudded states had significantly different longevity. For each strain, cells arrested in the budded state lived fewer generations on average than those arrested in the unbudded state. For the budded state of all strains, cells with the round-budded terminal morphology had longer lifespans than those with the elongated-budded morphology. As shown in Fig. 5E, a majority of WT cells was arrested in the unbudded state (67.46% unbudded, 13.49% round-budded, and 19.05% elongated-budded). The sir2Δ strain had significantly more cells arrested in the budded state, especially the elongated-budded terminal morphology (20.78% unbudded, 23.38% round-budded, and 55.84% elongated-budded). In contrast, the fob1Δ strain showed slightly elevated unbudded and significantly reduced elongated-budded terminal states compared with the WT (72.73% unbudded, 20.46% round-budded, and 6.81% elongated-budded). These observations suggest that the elongated-budded terminal state is associated with a shortened lifespan.
Tracking of Protein Subcellular Localization.
Because proteins must localize to the appropriate subcellular compartment (e.g., actin, endosome, mitochondria, vacuole, and nucleus) to function, comprehensive knowledge of protein localization is critical for understanding their functions and interactions. The yeast GFP library, which contains 4,160 detectable GFP fusion clones, provided the first global analysis of protein subcellular localization for a eukaryotic cell (38). However, its application in aging studies has been scarce due to the lack of a high-throughput assay and limitations on continuous tracking of protein localization throughout the entire cellular lifespan using the conventional microdissection method.
To validate the capability of the HYAA-Chip for continuous tracking of protein subcellular localization during aging, we examined the subcellular localization of GFP-tagged Nop56 and Vma1 throughout the lifespan of the cell. Nop56 and Vma1 are well-characterized markers for the nucleolus and vacuolar membrane, respectively. As shown in Fig. 6 and Fig. S11, the HYAA-Chip tracked the subcellular localization of GFP-tagged Nop56 and Vma1 continuously and effectively. Moreover, the subcellular structure in which these proteins resided throughout the entire lifespan was also visualized (Movies S5 and S6). The localization of several other proteins, including GFP-tagged Chc1, Erg6, Sac6, and Tom70, was also tracked successfully during aging using the HYAA-Chip (Fig. S12 and Movie S7). Such data can be captured and quantified for hundreds of cells per strain, and up to 16 strains at a time, significantly improving the throughput and statistical power compared with previous microfluidic approaches. Thus, the HYAA-Chip could be applied toward proteomic analysis to track protein turnover and localization during aging, as well as asymmetric partitioning between mother and daughter cells with the yeast GFP library.
Fig. 6.

Tracking protein subcellular localization of trapped yeast cells during aging. (Upper) Time-course images of GFP showing nucleolus localization of GFP-tagged Nop56 from young mother until death for a single cell in the trap. (Lower) The corresponding merged images of GFP and bright-field. The numbers given in each GFP image indicate the generation of the trapped mother cell.
Fig. S11.

Tracking protein subcellular localization of trapped yeast cells during aging. (Upper) Time-course images of GFP showing vacuole localization of GFP-tagged Vma1 from young mother until death for a single cell in the trap. (Lower) The corresponding merged images of GFP and bright-field. The numbers given in each GFP image indicate the generation of the trapped mother cell.
Fig. S12.

Representative images of protein subcellular localization that was tracked with the HYAA-Chip during aging. Chc1, Erg6, Sac6, and Tom70 are well-characterized markers for late Golgi, lipid particle, actin, and mitochondria, respectively.
SI Materials and Methods
Finite Element Simulations.
Cell trajectories and flow velocity distribution in the trapping channel were simulated using the FEM. To perform the temporal simulation of cell trapping and bypassing, the fluidic dynamics (incompressible Navier–Stokes equations) and solid mechanics equations (Newton’s second law of motion) were coupled and implemented by fluid–solid interactions, which combined the spatial frame interface for fluid flow and the material frame for the cell. The mesh geometry was moved continuously and deformed by applying the arbitrary Lagrangian–Eulerian method (48). The dimensions of model geometries for the traps and channel were identical to the actual device. Solid spheres were used as a model for yeast cells. PDMS properties were used to model the traps and channel. YPD medium was defined as the fluid in the simulations. The initial boundary was given a flow velocity of 200 μm/s, which corresponded to the medium flow rate used during experiments. The trap surfaces were set to have no-slip conditions.
Fabrication of the HYAA-Chip.
The HYAA-Chip was fabricated using soft lithography with a polydimethylsiloxane (PDMS) molding technique. The trap structures were first plotted with AutoCAD software, and the dimensions of each individual trap were optimized. The trap height was set at 5 μm by controlling the photoresist thickness during fabrication. To obtain a 5 μm-thick mold layer, negative photoresist (SU-8 3005; MicroChem) was spun onto the silicon wafer at 500 rpm (Laurell Technologies Corp., North Wales, PA; model WS-400B-6NPP/LITE/AS) for 10 s with an acceleration of 100 rpm/s to spread out the photoresist, then at 3,000 rpm for 30 s with an acceleration of 300 rpm/s. The wafer was then soft-baked for 1 min at 65 °C and 3 min at 95 °C. The wafer was then patterned with a UV light source with an exposure dose of 150 mJ/cm2, and postexposure baking was performed immediately after for 1 min at 65 °C and 2 min at 95 °C. After developing in the SU-8 developer for 3 min, the wafer was hard-baked for 30 min at 150 °C. The hard-baked wafer served as an SU-8 mold structure. The PDMS oligomer and cross-linking prepolymer of the PDMS agent from a Sylgard 184 kit (Dow Corning) was mixed in a weight ratio of 10:1. Once the mixture was placed under vacuum for degassing, it was poured onto the SU-8 mold, and then cured at 80 °C for 2 h. After the PDMS replica was peeled off from the SU-8 mold, the inlets and outlets were generated using a biopsy punch (0.5 mm Inner Diameter; Harris Uni-Core). After oxygen plasma (1 min at 20 sccm oxygen flow rate, 500 mTorr chamber pressure, and 50 W power) was applied to activate both the PDMS and glass slide surfaces, the PDMS replica was bonded to the glass slide.
Operation of the HYAA-Chip.
To operate the HYAA-Chip, the fabricated device was placed on the stage of an inverted microscope equipped with an incubator system set to 30 °C. The main inlets of the HYAA-Chip were connected to microbore tubing (Tygon; Saint-Gobain), which was connected to 50-mL syringes filled with culture media. A syringe filter (0.22-μm pore size; Fisher Scientific) was attached to the 50-mL medium-filled syringe to avoid contamination of the supplying media. The syringes were installed to the syringe pumps (Gemini 88; KD Scientific) to allow precise flow rate control. The HYAA-Chip was primed first with culture media through the main inlet by a syringe pump at a flow rate of 20 μL/min. The subinlets of channels were blocked with small pins until the channels were fully primed. Once primed, the channel subinlets were connected to 1-mL syringes filled with the desired yeast cell suspensions (106−107 cells/mL) through microbore tubing. The desired cell suspensions were introduced through the subinlets at a flow rate of 2–5 μL/min. After most traps were filled with single cells, the 1-mL syringes were carefully removed and the subinlets were sealed by the small pins. Subsequently, the medium flow rate was reduced to 5–10 μL/min and image acquisition with multiposition time-lapse function was started. Medium flow was provided continuously to the HYAA-Chip during the entire experiment to keep the cells trapped via positive pressure and to maintain constant growth conditions.
Discussion
Understanding the molecular mechanisms that regulate aging and age-associated diseases is an instrumental step toward designing interventions that delay the onset of diseases and physiological changes linked to aging, which is a leading risk factor for many diseases. Considerable research effort has focused on uncovering the molecular mechanisms of aging and their contributions to age-associated diseases. The replicative lifespan measurement of yeast cells has become a general method for mechanistic studies of aging processes, and has been used to identify genes and pathways associated with longevity that are conserved among all eukaryotes. Current yeast aging research is fraught with technical challenges including labor-intensive and time-consuming experimentation, low-throughput data collection, discontinuous tracking, and the lack of reliable single-cell assays.
We developed an innovative and highly efficient HYAA-Chip that allows immobilization of single yeast cells and removal of newly budded daughter cells without losing trapped mother cells. Our microfluidic platform combines the HYAA-Chip with high-resolution multipositioning time-lapse microscopy. This approach offers an unparalleled method for aging studies. First, our platform allows fully automated tracking of the entire lifespan for several thousand individual cells in a single experiment with high spatiotemporal resolution. This platform saves labor and time. It should be noted that the device cannot selectively trap virgin cells at the beginning of the experiment. However, in a typical log-phase culture, ∼80% of total cells are virgin and 12% have only budded once (21, 39). Thus, the lack of virgin cell selection should not have a significant effect on the final lifespan results. Second, the HYAA-Chip can be easily multiplexed by connecting multiple channels. This platform enables simultaneous analysis of multiple strains and multiple media, resulting in high-throughput quantification of longevity. Third, fluorescent imaging of single cells during the entire aging process offers high spatiotemporal resolution and high-throughput examination of the aging phenotype, including organelle morphology, gene expression, and protein localization. Therefore, genetic or environmental factors that regulate lifespan can be investigated at the single-cell level. Finally, this platform allows cells to be maintained under a constant growth condition in the microfluidic channel throughout their entire lifespan, thereby minimizing variations introduced by operators and the environment. These capabilities effectively remove the barriers of existing lifespan assays that have hindered high-throughput aging studies in yeast.
Materials and Methods
Yeast Strain Preparation.
Yeast strains with a BY4741 background (MATα his3∆1 leu2∆0 met15∆0 ura3∆0), BY4742 background (MATα his3∆1 leu2∆0 lys2∆0 ura3∆0), and single-gene deletion strains were obtained from the yeast ORF deletion library (Thermo Fisher). GFP-tagged strains were obtained from the yeast GFP collection (Life Technologies). Cells were cultured in YPD at 30 °C overnight before diluting 10–50-fold and loading into the HYAA-Chip. YPD medium containing 2% (wt/vol) d-glucose was used in all non-CR HYAA-Chip experiments. For CR experiments, yeast SC media containing 2, 0.5, and 0.05% d-glucose were used.
Manual Microdissection Lifespan Assay.
Yeast replicative lifespan analysis using the conventional manual microdissection method was performed as described previously (11).
Image Acquisition and Analysis.
High-resolution time-lapse images of yeast cells growing in continuous medium flow in the HYAA-Chip incubator system at 30 °C were obtained with a CCD camera (DP72; Olympus) connected to an inverted microscope (IX-81; Olympus) equipped with image acquisition software (cellSens; Olympus) and EVOS auto cell imaging system (Life Technologies). By using an automated stage, time-lapse images of up to 80 positions over the whole device were recorded with a 40× objective lens at 10-min intervals for 96 h (for all experiments excluding the tracking of the protein localization) or with a 60× high N.A. oil immersion objective lens at 20-min intervals for 72 h (for the tracking of the protein localization). The acquired images were analyzed with image processing software (ImageJ; National Institutes of Health) to determine budding events, cell size, morphological changes, and protein localization.
Statistical Analysis.
A two-tailed Wilcoxon rank-sum test was used to evaluate the significance of observed differences in lifespan and critical size. The two-tailed P value of each dataset was calculated using R and RExcel. P values are shown in Tables S2 and S3.
Table S3.
The P values by a two-tailed Wilcoxon rank-sum test to show the significance of differences in lifespan (Figs. 2C and 3A) and critical size (Fig. 4D)
| Figure no. | Strain 1 | Strain 2 | Strain 3 | Strain 4 |
| Fig. 2C | WT | sir2Δ | fob1Δ | |
| Reference | 2.39E-19 | 1.09E-07 | ||
| 2.39E-19 | Reference | 2.82E-23 | ||
| 1.09E-07 | 2.82E-23 | Reference | ||
| Fig. 3A | WT, 2% Glu | WT, 0.5% Glu | WT, 0.05% Glu | |
| Reference | 6.49E-07 | 2.20E-18 | ||
| 6.49E-07 | Reference | 4.42E-06 | ||
| 2.20E-18 | 4.42E-06 | Reference | ||
| Fig. 3A | sir2Δfob1Δ, 2% Glu | sir2Δfob1Δ, 0.5% Glu | sir2Δfob1Δ, 0.05% Glu | |
| Reference | 5.46E-10 | 7.00E-25 | ||
| 5.46E-10 | Reference | 3.27E-09 | ||
| 7.00E-25 | 3.27E-09 | Reference | ||
| Fig. 4D | WT, 2% Glu | WT, 0.5% Glu | WT, 0.05% Glu | fob1Δ, 2% Glu |
| Reference | 3.92E-13 | 2.08E-23 | 2.83E-09 | |
| 3.92E-13 | Reference | 1.39E-07 | 0.034677515 | |
| 2.08E-23 | 1.39E-07 | Reference | 2.56E-12 | |
| 2.83E-09 | 0.034677515 | 2.56E-12 | Reference |
Supplementary Material
Acknowledgments
We thank Dr. Grzegorz Ira at the Baylor College of Medicine for providing the GFP-tagged strains used in this study. We are grateful for funding support from NIH National Institutes on Drug Abuse Grant 1R01DA035868-01, NIH Grant R00AG037646, and Cancer Prevention and Research Institute of Texas Grants CPRIT-R1007 and CPRIT-R1306.
Footnotes
The authors declare no conflict of interest.
This article is a PNAS Direct Submission.
This article contains supporting information online at www.pnas.org/lookup/suppl/doi:10.1073/pnas.1510328112/-/DCSupplemental.
References
- 1.López-Otín C, Blasco MA, Partridge L, Serrano M, Kroemer G. The hallmarks of aging. Cell. 2013;153(6):1194–1217. doi: 10.1016/j.cell.2013.05.039. [DOI] [PMC free article] [PubMed] [Google Scholar]
- 2.Braun RJ, Büttner S, Ring J, Kroemer G, Madeo F. Nervous yeast: Modeling neurotoxic cell death. Trends Biochem Sci. 2010;35(3):135–144. doi: 10.1016/j.tibs.2009.10.005. [DOI] [PubMed] [Google Scholar]
- 3.Bleackley MR, Macgillivray RTA. Transition metal homeostasis: From yeast to human disease. Biometals. 2011;24(5):785–809. doi: 10.1007/s10534-011-9451-4. [DOI] [PubMed] [Google Scholar]
- 4.Pfau SJ, Amon A. Chromosomal instability and aneuploidy in cancer: From yeast to man. EMBO Rep. 2012;13(6):515–527. doi: 10.1038/embor.2012.65. [DOI] [PMC free article] [PubMed] [Google Scholar]
- 5.Miller RA. Extending life: Scientific prospects and political obstacles. Milbank Q. 2002;80(1):155–174. doi: 10.1111/1468-0009.00006. [DOI] [PMC free article] [PubMed] [Google Scholar]
- 6.Botstein D, Fink GR. Yeast: An experimental organism for 21st Century biology. Genetics. 2011;189(3):695–704. doi: 10.1534/genetics.111.130765. [DOI] [PMC free article] [PubMed] [Google Scholar]
- 7.Rine J. Cell biology. Twists in the tale of the aging yeast. Science. 2005;310(5751):1124–1125. doi: 10.1126/science.1121310. [DOI] [PubMed] [Google Scholar]
- 8.Fontana L, Partridge L, Longo VD. Extending healthy life span--from yeast to humans. Science. 2010;328(5976):321–326. doi: 10.1126/science.1172539. [DOI] [PMC free article] [PubMed] [Google Scholar]
- 9.Gershon H, Gershon D. The budding yeast, Saccharomyces cerevisiae, as a model for aging research: A critical review. Mech Ageing Dev. 2000;120(1-3):1–22. doi: 10.1016/s0047-6374(00)00182-2. [DOI] [PubMed] [Google Scholar]
- 10.Longo VD, Shadel GS, Kaeberlein M, Kennedy B. Replicative and chronological aging in Saccharomyces cerevisiae. Cell Metab. 2012;16(1):18–31. doi: 10.1016/j.cmet.2012.06.002. [DOI] [PMC free article] [PubMed] [Google Scholar]
- 11.Steffen KK, Kennedy BK, Kaeberlein M. 2009. Measuring replicative life span in the budding yeast. J Vis Exp, 10.3791/1209.
- 12.Kaeberlein M, Kennedy BK. Large-scale identification in yeast of conserved ageing genes. Mech Ageing Dev. 2005;126(1):17–21. doi: 10.1016/j.mad.2004.09.013. [DOI] [PubMed] [Google Scholar]
- 13.Sinclair D, Mills K, Guarente L. Aging in Saccharomyces cerevisiae. Annu Rev Microbiol. 1998;52:533–560. doi: 10.1146/annurev.micro.52.1.533. [DOI] [PubMed] [Google Scholar]
- 14.Kaeberlein M, et al. Regulation of yeast replicative life span by TOR and Sch9 in response to nutrients. Science. 2005;310(5751):1193–1196. doi: 10.1126/science.1115535. [DOI] [PubMed] [Google Scholar]
- 15.Mortimer RK, Johnston JR. Life span of individual yeast cells. Nature. 1959;183(4677):1751–1752. doi: 10.1038/1831751a0. [DOI] [PubMed] [Google Scholar]
- 16.Cookson S, Ostroff N, Pang WL, Volfson D, Hasty J. Monitoring dynamics of single-cell gene expression over multiple cell cycles. Mol Syst Biol. 2005;1:0024. doi: 10.1038/msb4100032. [DOI] [PMC free article] [PubMed] [Google Scholar]
- 17.Falconnet D, et al. High-throughput tracking of single yeast cells in a microfluidic imaging matrix. Lab Chip. 2011;11(3):466–473. doi: 10.1039/c0lc00228c. [DOI] [PMC free article] [PubMed] [Google Scholar]
- 18.Taylor RJ, et al. Dynamic analysis of MAPK signaling using a high-throughput microfluidic single-cell imaging platform. Proc Natl Acad Sci USA. 2009;106(10):3758–3763. doi: 10.1073/pnas.0813416106. [DOI] [PMC free article] [PubMed] [Google Scholar]
- 19.Fehrmann S, et al. Aging yeast cells undergo a sharp entry into senescence unrelated to the loss of mitochondrial membrane potential. Cell Reports. 2013;5(6):1589–1599. doi: 10.1016/j.celrep.2013.11.013. [DOI] [PubMed] [Google Scholar]
- 20.Meitinger F, et al. A memory system of negative polarity cues prevents replicative aging. Cell. 2014;159(5):1056–1069. doi: 10.1016/j.cell.2014.10.014. [DOI] [PubMed] [Google Scholar]
- 21.Lee SS, Avalos Vizcarra I, Huberts DHEW, Lee LP, Heinemann M. Whole lifespan microscopic observation of budding yeast aging through a microfluidic dissection platform. Proc Natl Acad Sci USA. 2012;109(13):4916–4920. doi: 10.1073/pnas.1113505109. [DOI] [PMC free article] [PubMed] [Google Scholar]
- 22.Zhang Y, et al. Single cell analysis of yeast replicative aging using a new generation of microfluidic device. PLoS One. 2012;7(11):e48275. doi: 10.1371/journal.pone.0048275. [DOI] [PMC free article] [PubMed] [Google Scholar]
- 23.Xie Z, et al. Molecular phenotyping of aging in single yeast cells using a novel microfluidic device. Aging Cell. 2012;11(4):599–606. doi: 10.1111/j.1474-9726.2012.00821.x. [DOI] [PMC free article] [PubMed] [Google Scholar]
- 24.Ryley J, Pereira-Smith OM. Microfluidics device for single cell gene expression analysis in Saccharomyces cerevisiae. Yeast. 2006;23(14-15):1065–1073. doi: 10.1002/yea.1412. [DOI] [PubMed] [Google Scholar]
- 25.Rowat AC, Bird JC, Agresti JJ, Rando OJ, Weitz DA. Tracking lineages of single cells in lines using a microfluidic device. Proc Natl Acad Sci USA. 2009;106(43):18149–18154. doi: 10.1073/pnas.0903163106. [DOI] [PMC free article] [PubMed] [Google Scholar]
- 26.Crane MM, Clark IB, Bakker E, Smith S, Swain PS. A microfluidic system for studying ageing and dynamic single-cell responses in budding yeast. PLoS One. 2014;9(6):e100042. doi: 10.1371/journal.pone.0100042. [DOI] [PMC free article] [PubMed] [Google Scholar]
- 27.Yang J, et al. Cell size and growth rate are major determinants of replicative lifespan. Cell Cycle. 2011;10(1):144–155. doi: 10.4161/cc.10.1.14455. [DOI] [PMC free article] [PubMed] [Google Scholar]
- 28.Partridge L, Pletcher SD, Mair W. Dietary restriction, mortality trajectories, risk and damage. Mech Ageing Dev. 2005;126(1):35–41. doi: 10.1016/j.mad.2004.09.017. [DOI] [PubMed] [Google Scholar]
- 29.Omodei D, Fontana L. Calorie restriction and prevention of age-associated chronic disease. FEBS Lett. 2011;585(11):1537–1542. doi: 10.1016/j.febslet.2011.03.015. [DOI] [PMC free article] [PubMed] [Google Scholar]
- 30.Guarente L, Picard F. Calorie restriction—the SIR2 connection. Cell. 2005;120(4):473–482. doi: 10.1016/j.cell.2005.01.029. [DOI] [PubMed] [Google Scholar]
- 31.Cullen PJ, Sprague GF., Jr Glucose depletion causes haploid invasive growth in yeast. Proc Natl Acad Sci USA. 2000;97(25):13619–13624. doi: 10.1073/pnas.240345197. [DOI] [PMC free article] [PubMed] [Google Scholar]
- 32.Tu BP, Kudlicki A, Rowicka M, McKnight SL. Logic of the yeast metabolic cycle: Temporal compartmentalization of cellular processes. Science. 2005;310(5751):1152–1158. doi: 10.1126/science.1120499. [DOI] [PubMed] [Google Scholar]
- 33.Huberts DH, et al. Calorie restriction does not elicit a robust extension of replicative lifespan in Saccharomyces cerevisiae. Proc Natl Acad Sci USA. 2014;111(32):11727–11731. doi: 10.1073/pnas.1410024111. [DOI] [PMC free article] [PubMed] [Google Scholar]
- 34.Kaeberlein M, Kirkland KT, Fields S, Kennedy BK. Sir2-independent life span extension by calorie restriction in yeast. PLoS Biol. 2004;2(9):E296. doi: 10.1371/journal.pbio.0020296. [DOI] [PMC free article] [PubMed] [Google Scholar]
- 35.Johnston M, et al. The nucleotide sequence of Saccharomyces cerevisiae chromosome XII. Nature. 1997;387(6632) Suppl:87–90. [PMC free article] [PubMed] [Google Scholar]
- 36.Goranov AI, et al. The rate of cell growth is governed by cell cycle stage. Genes Dev. 2009;23(12):1408–1422. doi: 10.1101/gad.1777309. [DOI] [PMC free article] [PubMed] [Google Scholar]
- 37.Delaney JR, et al. End-of-life cell cycle arrest contributes to stochasticity of yeast replicative aging. FEMS Yeast Res. 2013;13(3):267–276. doi: 10.1111/1567-1364.12030. [DOI] [PMC free article] [PubMed] [Google Scholar]
- 38.Huh WK, et al. Global analysis of protein localization in budding yeast. Nature. 2003;425(6959):686–691. doi: 10.1038/nature02026. [DOI] [PubMed] [Google Scholar]
- 39.Vanoni M, Vai M, Popolo L, Alberghina L. Structural heterogeneity in populations of the budding yeast Saccharomyces cerevisiae. J Bacteriol. 1983;156(3):1282–1291. doi: 10.1128/jb.156.3.1282-1291.1983. [DOI] [PMC free article] [PubMed] [Google Scholar]
- 40.Giannattasio M, Lazzaro F, Plevani P, Muzi-Falconi M. The DNA damage checkpoint response requires histone H2B ubiquitination by Rad6-Bre1 and H3 methylation by Dot1. J Biol Chem. 2005;280(11):9879–9886. doi: 10.1074/jbc.M414453200. [DOI] [PubMed] [Google Scholar]
- 41.Das SP, Sinha P. The budding yeast protein Chl1p has a role in transcriptional silencing, rDNA recombination, and aging. Biochem Biophys Res Commun. 2005;337(1):167–172. doi: 10.1016/j.bbrc.2005.09.034. [DOI] [PubMed] [Google Scholar]
- 42.Defossez PA, et al. Elimination of replication block protein Fob1 extends the life span of yeast mother cells. Mol Cell. 1999;3(4):447–455. doi: 10.1016/s1097-2765(00)80472-4. [DOI] [PubMed] [Google Scholar]
- 43.Kaeberlein M, Kirkland KT, Fields S, Kennedy BK. Genes determining yeast replicative life span in a long-lived genetic background. Mech Ageing Dev. 2005;126(4):491–504. doi: 10.1016/j.mad.2004.10.007. [DOI] [PubMed] [Google Scholar]
- 44.Delaney JR, et al. Sir2 deletion prevents lifespan extension in 32 long-lived mutants. Aging Cell. 2011;10(6):1089–1091. doi: 10.1111/j.1474-9726.2011.00742.x. [DOI] [PMC free article] [PubMed] [Google Scholar]
- 45.Kruegel U, et al. Elevated proteasome capacity extends replicative lifespan in Saccharomyces cerevisiae. PLoS Genet. 2011;7(9):e1002253. doi: 10.1371/journal.pgen.1002253. [DOI] [PMC free article] [PubMed] [Google Scholar]
- 46.Dang W, et al. Histone H4 lysine 16 acetylation regulates cellular lifespan. Nature. 2009;459(7248):802–807. doi: 10.1038/nature08085. [DOI] [PMC free article] [PubMed] [Google Scholar]
- 47.Managbanag JR, et al. Shortest-path network analysis is a useful approach toward identifying genetic determinants of longevity. PLoS One. 2008;3(11):e3802. doi: 10.1371/journal.pone.0003802. [DOI] [PMC free article] [PubMed] [Google Scholar]
- 48.Souli MH, Benson DJ. Arbitrary Lagrangian Eulerian and Fluid-Structure Interaction: Numerical Simulation. Wiley; Hoboken, NJ: 2013. [Google Scholar]
Associated Data
This section collects any data citations, data availability statements, or supplementary materials included in this article.