

Significance
The study of natural variation has profoundly advanced our understanding of plants’ phenotypic trait evolution. The analysis of intraspecific variations in metabolism, however, has lagged behind and frequently been biased toward central metabolism. To redress this bias, we present a metabolomics case study of leaf secondary metabolites of wild tobacco ecotypes subjected to simulated insect herbivory in which mass spectral maps are constructed. Navigating these maps revealed metabolic branch-specific variations and allowed the annotation of unknown metabolites of likely ecological importance. Although the profiling of entire plant metabolomes remains technically challenging due to their structural complexity, we predict that the workflow described here provides a significant advance in our ability to rapidly explore small molecules that mediate functionally important phenotypes.
Keywords: plant–insect interactions, metabolomics, mass spectrometry, natural variation
Abstract
Natural variation can be extremely useful in unraveling the determinants of phenotypic trait evolution but has rarely been analyzed with unbiased metabolic profiling to understand how its effects are organized at the level of biochemical pathways. Native populations of Nicotiana attenuata, a wild tobacco species, have been shown to be highly genetically diverse for traits important for their interactions with insects. To resolve the chemodiversity existing in these populations, we developed a metabolomics and computational pipeline to annotate leaf metabolic responses to Manduca sexta herbivory. We selected seeds from 43 accessions of different populations from the southwestern United States—including the well-characterized Utah 30th generation inbred accession—and grew 183 plants in the glasshouse for standardized herbivory elicitation. Metabolic profiles were generated from elicited leaves of each plant using a high-throughput ultra HPLC (UHPLC)-quadrupole TOFMS (qTOFMS) method, processed to systematically infer covariation patterns among biochemically related metabolites, as well as unknown ones, and finally assembled to map natural variation. Navigating this map revealed metabolic branch-specific variations that surprisingly only partly overlapped with jasmonate accumulation polymorphisms and deviated from canonical jasmonate signaling. Fragmentation analysis via indiscriminant tandem mass spectrometry (idMS/MS) was conducted with 10 accessions that spanned a large proportion of the variance found in the complete accession dataset, and compound spectra were computationally assembled into spectral similarity networks. The biological information captured by this networking approach facilitates the mining of the mass spectral data of unknowns with high natural variation, as demonstrated by the annotation of a strongly herbivory-inducible phenolic derivative, and can guide pathway analysis.
Elucidating the structure of metabolites underlying complex traits and the factors that maintain their variation in natural populations are important challenges in plant ecological studies (1). Many studies have notably shown that stress-responsive pathways that produce secondary metabolites are sporadically found across different plant taxa with extensive diversification (2). This important diversification suggests that particular metabolic systems have been recruited through natural selection when the set of compounds that they produce address specific ecological needs. Interactions with insects are important selection pressures that have sculpted plant metabolism, and many plant metabolites protect against herbivore attack and physical damage (3–5). The timely production of particular secondary metabolites in response to insect attack benefits plants by decreasing the costs of constitutive metabolite production. Trade-offs between defense metabolite productions and the intrinsic growth-related functions of central metabolic pathways likely provide important selection pressures that maintain the extensive metabolic polymorphisms commonly observed in natural populations.
Gene discovery strategies exploiting natural variation in quantitative traits, including metabolite levels, have been extensively used in combination with genetic approaches (6–12). Analytical approaches applied in this research field are frequently focused on the quantification of individual or small families of compounds. Procedures such as liquid chromatography-mass spectrometry (LC-MS) and NMR have notably been used with both model and crop species to identify the genetic architecture of metabolic traits using quantitative trait locus mapping approaches (reviewed in ref. 13). Such approaches have been very successful in addressing genomic regions responsible for glucosinolate accumulation in Arabidopsis and related species (10, 14–16). Compared with modern sequencing and proteomics technologies, the profiling of entire plant metabolomes is, however, technically unfeasible with the existing analytical platforms, and, as a consequence, the analysis of metabolite natural variation has frequently been biased to secondary metabolite classes, for which a priori knowledge exists regarding their biological function, or to well-mapped parts of primary metabolism associated with energy and growth processes (17–19).
Another critical aspect for exploiting natural variation in metabolism lies in the identification of unknown metabolites that exhibit significant associations with a phenotype of interest. Nontargeted approaches for rapidly collecting repertoires of tandem mass spectrometry (MS/MS) data can be extremely powerful in capturing the metabolic diversity expected to occur in natural populations (20). Indiscriminant or shotgun MS/MS strategies with high-resolution MS detectors offer many advantages in terms of rapidity and scale of analysis. Pipelines have been recently established to analyze such data (20). However, querying MS/MS data from the analysis of secondary metabolites from public databases is frequently unsuccessful because few standards are available for these compounds (21). An alternative is the use of comparative spectral analysis applied to experimental MS/MS datasets (22). This approach, termed molecular networking, is relatively new and aims at creating a map of mass spectral structural space in which molecules with related MS/MS spectra cluster together. Here, we combine the rapidly generated MS/MS data for all mass signals detected and molecular network construction in the analysis of the metabolic composition of natural plant populations.
We applied our MS method to the natural variation in secondary metabolic profiles observed in accessions of the coyote tobacco, Nicotiana attenuata. This annual, native to the Great Basin Desert in the United States, primarily occurs in large ephemeral populations in post-fire habitats and smaller persistent populations found in washes (23). Dormant seeds of this species germinate from long-lived seed banks in sagebrush and pinyon-juniper ecosystems when fires pyrolize the litter layer, removing germination inhibitors and saturating the soils with smoke-derived germination cues (24, 25). This particular germination behavior affects the genetic structure of ephemeral monocultures produced by this species and results in relatively high within-population variation. N. attenuata populations represent a primary food source for insects that colonize the ecosystem after fires, and a vast array of genes and dependent metabolic pathways underlying resistance traits to native herbivores have been functionally characterized in this species. Among the major compound classes that contribute to the antiherbivore defense mechanisms of this plant is nicotine, a neurotoxin that functions synergistically with antidigestive plant proteins (26, 27), phenolic derivatives that exhibit strong tissue-specific responses to insect herbivory (28, 29), and 17-hydroxygeranyllinalool diterpene glycosides (HGL-DTGs) (30).
Several studies have analyzed, with a high degree of spatial and temporal resolution, some of the metabolomic reconfigurations that are activated in plant tissues during biotic stresses (for a review, see ref. 31), including the attack of insects (32–34); but few of these studies have explored qualitative and quantitative variations of these metabolic adjustments across native populations. To systematically explore natural diversity patterns in the metabolic response to Manduca sexta herbivory of different N. attenuata populations, we conducted a glasshouse-based high-throughput MS-based metabolomics approach on 183 plants derived from seeds collected in Utah, Nevada, Arizona, and California. We then optimized an analytical and computational pipeline to assemble MS/MS data collected in a nontargeted manner and established mass spectral maps using a bioinformatics method to visualize metabolic branch-specific natural variation effects and annotate metabolites of interest.
Results and Discussion
N. attenuata Populations Exhibit Highly Variable Herbivory-Induced Metabolic Profiles.
To explore patterns of natural variation existing in the herbivory-induced metabolic profile of wild populations of N. attenuata, we used a rapid ultra HPLC (UHPLC)-electrospray ionization (ESI)/quadrupole TOFMS (qTOFMS) method to measure the metabolomes of methanolic leaf extracts of 183 individual plants derived from seeds from 43 accessions (SI Appendix, Table S1). This analytical procedure allows for the profiling of a broad range of secondary metabolites and their precursors. Seeds used in this experiment had been collected over the last 20 y by Ian T. Baldwin and associates from ephemeral populations growing in postfire habitats in Utah (33 accessions), Nevada (7 accessions), Arizona (2 accessions), and California (1 accession) (Fig. 1A). These natural accessions have defined plants surviving as distinct groups through environmental selection and isolation. Our large-scale experiment also included 13 plants from a Utah (U30) accession self-fertilized for 30 generations in the glasshouse in Jena, Germany and for which extensive knowledge exists regarding the leaf secondary metabolite responses to insect attack. Herbivory by larvae of the specialist lepidopteran M. sexta was simulated by applying freshly collected oral secretions to mechanically wounded leaves (35). This procedure, hereafter referred to as W+OS treatment, elicits, in a highly reproducible manner, major changes in the secondary metabolites of N. attenuata leaves that can be profiled by UHPLC-ESI/qTOFMS (28, 36). After mass feature (m/z signals detected for a specific retention time) extraction, alignment, and retention correction from the overall sample population, the resulting concatenated data matrix (Dataset S1) consisting of 1,044 m/z features (not including isotope peak features) was analyzed using principal component analysis (PCA) statistical modeling to explore the variance structure of across-individual metabolic profiles without categorizations by accession location (SI Appendix, Fig. S1).
Fig. 1.

Herbivory-induced metabolic profiles of N. attenuata populations exhibit extensive intra- and interaccession quantitative variations. (A) The location of the 43 accession seed collection sites in Utah, Nevada, Arizona, and California. A close-up for the collection sites in Utah is presented. Full GPS coordinates are provided in SI Appendix, Table S1. Colors were arbitrarily given to accessions to highlight accessions collected within the same large geographic region. (B) Classification of accession according to intraaccession (x axis) and interaccession (y axis) Euclidean distances calculated for the complete metabolic profile. As expected, metabolomes of replicated plants from U30, a Utah accession inbred for 30 generations, show low variations. Plants from seeds collected in California and Arizona exhibit higher inter- than intraaccession variations. (C) Scatter plots of Euclidean distances calculated individual sample pairs, demonstrating no clear relationship between geographical distance and metabolic profile variations. Each dot represents one sample pair, and its coordinates correspond to the geographic distance (x axis) and Euclidean distance of the metabolic profiles for this sample pair. Closely related individuals exhibit high quantitative metabolic variation when grown under glasshouse conditions, and no correlation is detected between the geographic and Euclidean distances.
Consistent with the high technical reproducibility of UHPLC-ESI/qTOFMS measurements and of the postprocessing pipeline, U30 samples clustered in close proximity in a central region of the score plot generated from these two principal components (PCs) (SI Appendix, Fig. S1). The score plot visualization highlighted that there exists a large dynamic range of variation in the relative metabolic composition of the samples analyzed. Consistent with the high variation for within-population genetic structures previously detected via amplified fragment length polymorphism and microsatellite markers (1, 37), we observed that within-accession metabolic samples were in some cases very dissimilar and often did not cluster together within the PCA plot (see PC scores in Dataset S1). We further analyzed sample variations within and among accessions by calculating the respective intra- and interpopulation Euclidean distances (EDs). The ED was used as a consistent estimator for the “metabolic distance” between the complete processed metabolic profiles of a sample pair (Fig. 1B). In agreement with the high technical reproducibility of our analytical pipeline, replicate plants from the well-characterized U30 accession exhibited relatively low intraaccession variations (EDintraaccession = 29.3). EDintraaccession values for most other accessions showed much greater variations. This trend was particularly clear for the metabolic profiles of accessions collected in Utah because extremely diverse intraaccession metabolic profiles were detected: EDintraaccession ranging from 29.3 to 58.5. The ED scatter plot presented in Fig.1B highlights that, for most accessions, the EDintraaccession was as great as, or even exceeded, variations detected between accessions (EDinteraccession). We additionally compared the geographic distance between accession sites and metabolic profile divergence calculated for all sample pairs from the dataset (EDinterindividual). We found no clear relationship between sample pairs’ geographic and metabolic distances, and important metabolic variations were observed even within closely collected accessions, as indicated by the large dispersion of EDinterindividual values (Fig. 1C).
Coexpression Network Analysis Highlights Pathway- and Metabolite-Specific Natural Variation Effects.
We next analyzed the relative distribution of metabolite levels within the sample set. To describe in a more systematic manner covariation patterns existing among biochemically related metabolites, we computed a coexpression network [Pearson correlation coefficient (PCC) of >0.75] using the complete dataset of mass features—a mass feature being defined as a deconvoluted m/z signal occurring at a given retention time (Fig. 2A). Compound class identifiers, W+OS inducibility (fold change W+OS/control in U30, statistic results reported in Dataset S1), and a natural variation estimator [relative median absolute deviation (MAD)] (Materials and Methods) were mapped onto this network to annotate regions of the network with low and high degrees of natural variation. Connectivities existing between metabolite-derived signals were then interpreted in light of biochemical relationships and their response to the W+OS induction. Panels of Fig. 2A summarize the stepwise process used to pinpointing particular nodes for assessment of their natural variation. The network resolved main natural variation effects within the overall set of detectable mass signals into six main clusters. As discussed in a previous study (38), such groups are formed due to strong and persistent analytical correlations existing between mass signals derived from the ionization and in-source fragmentation of a single metabolite, but also due to the coregulation shared by metabolites of a same metabolic branch. The case of the HGL-DTG compounds is particularly germane because these compounds mapped to two locations of the network. This observation may be explained by the fact that HGL-DTG malonylated forms exhibit different temporal dynamics and mode of regulation compared with upstream metabolites (30). Signals corresponding to unknown metabolites were also found adjacent to, and sometimes within, these main network clusters (see example presented for [M+H]+, m/z 347.19 in Fig. 2A, Lower).
Fig. 2.
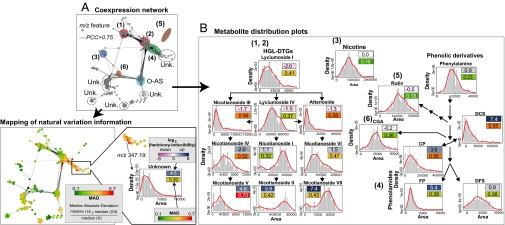
Natural variation affects metabolite inducibility by herbivory at both pathway and single compound scales. (A) Covariance network visualized for metabolite-derived m/z features [Pearson correlation coefficient (PCC) of >0.75, biolayout, based on 1,044 m/z features extracted from 183 samples] obtained by nontargeted postprocessing of N. attenuata accession UHPLC-qTOFMS metabolic profiles indicates pathway-specific and compound-explicit differential inducibility by herbivory and variability through accessions. Different compound classes are annotated using different colored ellipses. Unk., unknown compound class. The resulting network topology was used to map m/z feature-specific natural variation coefficients calculated as relative median absolute distance (relative MAD); the degree of MAD is indicated by the node color from green (low) to red (high). In the MAD formula, Xi represents the ith value across the population for the m/z signal denoted as X. (B) Simplified metabolic schemes and density distribution plots for main intermediates in known secondary metabolic pathways involved in antiherbivore responses in N. attenuata that were extracted from the coexpression network: (diagrams 1 and 2) hydroxygeranyllinalool diterpene glycosides (HGL-DTGs); (diagram 3) nicotine; (diagram 4) phenolamides (CP, N-caffeoylputrescine; DCS, N′,N′′-dicaffeoylspermidine; DFS, N′,N′′-diferuloylspermidine, FP, N-feruloylputrescine); (diagram 5) rutin; (diagram 6) CGA, chlorogenic acid. Distribution histogram plots are overlaid with a density line depict distribution of intensities for known metabolites across the dataset with x axis, area of intensities, and y axis, fitted density with histogram. Nicotine, phenylalanine, rutin, and CGA, which show no to moderate induction by herbivory, exhibit the lowest degree of natural variation in our analysis. Metabolite inducibility is defined as the log2-scaled fold change value between herbivory-induced and control samples of U30 (average fold change from 13 replicates) and is depicted by color boxes ranging from pink (low) to blue (high). The log2-scaled inducibility and relative MAD values are reported in the corresponding boxes. Statistics for log2-scaled fold changes are reported in Dataset S1.
To analyze within-pathway effects in more detail, density distribution plots were generated, and MAD scores were used to directly compare scaled distributions across metabolites within defense metabolism pathways (Fig. 2B). As previously reported, constitutively produced defense metabolites such as nicotine, rutin, and chlorogenic acid exhibit comparatively low degrees of natural variation. Not only is nicotine a direct defense compound effective against attack by leaf herbivores but its occurrence in the nectar also affects pollinator visits and outcrossing rates (37, 39); as such, stronger selection pressures are expected to erode large quantitative variations in nicotine levels. However, recent work has shown that yet to be identified molecular mechanisms generate high variations in nectar nicotine concentrations that surpass variations found in vegetative tissues (37). This previous result suggests that independent mechanisms may control the variability of nicotine concentrations in these two compartments of a plant. In contrast, high quantitative variations were detected for strongly herbivore-responsive secondary metabolites, especially for metabolites of the phenolamide and HGL-DTG pathways (Fig. 2B) as well as O-acyl sugar metabolites (SI Appendix, Fig. S2). This result is consistent with the fact that metabolic variations detected in this glasshouse-based experiment likely recapitulated plasticity effects of the W+OS treatment on genetically determined metabolic variations. Variations attributable to phenotypic plasticity of different genotypes in response to the W+OS elicitation could in theory result from local adaptations to variations in resources and to the presence or absence of enemies or competitors. Results from Fig. 1 do not fully support this interpretation because W+OS-induced metabolite levels are frequently very variable within an accession. It is noteworthy that the smoke-synchronized germination of seed cohorts of different ages has been shown to result into relatively important within-population genetic diversity levels in this species (24, 25). It is therefore likely that the complex genetic structures frequently detected within small populations also contribute to the maintenance of highly heterogeneous W+OS-induced metabolic responses for a given accession/population.
Interestingly, natural distribution curves for biosynthetically linked metabolites were strikingly malleable, varying from normal distributions to skewed or even bimodal distributions. For simplicity, we describe only a few representative examples. Within the HGL-DTG pathway, variations in lyciumoside I and lyciumoside IV, the two upstream precursors intimately connected with the nonmevalonate primary metabolic pathway (30), were relatively low and were distributed according to a normal distribution-like curve. In clear contrast, gradual increases in distribution diversity were seen for the downstream steps of the pathway. Intermediates in the pathway, such as nicotianoside III and attenoside, distributed along skewed curves and exhibited greater MAD scores than their direct precursors. Highest MAD values were observed for the malonylated HGL-DTGs located most downstream in the pathway, with natural variation patterns being best described by bimodal density distributions. This bimodality is indicative of the polymorphic character of herbivory-induced malonylated HGL-DTG levels in the populations analyzed and is reminiscent of distributions for traits under disruptive selection. The same phenomenon appears when navigating through different ramifications of the phenolic metabolic network with most herbivory-inducible phenolamide derivatives exhibiting high natural variation MAD values whereas rutin and chlorogenic acid (CGA) were visualized as low MAD normal distributions.
Natural Variation in Herbivore-Induced Levels of Known and Unknown Metabolites Partly Overlaps with Variations in Jasmonate Accumulation.
The W+OS treatment procedure recapitulates most of the early signaling events activated during M. sexta herbivory, including rapid increases in the levels of jasmonates. Jasmonic acid (JA) and its bioactive form jasmonoyl-isoleucine (JA-Ile) regulate most of the changes in metabolism that underlie direct and indirect plant defenses (40–43). Previous work from our group has shown that W+OS-induced levels of these two jasmonates greatly vary in small N. attenuata populations growing in the wild and translate into different levels of attractiveness and resistance to natural herbivores (44). As revealed by the shape of the density plots (Fig. 3A), JA-Ile displayed greater variations (concentrations ranging from 29.9 to 349.1 ng/g fresh weight) than did JA levels. These large variations may be maintained in natural populations by the counterbalanced effects of JA-Ile–dependent signaling into defense and developmental processes (45). We constructed a correlation map between each of the mass signals and JA and JA-Ile levels for significant PCC values of >0.3 (Fig. 3B). As expected, most of the highly inducible secondary metabolites showed strong correlations with either JA or JA-Ile: phenylalanine is highly correlated to JA-Ile but not JA, and HGL-DTGs mainly show high correlations to JA instead of JA-Ile whereas most phenolamides had high PCC scores for both JA and JA-Ile. Interestingly, many unknown metabolites that may participate in the plant defenses also showed significant PCC values with JA or JA-Ile but not with both, indicating that molecular mechanisms underlying their natural variation may deviate from the canonical view of jasmonate signaling: for example, the metabolite with [M+H]+ at m/z 350.20 shared a PCC of 0.5 with JA and that at m/z 347.19 correlated with JA-Ile with a PCC of 0.38. As previously shown for N. attenuata volatile emissions (46), we concluded from this analysis that natural variations in levels of herbivore-induced metabolites only partly overlap with upstream variations in jasmonate accumulation. This result underscores that complex signaling interactions involving not only jasmonates but also other phytohormones and signals vary across accessions (47). A fundamental aspect of this explorative analysis is that it sheds light on many interesting unknown m/z signals. These mass signals were part of the network clusters capturing high natural diversity effects and covaried in JA or JA-Ile levels.
Fig. 3.

Natural variation in jasmonate levels only partly accounts for polymorphisms in specialized metabolism and highlights unknown metabolites associated with jasmonate signaling. (A) Density distribution plots (x axis, area of intensities and y axis, fitted density with histogram) (123 samples) illustrating natural variation patterns in JA and JA-Ile levels analyzed by targeted LC-MS/MS/MS for leaf samples collected 1 h after simulated herbivory from glasshouse-grown accessions of N. attenuata. (B) Heatmap of pairwise Pearson correlation coefficients (PCCs) (only PCCs of >0.3 are shown based on 123 samples) for significant coregulation patterns between deconvoluted m/z signals and JA and JA-Ile levels. Examples are presented for known and unknown metabolites with significant correlations with either JA or JA-Ile. Boxes denote in-source fragmentation clusters translating from metabolite ionization and fragmentation. An * indicates the position of metabolite-specific precursor ions from which quantitative data used for the scatter plot representations are derived. iso., isomer; RT, retention time in seconds.
Natural Variation Analysis Meets Mass Spectrometry Fragmentation.
We designed a workflow to navigate through the N. attenuata metabolic space of this experiment (SI Appendix, Fig. S3). The workflow is based on shotgun MS/MS data acquisition to collect a holistic repertoire of structural information on the metabolic diversity detected by our analytical platform for this sample set. Shotgun MS/MS indiscriminately considers for fragmentation all signals within an m/z range set as large as possible. Data-dependent MS/MS acquisition methods involving the selection of precursor ions for collision-induced dissociation (CID) fragmentation are more frequently applied, but they suffered from several limitations in capturing the metabolic diversity in a natural variation dataset. First, due to scan rate limitation, only a relatively restricted number of precursor ions can be selected for further CID fragmentation in each acquisition cycle, which reduces the comprehensiveness of the MS/MS analysis. Second, the precursor isolation technique is often inaccurate and frequently translates into “contaminated” MS/MS data, leading to low-resolution performance. As proposed by Matsuda et al. (48), this technical limit can be circumvented by using long repetition series for the measurement of one sample and progressively shifting mass ranges selected for CID fragmentation to obtain as many MS/MS data. However, this approach is extremely time-consuming, and it involves massive data redundancy resulting from iterative acquisition of MS/MS spectra of the same metabolite (20, 49). Shotgun or indiscriminant MS/MS (idMS/MS) analysis, in which every detectable ion is targeted for CID fragmentation, has the main disadvantage of being uninformative about precursor-to-fragment relationships. This method is therefore computationally intensive. However, once these relationships can be assigned confidently within the entirety of a metabolomics dataset, the idMS/MS method is extremely powerful in revealing new structural insights within the entire dataset (20). The concept we propose here of using natural variation patterns for correlation analysis can be extended to all kinds of sample analysis, resulting in sufficient quantitative variations, even for cross-tissue metabolic variation within a single plant. In our workflow (SI Appendix, Fig. S3), we selected 10 samples that captured a large proportion of the quantitative and qualitative diversity within the dataset according to the first six components extracted by PCA. These samples were first analyzed under MS1 profile mode and then for idMS/MS with different collision energies. The stepwise assembly of the idMS/MS for rutin, an abundant flavonoid in Solanaceae, is exemplified in SI Appendix, Fig. S3. The precursor at m/z 611.16 for rutin was correctly annotated by CAMERA (50) as [M+H]+. Briefly, all possible precursor-to-fragment PCC pairs within the retention-dependent compound cluster inferred by deconvolution were separately calculated against the signal at m/z 611.16 under four collision energies. Finally, collision energy-specific idMS/MS spectra were merged into a so-called composite idMS/MS spectrum (SI Appendix, Fig. S3). This pipeline resulted in 360 deconvoluted idMS/MS spectra (Dataset S2). To summarize, this approach benefits from metabolic natural variation by improving the resolution of PCC analysis and simultaneously capturing rich structural information for metabolites with high variation.
A Biclustering Classification of the idMS/MS Landscape Highlights Structural Features Shared by Metabolic Classes.
Most specialized metabolites are taxa-specific and even sometimes species-specific and therefore are not frequently present in public spectral databases that largely include commercially available primary metabolites that are conserved across many organisms. This limitation was clearly verified when querying idMS/MS in Massbank (51) because scores higher than 0.8 were retrieved for only 19% of the idMS/MS (SI Appendix, Fig. S4). Recently, the MS/MS molecular network concept has been developed to circumvent the limitation of spectral databases by the analysis of within-dataset MS/MS similarities to formulate a structural hypothesis for unknown MS/MS (22, 52). In the MS/MS molecular network method used for microbial metabolomics (22), network edges represent similarities between MS/MS spectra based on common fragments calculated using a modified normalized dot product (NDP). These previous studies focused on structurally complex microbial specialized metabolites that produced fragment-rich MS/MS spectra that are suitable for fragment-based MS/MS similarity alignment. Here, many of the small molecules we analyzed produced a limited number of fragments, often less than five fragments. A first unsuccessful attempt for idMS/MS classification using only NDP scores based on fragment similarities can be seen in SI Appendix, Fig. S5. The most prominent clusters formed in this analysis corresponded to the alignment of the multiple pseudo-MS3 idMS/MS collected for single metabolites being prone to in-source fragmentation during ionization, such as HGL-DTGs. Several recent studies have highlighted the importance of considering neutral losses (NLs) for aligning spectra and constructing similarity clusters overlapping with compound familial groupings. NL analysis has been especially well-implemented in the context of MS/MS fragmentation tree studies (53, 54). We therefore combined these two types of information into a bidimensional clustering method.
The weighted gene coexpression analysis (WGCNA) method is a very powerful method for module clustering based on intercorrelations (55) and has been recently extended to the analysis of differential coexpression with the release of the R package DiffCoEx (56). This approach seemed very efficient for the progressive clustering of our 2D data and for highlighting overlapping and nonoverlapping intercorrelations calculated for either of the two MS/MS similarity measures (Fig. 4A). The biclustering by DiffCoEx was conducted on the 360 × 360 NDP similarity (Dataset S2) and 360 × 52 NL similarity score matrices and produced five clustering modules that included 170 idMS/MS spectra. The result of this clustering enables the visualization of relationships between spectrally identical and related metabolites within the measured metabolic landscape (Fig. 4B). We color-mapped known and unknown compounds in each of the modules, as well as the intensity of the PCC value with JA and JA-Ile. We additionally calculated NL overrepresentation for each module by using a chi-square score and depicted NL distribution using a binary heatmap (SI Appendix, Fig. S6). Consistently, high NDP and NL scores—overrepresentation of glucose-derived (P = 1.38 × 10⁻¹⁰), rhamnose-derived (P = 1.07 × 10⁻³³), and malonic acid-derived (P = 4.10 × 10⁻²²) NLs—favored the clustering of HGL-DTGs into one module with high PCC for both JA and JA-Ile. Small clusters in this module corresponded to the different idMS/MS or pseudo-MS3 derived from one single ion, which demonstrates that our clustering method allows for the rapid mining of redundancy in MS/MS spectra data collection (SI Appendix, Fig. S7). Module 4 that was supported by high NL scores grouped phenolamide, chlorogenic acid, rutin, and nicotine, as well as a large set of unknown metabolites. In the case of phenolamides, NLs were essentially derived from putrescine, spermidine losses (SI Appendix, Figs. S5 and S7). Modules 2 and 3 grouped O-acyl sugars defined according to different NL compositions. Module 2 shared significant enrichments with module 3 for hexose and methyl pentanoic NLs (SI Appendix, Fig. S6). These two modules discriminated type III (module 2) and type II and IV (module 3) of O-acyl sugars, which differ by the presence of an acetylated group on the fructose leading to an m/z of 204.65 NL, which consequently was detected only in module 2. The first module contained only unknown metabolites that showed great similarities, with both high NDP and NL similarity scores (SI Appendix, Fig. S8).
Fig. 4.

Biclustering of idMS/MS according to structural relationships computed from fragment and neutral loss similarity metrics facilitate compound class assignments. (A) All-against-all alignment of idMS/MS based on fragment and neutral loss similarity calculation. (B) Biclustering using the R Diffcoex package of idMS/MS according to results of these two similarity analyses identifies five idMS/MS modules (M1, M2, M3, M4, and M5) that partly overlap to a priori knowledge on compound class definition. Green-to-blue gradient denotes medium-to-high fragment similarity whereas that from yellow-to-red indicates medium-to-high neutral loss similarity. Compound annotation is indicated on the left of the heatmap. Black cells correspond to unknown metabolites whereas the different color variations correspond to different compound classes. The next heatmap bar visualizes significant Pearson correlation values with JA and JA-Ile induced levels as detected in Fig. 3. A neutral loss (NL) map in which shared NLs between classified idMS/MS are reported is presented in SI Appendix, Fig. S6. This map was used to infer NLs overrepresented in a particular module. Close views on module subsections highlighting shared NLs and relevant m/z features resulting from fragmentation are reported in SI Appendix, Figs. S7 and S8. CGA, chlorogenic acid; DCS, N′,N′′-dicaffeoylspermidine; iso., isomer; Lyc., lyciumoside; Nicot., nicotianoside; O-AS, O-acyl sugars.
Navigating the idMS/MS Molecular Network Facilitates Structural Predictions for Previously Unassigned Herbivory-Regulated Metabolites.
We finally illustrate how this clustering can be mined to formulate hypotheses on metabolites with interesting natural variation patterns. Clusters within the biclustering classification heatmap can be selected by making use of the aforementioned mapping of natural variation and jasmonate correlation information and then additionally explored for MS/MS pairwise similarities. This reductionist approach avoids dealing with complex MS/MS molecular networks produced from the overall dataset that are too complex to interpret. Here, module 4 was particularly noteworthy because it was enriched in defensive phenolamides but also included, among others, the unknown compound at m/z 347, for which we previously detected an interesting association with jasmonate signaling (Fig. 3B) (28, 57). An additional illustration of the mining of module 1 is presented in SI Appendix, Fig. S5. From module 4, we constructed a molecular network to formulate hypotheses about this unknown metabolite (Fig. 5A) based on the similarity of its idMS/MS with that of known metabolites. For this purpose, we selected all possible NDP and NL similarity-based pairs with a score above 0.6 as network edges and assigned different colors to edges to distinguish NDP and NL connectivities. A subnetwork that contained the idMS/MS for precursor at m/z 347.196 ([M+H]+, C19H27N2O4+) could then be delimited. The idMS/MS for m/z 347 is part of the immediate neighborhood of that of N-caffeoylputrescine and of an unknown with [M+H]+ at m/z 568.30. This clustering translated from shared NL motifs, such as NLs corresponding to putrescine (m/z 88.100) and NH3 (m/z 17.027) and from the presence of a high intensity common fragment corresponding to the cleavage of a caffeic acid moiety from a core molecule (m/z 163.039, C9H7O3+, NDP score of 0.32) (Fig. 5 A and B and SI Appendix, Fig. S9). The NL score between these two metabolites was 0.53. Importantly, an idMS/MS corresponding to the CID-induced cleavage of the fragment at m/z 259.094 (C15H15O4+) had also been assembled. idMS/MS for m/z 259.094 showed that m/z 169.039 and m/z 96.055 (C6H8O) resulted from the cleavage of this fragment at m/z 259.094. This pattern of fragmentation implies that the aromatic ring of the caffeoyl moiety was modified by complexation or acylation with a yet-to-be-determined C6H8O residue.
Fig. 5.
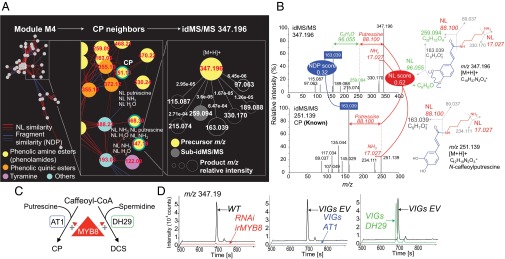
Navigating the idMS/MS similarity network supports structural predictions for novel herbivory-regulated metabolites. (A) Close-up views on the similarity network constructed for module 4 resulting from the biclustering analysis. Module 4 is enriched in previously characterized and structurally elucidated phenolamides, most of which are strongly responsive to simulated herbivory treatments, but also includes unknown metabolites with JA signaling associated natural variation such as m/z 347.19 at retention time 245 s. The composite idMS/MS for m/z 347.19 is the one of the first network neighbors of N-caffeoylputrescine (CP) with idMS/MS m/z 251.13 due to neutral loss and fragment-based similarities. (B) idMS/MS m/z 251.13 and m/z 347.19 share neutral loss corresponding to the loss of putrescine. The intense fragment peak at m/z 163.04 shared by both idMS/MS corresponds to the caffeoyl moiety cleavage from the putrescine. Interestingly, in the case of idMS/MS m/z 347.19, only this fragment derives from an additional neutral loss of C6H8O as part of pseudo-MS3 reaction supported by the alignment of idMS/MS m/z 259.13. (C) Working model for MYB8-regulated N-acyltransferase–mediated production of phenolamides. AT1 catalyzes the formation of putrescine-based phenolamides whereas DH29 acts as a first committed step in spermidine conjugate production. (D) Extracted ion traces for m/z 347.19 supporting its classification as an MYB8-dependent, putrescine-based phenolamide dependent on the catalytic activity of AT1 (SI Appendix, Table S3). Additional results obtained from molecular studies of the metabolic conversion from CP to the phenolamide-related m/z 347.19 are presented in SI Appendix, Fig. S10. EV, empty-vector VIGs control; irMYB8, stably silenced MYB8 transformant; VIGs, virus-induced gene transient silencing.
This molecular network-informed analysis is obviously not directly applicable to de novo unknown compound identification, a task that is traditionally achieved after compound purification and de novo identification by NMR. Additionally, this procedure is inherently limited to subsets of the small molecule metabolome because no single analytical procedure can detect the complete metabolome set of a given sample. Nevertheless, such an approach based on molecular networking has been shown to facilitate the process of formulating structural hypotheses by the combined interpretation of phenotypic information and mass spectrometric signatures (22). The “biological contextualization” of these mass spectrometric signatures allows for hypothesis testing using reverse genetics approaches when sufficient knowledge exists about the genes controlling the biosynthesis of a given group of metabolites (Fig. 5C). In the context of this study, we first used three transgenic lines produced in the U30 background and in which phenolamide metabolism is affected. When stably silencing MYB8 (irMYB8), a transcription factor that controls total phenolamide production (28, 29), both N-caffeoylputrescine and unknown at m/z 347 disappeared from the extract ion current chromatograms (Fig. 5D). However, of the two N-acyltransferases (AT1 and DH29) targeted by MYB8, only the silencing by virus-induced gene silencing (VIGs) of AT1, which specifically targets phenolic-to-putrescine conjugation, disrupted the production of N-caffeoylputrescine and the unknown at m/z 347 (SI Appendix, Table S3). These data, in addition to the strong temporal coregulation upon W+OS treatment of the unknown at m/z 347 and N-caffeoylputrescine (SI Appendix, Fig. S10), provided additional support that this unknown was related to putrescine-based phenolamide metabolism. N-caffeoylputrescine is a prominent defense compound in N. attenuata (29), and understanding the modulations of its metabolism has important physiological implications for the resistance strategies used by wild populations of this plant. As mentioned above, the fragment at m/z 96.055 retrieved in the idMS/MS for m/z 347 corresponded to the mass shift and likely the biochemical transformation between N-caffeoylputrescine and the unknown at m/z 347.196. Because m/z 96.055 was predicted as a C6H8O residue, we hypothesized that this residue was derived from the fatty acid oxylipin cascade, which converts C18 polyunsaturated fatty acids released from biological membranes during stresses into reactive C6 derivatives. The best-characterized products of this pathway are the green leaf volatiles (GLVs). In N. attenuata, stably silencing LIPOXYGENASE2 (irLOX2), which controls the first committed step in this pathway, fully abolishes C6 aldehydes production and thereby total GLV emissions (58) (SI Appendix, Fig. S10). Accumulation of the unknown at m/z 347, but not that of N-caffeoylputrescine, was almost completely impaired in W+OS-treated irLOX2 plants, indicating that LOX2-based fatty acid metabolism was specifically involved in providing the C6H8O residue required for the formation of the unknown at m/z 347. The exact biochemical reaction involved for the formation of this metabolite is not yet elucidated. Our current hypothesis is that 4-hydroxyhexenal (SI Appendix, Fig. S10), one of the most reactive aldehydes produced by this pathway and therefore a pivotal actor in lipid peroxidation-mediated oxidative stress, reacts with N-caffeoylputrescine to form the unknown at m/z 347. It is unknown yet whether this interaction between C6 metabolism and N-caffeoylputrescine benefits the plant by scavenging an excess of highly reactive aldehydes or has homeostatic function over N-caffeoylputrescine levels, and/or whether it increases the toxicity of this latter metabolite for herbivores. Additional work, using the panoply of reverse genetic and natural variation resources reported in this study, is needed to investigate chemical and physiological aspects of this intriguing reaction in the context of the plant defense response to highly specialized insect herbivores.
Conclusion
Although heterogeneity in the levels of certain plant metabolites has been analyzed in the context of quantitative genetics approaches to elucidate gene function, little is known about how these variations are organized at the chemical level. There is, therefore, a clear need for workflows that combine biological information and MS data. Ideally, such workflows should comprehensively capture quantitative and structural information on as many detectable metabolites as possible (“metabolic space”) and generate data-rich visual outputs to facilitate hypothesis formulation. Here, we implement a workflow fulfilling these requirements and demonstrate that N. attenuata populations exhibit large quantitative polymorphisms affecting secondary metabolism on a single compound but also on a pathway basis. Certain of these variations overlap with variations detected in herbivory-induced levels of JA and JA-Ile.
The coordinated set of information organized by our approach facilitates the mining of known and unknown metabolites, and virtually any kind of biological information (in the present study, natural variation) can be mapped onto MS/MS molecular networks. In this respect, our study complements previous work on molecular networks (22) and exemplifies how these networks can be efficiently mined to formulate structural hypotheses on previously noncharacterized compounds associated with a given phenotype. By combining this structural approach with gene manipulation studies, we notably pinpoint on a biochemical interaction between so-called “direct” (phenolamide metabolism) and “indirect” (C6 metabolism being known to serve for natural enemies’ recruitment) metabolism-based defense strategies. The physiological implications of such metabolic cross-talk for a plant’s defense response have not yet been explored. To summarize, we predict that the workflow described here will provide some of the essential requirements for a more efficient exploration of the abundant (but not exhaustive) structural information that lies unexplored from most conventional metabolomics screening efforts.
Materials and Methods
Seed Sources.
Seeds from N. attenuata Torrey ex Watson were collected over the last 20 y by Ian T. Baldwin and his collaborators in the Southwestern United States (SI Appendix, Table S1) and were germinated as described in ref. 59. The well-characterized inbred line “UT,” which we used as a control comparison, was collected from southwestern Utah in 1996 (population U in ref. 60) and has been self-fertilized for 30 generations in glasshouse conditions in Jena, Germany.
Plant Treatment and Sample Preparation.
Metabolic changes induced during M. sexta feeding were elicited in a highly synchronized fashion by producing, with a fabric pattern wheel, three rows of punctures onto each side of the midvein of five fully expanded leaves per plant at rosette stage and immediately applying 1:1 diluted M. sexta oral secretions (OSs) to the puncture wounds. Four treated leaves were harvested, pooled, and flash-frozen 72 h after elicitation, and metabolites were extracted (SI Appendix, Materials and Methods). One treated leaf per plant was harvested 1 h after treatment and analyzed for jasmonates as described in ref. 61.
UHPLC-ESI/TOF-MS Profile Mode Analysis.
Two microliters of the 40% methanol leaf extracts were separated using a Dionex rapid separation liquid chromatography system (Dionex) as previously described in ref. 36 (SI Appendix, Materials and Methods).
UHPLC-ESI/qTOF-MS Conditions for Indiscriminant MS/MS Data Acquisition.
Indiscriminant MS/MS fragmentation analysis (hereafter referred to as idMS/MS) was conducted to gain structural information on the overall metabolic profile detected by UHPLC-TOFMS (SI Appendix, Materials and Methods). To increase the chromatographic resolution compared with the conditions previously used for the initial high-throughput analysis of the overall population in the profile mode, we used the following UHPLC binary gradient conditions: 0–1 min, isocratic 90% (vol/vol) A (de-ionized water, 0.1% acetonitrile, and 0.05% formic acid), 10% B (acetonitrile and 0.05% formic acid); 1–22 min, gradient phase to reach 20% A, 80% B; 22–25 min, isocratic 20% A, 80% B. The indiscriminant MS/MS dataset has been deposited in the open metabolomics database Metabolights (www.ebi.ac.uk/metabolights) under accession no. MTBLS203.
Assembly of Compound-Specific idMS/MS.
We used the precursor-to-product assignment pipeline developed by ref. 20 and implemented additional rules to improve the accuracy of precursor and product mass signal definition. To reduce the computational and analytical demand, we selected 10 samples from the dataset that capture a great proportion of the variance in the sample population based on manual inspection of chromatograms and on their scores on the six first PCs from the PCA analysis. idMS/MS assembly was achieved via correlational analysis between MS1 and idMS/MS mass signals for low and high collision energy (20) and involved well newly implemented rules (SI Appendix, Materials and Methods).
Coexpression Network Construction and Statistical Analysis of Natural Variation Effects.
The intradistance for each location was calculated by the average of Euclidean distance crosswise samples within each location, and interdistance for each location was calculated by first computing the average of samples in each location and then computing the average Euclidean distance of all of the other locations calculated with this location in Fig. 1C. Euclidean distance in Fig. 1D was calculated for each sample pair. The geographic distance was inferred from the Global Positioning System (GPS) coordinates of samples using the great-circle distance algorithm. The degree of variation of each mass feature of the dataset was estimated using the relative median absolute distance calculated as follows:
with Xi being ith value across the population for the m/z signal denoted as X.
Coexpression calculations for network construction were computed using the Cytoscape plugin MetaNetter (v2.1) (62, 63).
Pairwise idMS/MS Alignment Based on Fragment Similarity.
A standard normalized dot product (NDP), also referred to as cosine correlation method for spectral comparison, was applied using the following equation:
where S1 and S2 correspond, respectively, to spectrum 1 and spectrum 2 and and indicate peak intensity-based weights given to ith common peaks differing by less than 0.01 Da between the two spectra. Weights were calculated as follows:
with m = 0.5 and n = 2, as suggested by MassBank.
Pairwise idMS/MS Alignment Based on Common Neutral Losses.
The NL-based similarity between individual idMS/MS was implemented as described in SI Appendix, Materials and Methods. We used a list of 52 neutral losses (NLs) commonly encountered during tandem MS fragmentation (SI Appendix, Table S2), as well as more specific ones that had been previously annotated for MS/MS spectra of N. attenuata secondary metabolite classes.
idMS/MS Molecular Networking by Biclustering.
A comparative correlation heat map of 360 idMS/MS spectra was constructed using DiffCoEx (56). The parameters of “cutreeDynamic” were set to cutHeight = 0.999, deepSplit = 1, minClusterSize = 10. The R source code of DiffCoEx was downloaded from additional file 1 in ref. 56, and the required R WGCNA package can be found at labs.genetics.ucla.edu/horvath/htdocs/CoexpressionNetwork/Rpackages/WGCNA/.
Supplementary Material
Acknowledgments
We thank Mathias Schöttner for technical support in establishing the idMS/MS acquisition method, Sven Heiling for inspiring discussions, Mario Kallenbach for sharing jasmonate data, and members of the Department of Molecular Ecology for help with sample harvesting. D.L., E.G., and I.T.B. are funded by the Max Planck Society and by Advanced Grant 293926 of the European Research Council (to I.T.B.). E.G.'s research in Heidelberg is supported within the framework of the Deutsche Forschungsgemeinschaft Excellence Initiative to the University of Heidelberg.
Footnotes
The authors declare no conflict of interest.
This article is a PNAS Direct Submission.
Data deposition: The MS/MS dataset has been deposited in the open metabolomics database Metabolights, www.ebi.ac.uk/metabolights (accession no. MTBLS203).
This article contains supporting information online at www.pnas.org/lookup/suppl/doi:10.1073/pnas.1503106112/-/DCSupplemental.
References
- 1.Xiao Q, et al. Sources of variability in metabolite measurements from urinary samples. PLoS ONE. 2014;9(5):e95749. doi: 10.1371/journal.pone.0095749. [DOI] [PMC free article] [PubMed] [Google Scholar]
- 2.Weng JK. The evolutionary paths towards complexity: A metabolic perspective. New Phytol. 2014;201(4):1141–1149. doi: 10.1111/nph.12416. [DOI] [PubMed] [Google Scholar]
- 3.Agrawal AA, Hastings AP, Johnson MT, Maron JL, Salminen JP. Insect herbivores drive real-time ecological and evolutionary change in plant populations. Science. 2012;338(6103):113–116. doi: 10.1126/science.1225977. [DOI] [PubMed] [Google Scholar]
- 4.Berenbaum MR, Zangerl AR. Facing the future of plant-insect interaction research: Le retour à la “raison d’être”. Plant Physiol. 2008;146(3):804–811. doi: 10.1104/pp.107.113472. [DOI] [PMC free article] [PubMed] [Google Scholar]
- 5.Prasad KV, et al. A gain-of-function polymorphism controlling complex traits and fitness in nature. Science. 2012;337(6098):1081–1084. doi: 10.1126/science.1221636. [DOI] [PMC free article] [PubMed] [Google Scholar]
- 6.Johal GS, Balint-Kurti P, Weil CF. Mining and harnessing natural variation: A little MAGIC. Crop Sci. 2008;48(6):2066–2073. [Google Scholar]
- 7.Toubiana D, et al. Metabolic profiling of a mapping population exposes new insights in the regulation of seed metabolism and seed, fruit, and plant relations. PLoS Genet. 2012;8(3):e1002612. doi: 10.1371/journal.pgen.1002612. [DOI] [PMC free article] [PubMed] [Google Scholar]
- 8.Chan EK, Rowe HC, Hansen BG, Kliebenstein DJ. The complex genetic architecture of the metabolome. PLoS Genet. 2010;6(11):e1001198. doi: 10.1371/journal.pgen.1001198. [DOI] [PMC free article] [PubMed] [Google Scholar]
- 9.Chan EK, Rowe HC, Kliebenstein DJ. Understanding the evolution of defense metabolites in Arabidopsis thaliana using genome-wide association mapping. Genetics. 2010;185(3):991–1007. doi: 10.1534/genetics.109.108522. [DOI] [PMC free article] [PubMed] [Google Scholar]
- 10.Chan EK, Rowe HC, Corwin JA, Joseph B, Kliebenstein DJ. Combining genome-wide association mapping and transcriptional networks to identify novel genes controlling glucosinolates in Arabidopsis thaliana. PLoS Biol. 2011;9(8):e1001125. doi: 10.1371/journal.pbio.1001125. [DOI] [PMC free article] [PubMed] [Google Scholar]
- 11.Keurentjes JJ, et al. The genetics of plant metabolism. Nat Genet. 2006;38(7):842–849. doi: 10.1038/ng1815. [DOI] [PubMed] [Google Scholar]
- 12.Riedelsheimer C, et al. Genome-wide association mapping of leaf metabolic profiles for dissecting complex traits in maize. Proc Natl Acad Sci USA. 2012;109(23):8872–8877. doi: 10.1073/pnas.1120813109. [DOI] [PMC free article] [PubMed] [Google Scholar]
- 13.Carreno-Quintero N, Bouwmeester HJ, Keurentjes JJ. Genetic analysis of metabolome-phenotype interactions: From model to crop species. Trends Genet. 2013;29(1):41–50. doi: 10.1016/j.tig.2012.09.006. [DOI] [PubMed] [Google Scholar]
- 14.Mitchell-Olds T, Pedersen D. The molecular basis of quantitative genetic variation in central and secondary metabolism in Arabidopsis. Genetics. 1998;149(2):739–747. doi: 10.1093/genetics/149.2.739. [DOI] [PMC free article] [PubMed] [Google Scholar]
- 15.Kliebenstein DJ, et al. Genetic control of natural variation in Arabidopsis glucosinolate accumulation. Plant Physiol. 2001;126(2):811–825. doi: 10.1104/pp.126.2.811. [DOI] [PMC free article] [PubMed] [Google Scholar]
- 16.Kliebenstein DJ, Gershenzon J, Mitchell-Olds T. Comparative quantitative trait loci mapping of aliphatic, indolic and benzylic glucosinolate production in Arabidopsis thaliana leaves and seeds. Genetics. 2001;159(1):359–370. doi: 10.1093/genetics/159.1.359. [DOI] [PMC free article] [PubMed] [Google Scholar]
- 17.Keurentjes JJ, Sulpice R. The role of natural variation in dissecting genetic regulation of primary metabolism. Plant Signal Behav. 2009;4(3):244–246. doi: 10.4161/psb.4.3.7956. [DOI] [PMC free article] [PubMed] [Google Scholar]
- 18.Keurentjes JJ, et al. Integrative analyses of genetic variation in enzyme activities of primary carbohydrate metabolism reveal distinct modes of regulation in Arabidopsis thaliana. Genome Biol. 2008;9(8):R129. doi: 10.1186/gb-2008-9-8-r129. [DOI] [PMC free article] [PubMed] [Google Scholar]
- 19.Carreno-Quintero N, et al. Untargeted metabolic quantitative trait loci analyses reveal a relationship between primary metabolism and potato tuber quality. Plant Physiol. 2012;158(3):1306–1318. doi: 10.1104/pp.111.188441. [DOI] [PMC free article] [PubMed] [Google Scholar]
- 20.Broeckling CD, Heuberger AL, Prince JA, Ingelsson E, Prenni JE. Assigning precursor-product ion relationships in indiscriminant MS/MS data from non-targeted metabolite profiling studies. Metabolomics. 2013;9(1):33–43. [Google Scholar]
- 21.Neumann S, Böcker S. Computational mass spectrometry for metabolomics: Identification of metabolites and small molecules. Anal Bioanal Chem. 2010;398(7-8):2779–2788. doi: 10.1007/s00216-010-4142-5. [DOI] [PubMed] [Google Scholar]
- 22.Watrous J, et al. Mass spectral molecular networking of living microbial colonies. Proc Natl Acad Sci USA. 2012;109(26):E1743–E1752. doi: 10.1073/pnas.1203689109. [DOI] [PMC free article] [PubMed] [Google Scholar]
- 23.Bahulikar RA, Stanculescu D, Preston CA, Baldwin IT. ISSR and AFLP analysis of the temporal and spatial population structure of the post-fire annual, Nicotiana attenuata, in SW Utah. BMC Ecol. 2004;4:12. doi: 10.1186/1472-6785-4-12. [DOI] [PMC free article] [PubMed] [Google Scholar]
- 24.Baldwin IT, Morse L. Up in smoke: II. Germination of Nicotiana attenuata in response to smoke-derived cues and nutrients in burned and unburned soils. J Chem Ecol. 1994;20(9):2373–2391. doi: 10.1007/BF02033208. [DOI] [PubMed] [Google Scholar]
- 25.Baldwin IT, Staszak-Kozinski L, Davidson R. Up in smoke: I. Smoke-derived germination cues for postfire annual, Nicotiana attenuata torr. Ex. Watson. J Chem Ecol. 1994;20(9):2345–2371. doi: 10.1007/BF02033207. [DOI] [PubMed] [Google Scholar]
- 26.Steppuhn A, Gase K, Krock B, Halitschke R, Baldwin IT. Nicotine’s defensive function in nature. PLoS Biol. 2004;2(8):E217. doi: 10.1371/journal.pbio.0020217. [DOI] [PMC free article] [PubMed] [Google Scholar]
- 27.Steppuhn A, Baldwin IT. Resistance management in a native plant: Nicotine prevents herbivores from compensating for plant protease inhibitors. Ecol Lett. 2007;10(6):499–511. doi: 10.1111/j.1461-0248.2007.01045.x. [DOI] [PubMed] [Google Scholar]
- 28.Onkokesung N, et al. MYB8 controls inducible phenolamide levels by activating three novel hydroxycinnamoyl-coenzyme A:polyamine transferases in Nicotiana attenuata. Plant Physiol. 2012;158(1):389–407. doi: 10.1104/pp.111.187229. [DOI] [PMC free article] [PubMed] [Google Scholar]
- 29.Kaur H, Heinzel N, Schöttner M, Baldwin IT, Gális I. R2R3-NaMYB8 regulates the accumulation of phenylpropanoid-polyamine conjugates, which are essential for local and systemic defense against insect herbivores in Nicotiana attenuata. Plant Physiol. 2010;152(3):1731–1747. doi: 10.1104/pp.109.151738. [DOI] [PMC free article] [PubMed] [Google Scholar]
- 30.Heiling S, et al. Jasmonate and ppHsystemin regulate key malonylation steps in the biosynthesis of 17-hydroxygeranyllinalool diterpene glycosides, an abundant and effective direct defense against herbivores in Nicotiana attenuata. Plant Cell. 2010;22(1):273–292. doi: 10.1105/tpc.109.071449. [DOI] [PMC free article] [PubMed] [Google Scholar]
- 31.Macel M, Van Dam NM, Keurentjes JJB. Metabolomics: The chemistry between ecology and genetics. Mol Ecol Resour. 2010;10(4):583–593. doi: 10.1111/j.1755-0998.2010.02854.x. [DOI] [PubMed] [Google Scholar]
- 32.Gulati J, Kim SG, Baldwin IT, Gaquerel E. Deciphering herbivory-induced gene-to-metabolite dynamics in Nicotiana attenuata tissues using a multifactorial approach. Plant Physiol. 2013;162(2):1042–1059. doi: 10.1104/pp.113.217588. [DOI] [PMC free article] [PubMed] [Google Scholar]
- 33.Jansen JJ, et al. Metabolomic analysis of the interaction between plants and herbivores. Metabolomics. 2009;5(1):150–161. [Google Scholar]
- 34.Marti G, et al. Metabolomics reveals herbivore-induced metabolites of resistance and susceptibility in maize leaves and roots. Plant Cell Environ. 2013;36(3):621–639. doi: 10.1111/pce.12002. [DOI] [PubMed] [Google Scholar]
- 35.McCloud ES, Baldwin IT. Herbivory and caterpillar regurgitants amplify the wound-induced increases in jasmonic acid but not nicotine in Nicotiana sylvestris. Planta. 1997;203(4):430–435. [Google Scholar]
- 36.Gaquerel E, Heiling S, Schoettner M, Zurek G, Baldwin IT. Development and validation of a liquid chromatography-electrospray ionization-time-of-flight mass spectrometry method for induced changes in Nicotiana attenuata leaves during simulated herbivory. J Agric Food Chem. 2010;58(17):9418–9427. doi: 10.1021/jf1017737. [DOI] [PubMed] [Google Scholar]
- 37.Kessler D, et al. Unpredictability of nectar nicotine promotes outcrossing by hummingbirds in Nicotiana attenuata. Plant J. 2012;71(4):529–538. doi: 10.1111/j.1365-313X.2012.05008.x. [DOI] [PubMed] [Google Scholar]
- 38.Gaquerel E, Kuhl C, Neumann S. Computational annotation of plant metabolomics profiles via a novel network-assisted approach. Metabolomics. 2013;9(4):904–918. [Google Scholar]
- 39.Kessler D, Gase K, Baldwin IT. Field experiments with transformed plants reveal the sense of floral scents. Science. 2008;321(5893):1200–1202. doi: 10.1126/science.1160072. [DOI] [PubMed] [Google Scholar]
- 40.Woldemariam MG, Onkokesung N, Baldwin IT, Galis I. Jasmonoyl-L-isoleucine hydrolase 1 (JIH1) regulates jasmonoyl-L-isoleucine levels and attenuates plant defenses against herbivores. Plant J. 2012;72(5):758–767. doi: 10.1111/j.1365-313X.2012.05117.x. [DOI] [PubMed] [Google Scholar]
- 41.Stitz M, Baldwin IT, Gaquerel E. Diverting the flux of the JA pathway in Nicotiana attenuata compromises the plant’s defense metabolism and fitness in nature and glasshouse. PLoS ONE. 2011;6(10):e25925. doi: 10.1371/journal.pone.0025925. [DOI] [PMC free article] [PubMed] [Google Scholar]
- 42.Kessler A, Baldwin IT. Defensive function of herbivore-induced plant volatile emissions in nature. Science. 2001;291(5511):2141–2144. doi: 10.1126/science.291.5511.2141. [DOI] [PubMed] [Google Scholar]
- 43.Paschold A, Halitschke R, Baldwin IT. Co(i)-ordinating defenses: NaCOI1 mediates herbivore- induced resistance in Nicotiana attenuata and reveals the role of herbivore movement in avoiding defenses. Plant J. 2007;51(1):79–91. doi: 10.1111/j.1365-313X.2007.03119.x. [DOI] [PubMed] [Google Scholar]
- 44.Kallenbach M, Bonaventure G, Gilardoni PA, Wissgott A, Baldwin IT. Empoasca leafhoppers attack wild tobacco plants in a jasmonate-dependent manner and identify jasmonate mutants in natural populations. Proc Natl Acad Sci USA. 2012;109(24):E1548–E1557. doi: 10.1073/pnas.1200363109. [DOI] [PMC free article] [PubMed] [Google Scholar]
- 45.Baldwin IT. Jasmonate-induced responses are costly but benefit plants under attack in native populations. Proc Natl Acad Sci USA. 1998;95(14):8113–8118. doi: 10.1073/pnas.95.14.8113. [DOI] [PMC free article] [PubMed] [Google Scholar]
- 46.Schuman MC, Heinzel N, Gaquerel E, Svatos A, Baldwin IT. Polymorphism in jasmonate signaling partially accounts for the variety of volatiles produced by Nicotiana attenuata plants in a native population. New Phytol. 2009;183(4):1134–1148. doi: 10.1111/j.1469-8137.2009.02894.x. [DOI] [PubMed] [Google Scholar]
- 47.Wu J, Hettenhausen C, Schuman MC, Baldwin IT. A comparison of two Nicotiana attenuata accessions reveals large differences in signaling induced by oral secretions of the specialist herbivore Manduca sexta. Plant Physiol. 2008;146(3):927–939. doi: 10.1104/pp.107.114785. [DOI] [PMC free article] [PubMed] [Google Scholar]
- 48.Matsuda F, et al. MS/MS spectral tag-based annotation of non-targeted profile of plant secondary metabolites. Plant J. 2009;57(3):555–577. doi: 10.1111/j.1365-313X.2008.03705.x. [DOI] [PMC free article] [PubMed] [Google Scholar]
- 49.Hoopmann MR, Finney GL, MacCoss MJ. High-speed data reduction, feature detection, and MS/MS spectrum quality assessment of shotgun proteomics data sets using high-resolution mass spectrometry. Anal Chem. 2007;79(15):5620–5632. doi: 10.1021/ac0700833. [DOI] [PMC free article] [PubMed] [Google Scholar]
- 50.Kuhl C, Tautenhahn R, Böttcher C, Larson TR, Neumann S. CAMERA: An integrated strategy for compound spectra extraction and annotation of liquid chromatography/mass spectrometry data sets. Anal Chem. 2012;84(1):283–289. doi: 10.1021/ac202450g. [DOI] [PMC free article] [PubMed] [Google Scholar]
- 51.Horai H, et al. MassBank: A public repository for sharing mass spectral data for life sciences. J Mass Spectrom. 2010;45(7):703–714. doi: 10.1002/jms.1777. [DOI] [PubMed] [Google Scholar]
- 52.Yang JY, et al. Molecular networking as a dereplication strategy. J Nat Prod. 2013;76(9):1686–1699. doi: 10.1021/np400413s. [DOI] [PMC free article] [PubMed] [Google Scholar]
- 53.Rasche F, et al. Identifying the unknowns by aligning fragmentation trees. Anal Chem. 2012;84(7):3417–3426. doi: 10.1021/ac300304u. [DOI] [PubMed] [Google Scholar]
- 54.Rasche F, Svatos A, Maddula RK, Böttcher C, Böcker S. Computing fragmentation trees from tandem mass spectrometry data. Anal Chem. 2011;83(4):1243–1251. doi: 10.1021/ac101825k. [DOI] [PubMed] [Google Scholar]
- 55.Langfelder P, Horvath S. WGCNA: An R package for weighted correlation network analysis. BMC Bioinformatics. 2008;9:559. doi: 10.1186/1471-2105-9-559. [DOI] [PMC free article] [PubMed] [Google Scholar]
- 56.Tesson BM, Breitling R, Jansen RC. DiffCoEx: A simple and sensitive method to find differentially coexpressed gene modules. BMC Bioinformatics. 2010;11:497. doi: 10.1186/1471-2105-11-497. [DOI] [PMC free article] [PubMed] [Google Scholar]
- 57.Gaquerel E, Gulati J, Baldwin IT. Revealing insect herbivory-induced phenolamide metabolism: From single genes to metabolic network plasticity analysis. Plant J. 2014;79(4):679–692. doi: 10.1111/tpj.12503. [DOI] [PMC free article] [PubMed] [Google Scholar]
- 58.Allmann S, Halitschke R, Schuurink RC, Baldwin IT. Oxylipin channelling in Nicotiana attenuata: Lipoxygenase 2 supplies substrates for green leaf volatile production. Plant Cell Environ. 2010;33(12):2028–2040. doi: 10.1111/j.1365-3040.2010.02203.x. [DOI] [PubMed] [Google Scholar]
- 59.Krügel T, Lim M, Gase K, Halitschke R, Baldwin IT. Agrobacterium-mediated transformation of Nicotiana attenuata, a model ecological expression system. Chemoecology. 2002;12(4):177–183. [Google Scholar]
- 60.Glawe GA, Zavala JA, Kessler A, Van Dam NM, Baldwin IT. Ecological costs and benefits correlated with trypsin protease inhibitor production in Nicotiana attenuata. Ecology. 2003;84(1):79–90. [Google Scholar]
- 61.Stitz M, Gase K, Baldwin IT, Gaquerel E. Ectopic expression of AtJMT in Nicotiana attenuata: Creating a metabolic sink has tissue-specific consequences for the jasmonate metabolic network and silences downstream gene expression. Plant Physiol. 2011;157(1):341–354. doi: 10.1104/pp.111.178582. [DOI] [PMC free article] [PubMed] [Google Scholar]
- 62.Jourdan F, Breitling R, Barrett MP, Gilbert D. MetaNetter: Inference and visualization of high-resolution metabolomic networks. Bioinformatics. 2008;24(1):143–145. doi: 10.1093/bioinformatics/btm536. [DOI] [PubMed] [Google Scholar]
- 63.Shannon P, et al. Cytoscape: A software environment for integrated models of biomolecular interaction networks. Genome Res. 2003;13(11):2498–2504. doi: 10.1101/gr.1239303. [DOI] [PMC free article] [PubMed] [Google Scholar]
Associated Data
This section collects any data citations, data availability statements, or supplementary materials included in this article.