

Significance
Human cytomegalovirus (HCMV) is the leading cause of birth defects associated with infections and a leading cause of transplantation failure. This study reveals the patterns and limits of HCMV genomic diversity by performing a large-scale analysis of HCMV sequences sampled from human hosts, identifying the hot and cold spots of variability. We find that the diversity is unevenly distributed across three host compartments and show that HCMV populations of vascular compartments are genetically constrained while enriched for polymorphisms of glycoproteins and regulatory proteins. This work significantly advances our understanding of the genomic diversity of HCMV in humans and has clear implications for the development of therapeutics against HCMV.
Keywords: human cytomegalovirus, HCMV, congenital CMV, virology, evolution
Abstract
Human cytomegalovirus (HCMV) exhibits surprisingly high genomic diversity during natural infection although little is known about the limits or patterns of HCMV diversity among humans. To address this deficiency, we analyzed genomic diversity among congenitally infected infants. We show that there is an upper limit to HCMV genomic diversity in these patient samples, with ∼25% of the genome being devoid of polymorphisms. These low diversity regions were distributed across 26 loci that were preferentially located in DNA-processing genes. Furthermore, by developing, to our knowledge, the first genome-wide mutation and recombination rate maps for HCMV, we show that genomic diversity is positively correlated with these two rates. In contrast, median levels of viral genomic diversity did not vary between putatively single or mixed strain infections. We also provide evidence that HCMV populations isolated from vascular compartments of hosts from different continents are genetically similar and that polymorphisms in glycoproteins and regulatory proteins are enriched in these viral populations. This analysis provides the most highly detailed map of HCMV genomic diversity in human hosts to date and informs our understanding of the distribution of HCMV genomic diversity within human hosts.
Human cytomegalovirus (HCMV) is a pathogen of critical importance to human health. HCMV is the leading cause of birth defects related to an infectious agent (1, 2) and a primary cause of solid organ transplant failure (3). Prevention and clinical interventions for HCMV disease are limited by the absence of an effective vaccine, as well as resistance to antiviral drugs (4) and therapeutic neutralizing antibodies (5).
Recently, it has been proposed that HCMV disease and pathogenesis may be related to the genetic diversity of the virus (6), which is exceptionally high both within and between hosts (7–11). The viral interhost diversity was first described through restriction fragment length polymorphism analysis (12) and was subsequently confirmed with targeted gene and genome-wide sequencing (7, 8, 13). In a similar manner, HCMV intrahost diversity has been described using genetic and genomic sequencing (10, 11, 14–17) and has been shown to be comparable with diversity observed in RNA viruses, the benchmark of variable populations (10). HCMV thus exists within hosts as a heterogeneous collection of diverse but related genomes, herein termed a population, rather than a single sequence. The high levels of intrahost genetic diversity in HCMV infections are seen across a range of human hosts, from healthy adults (14) and children (18) to congenitally infected infants (19), transplant recipients (17), and AIDS patients (20). The clinical importance of HCMV genetic diversity is still debated (21), but increasing evidence suggests a correlation with HCMV pathogenesis. For example, higher viral loads are associated with diverse HCMV infections (22, 23), as is disease progression for both HCMV disease (15) and AIDS patients (24). HCMV is capable of infecting a wide range of host organs and cell types, and in vivo infection leads to widespread viral dissemination. Multiple reports show that HCMV genotypes and total levels of diversity differ between host organs, a phenomenon referred to as compartmentalization (11, 19, 25, 26). More recently, whole genome sequencing showed that HCMV populations sampled from different compartments can be as divergent as sequences sampled from unrelated hosts (11). Tentative links between diversity in viral glycoproteins and dissemination are beginning to form. For example, genetic variation in the gO locus alters the ratio of the gH/gL/UL128-131 and gH/gL/gO complexes and is proposed to influence endothelial and fibroblast cell tropism and dissemination (27). Likewise, various gB (UL55) genotypes are preferentially associated with host compartments, suggesting a role for gB variation in tropism (28). Lastly, positive selection targets glycoproteins during viral dissemination from plasma to urine (11), suggesting a link between variable viral genetics and fitness in different host compartments.
This previous work (8, 10) has demonstrated that HCMV is genetically diverse within and among human hosts. It has been speculated that this genetic diversity may contribute to pathogenesis, possibly due to effects on immune evasion or dissemination (6). However, HCMV diversity has not been fully characterized, thereby hindering more complex analyses of the possible relationship between viral diversity and disease. For example, it is not clear whether the diversity is evenly distributed across the genome or which factors alter its genome-wide patterns. Moreover, analysis of the spatiotemporal distribution of HCMV diversity has been used to study the contribution of neutral and selective evolutionary mechanisms affecting HCMV populations during dissemination (11), but the analysis requires study across a larger patient cohort.
To begin to address these issues, we have initiated, to our knowledge, the first large-scale analysis of HCMV intra- and interhost genomic diversity across a range of unrelated and geographically disperse human hosts. We here focus on congenitally infected infants because HCMV genomic diversity has been quantitatively described in these hosts. Through our analyses, we confirm the high levels of intra- and interhost genomic diversity of HCMV but also show that roughly one-quarter of the HCMV genome is monomorphic and seems selectively constrained. Furthermore, we identify hot and cold spots of diversity, which may partially be explained by selection on known protein function, and variations in genome-wide mutation and recombination rates. Lastly, we provide further evidence of the differences in diversity between host compartments, showing that plasma populations among unrelated and geographically separated hosts are genetically alike and that polymorphisms within glycoproteins are enriched in these populations. These analyses provide the most detailed description to date of the patterns and limits of HCMV genomic diversity in human hosts.
Results
Estimation of Overall Diversity and Conservation of the HCMV Genome.
We performed an analysis of 48 HCMV-positive samples, 30 of which have not been described previously, collected from 18 patients (Table S1). Forty-seven of the 48 samples were collected from infants with congenital CMV infection, and 1 sample was collected from an adult with glioblastoma multiforme (GBM). The GBM sample has been described previously (16) and was included to serve as an outlier to compare with the remaining samples. The dataset encompasses over 41 gigabases of HCMV sequence (Table 1). The median viral genomic coverage was 89.5%, and the median sequencing depth was 2,175 (Table 1). In total, ∼860,000 single nucleotide polymorphisms (SNPs) were identified, and ∼154,000 sites across the HCMV genome were polymorphic in one or more samples in the dataset. When plotted as a function of samples or patients analyzed, the number of polymorphic sites seems to be asymptotic. Saturation curves were fitted to these data (r2 = 0.9951 for Fig. 1A, and r2 = 0.9996 for Fig. 1B), and a parameter of this curve Lmax, representing the theoretical maximal number of (nonerroneous) polymorphic sites in the genome, was defined. With these data, Lmax was calculated to be 161,646 (95% confidence interval, 159,019–164,273) for samples (Fig. 1A) and 155,874 (95% confidence interval, 154,101–157,647) for patients (Fig. 1B). These data suggest that a significant fraction of the HCMV genome is conserved across patients.
Table S1.
Patient information for HCMV samples analyzed
| Patient | Location | Sample | Type | Age at time of collection | Ref. or sequence data accession no. |
| B101 | Massachusetts, USA | B101C | Urine | 7 mo | (11) |
| B101D | Urine | 10 mo | (11) | ||
| B103 | Massachusetts, USA | B103A | Plasma | 1 wk | (11) |
| B103B | Plasma | 6 mo | (11) | ||
| B103C | Urine | 1 wk | (11) | ||
| B103D | Urine | 6 mo | (11) | ||
| M103 | Massachusetts, USA | M103A | Plasma | 1.5 mo | (11) |
| M103B | Plasma | 5 mo | (11) | ||
| MS1 | Minnesota, USA | MS1A | Urine | 1 mo | (11) |
| MS1B | Urine | 2 mo | (11) | ||
| MS1C | Urine | 11 mo | (11) | ||
| MS2 | Minnesota, USA | MS2A | Urine | 1 mo | (11) |
| MS2B | Urine | 2 mo | (11) | ||
| MS2C | Urine | 11 mo | (11) | ||
| U01 | Massachusetts, USA | U01 | Urine | 2 d | (10) |
| U04 | Massachusetts, USA | U04 | Urine | 2 d | (10) |
| U33 | Massachusetts, USA | U33 | Urine | 2 d | (10) |
| G1 | Massachusetts, USA | G1 | GBM | 59 y | (16) |
| HG1 | Minnesota, USA | HG1 | Urine | 12 d | SRX974216 |
| HG2 | Urine | 23 d | SRX974217 | ||
| HG3 | Urine | 33 d | SRX974219 | ||
| HG4 | Urine | 96 d | SRX974220 | ||
| HG5 | Urine | 187 d | SRX974222 | ||
| 1254 | São Paulo, Brazil | 1254.3 | Urine | 28 d | SRX974421 |
| 1254.4 | Urine | 38 d | SRX974422 | ||
| 1254.5 | Urine | 4 mo | SRX974423 | ||
| 1254.6 | Urine | 6 mo | SRX974424 | ||
| 1254.8 | Urine | 2 y | SRX974425 | ||
| 1254.1 | Saliva | 11 mo | SRX974426 | ||
| H5478 | Tübingen, Germany | H5478 | Cord Blood | 1 d | SRX976333 |
| H5529 | Urine | 2 d | SRX976334 | ||
| H1109 | Tübingen, Germany | H1109 | Amniotic Fluid | 22 wk gestational age | SRX976347 |
| H1861 | Urine | 1 d | SRX976349 | ||
| H1875 | Cord Blood | 1 d | SRX976351 | ||
| PL2 | Massachusetts, USA | PL2 | Plasma | 6 mo | SRX976352 |
| 956B | São Paulo, Brazil | 956B.1 | Saliva | 7 d | SRX976477 |
| 956B.3 | Urine | 7 d | SRX976479 | ||
| 1587 | São Paulo, Brazil | 1587.1 | Saliva | 8 mo | SRX976486 |
| 1587.2 | Saliva | 9 mo | SRX976487 | ||
| 1587.6 | Urine | 8 mo | SRX976489 | ||
| 1587.8 | Urine | 10 mo | SRX976490 | ||
| 1587.9 | Urine | 2 y and 5 mo | SRX976491 | ||
| U45 | Massachusetts, USA | U45.Ur | Urine | 2 d | SRX976353 |
| U45.Pl | Plasma | 2 d | SRX976354 | ||
| M74 | São Paulo, Brazil | M74.1 | Saliva | 2 d | SRX976481 |
| M74.2 | Saliva | 2 y and 6 mo | SRX976483 | ||
| M74.3 | Urine | 23 d | SRX976484 | ||
| M74.6 | Urine | 10 mo | SRX976485 |
Table 1.
Summary of HCMV sequencing data
| Unique patients | 18 |
| No. of samples | 48 |
| No. of bases sequenced | 4.1 x 10¹⁰ |
| Median genome coverage | 89.5% |
| Average depth | 2,175 |
| Total SNPs | 859,441 |
| Total unique SNPs | 214,718 |
| Total unique sites | 153,975 |
Fig. 1.
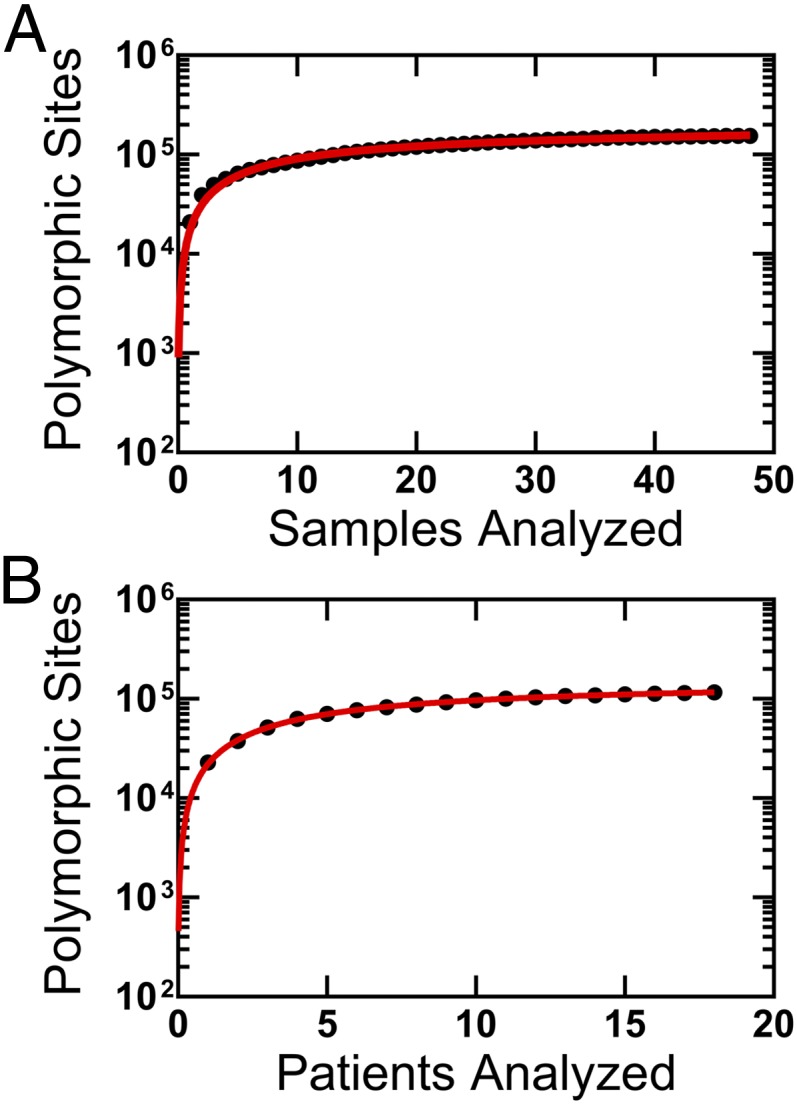
Limits of HCMV diversity. Plotted is the number of polymorphic sites identified as a function of the number of samples (A) or patients (B). Saturation curves (red lines) were fit to the data using the equation: where Tsites is the total number of polymorphic sites, S is the number of samples or patients, Lmax is the maximum number of polymorphic sites, Ks is the number of samples at which half the polymorphic sites have been discovered, and E is the error rate per sample. Lmax for the two plots indicate the theoretical maximum number of polymorphic sites present in HCMV samples from congenital infections. The value for Lmax was calculated as 161,646 (95% confidence interval, 159,019–164,273) in A and 155,874 (95% confidence interval, 154,101–157,647) in B. For A, all samples (n = 48) are included; for B, only one representative sample from each patient (n = 18) was used.
Genome-Wide Patterns of Diversity.
Next, the pattern of diversity in the HCMV genome was analyzed. To determine how the polymorphisms were distributed across the genome, the average number of SNPs per nucleotide position (i.e., SNP density) was calculated in 100-base pair (bp) sliding windows across the genome (Fig. 2, inner gray circle), and the number of nonsynonymous SNPs was calculated for each ORF (Fig. 2, middle gray circle). Lastly, a statistical test described previously (29) was used to identify regions with significantly reduced diversity compared with the remainder of the genome (Fig. 2, outer gray circle). For each region, q values, or false discovery rate corrected P values, were calculated to test the significance of regions with lower than expected diversity. The q values were plotted as –log10 values, such that increasing values signify greater significance. In this analysis, a strong correlation was identified between SNP density and sample coverage when the number of samples was <24 although this relationship was largely absent when the number of samples with sequence coverage was ≥24 (Fig. S1). Therefore, this analysis was limited only to sites that were sequenced in ≥24 samples (n = 214,369, ∼91% of the genome).
Fig. 2.

Diversity across the HCMV genome. Shown is a circular plot of the HCMV genome, with green and orange shading denoting the unique long (UL) and unique short (US) regions, respectively. Within the inner circle, white indicates noncoding regions and black marks all ORFs. Plotted in gray concentric circles, from the center to the outer regions, are SNP density, nonsynonymous SNP density, and –log(q values) from a statistical test of low SNP density. Only significant q values (≤0.01) are plotted. The outer red circle highlights regions with sufficient coverage to accurately quantify diversity (≥24 samples) (Fig. S1).
Fig. S1.
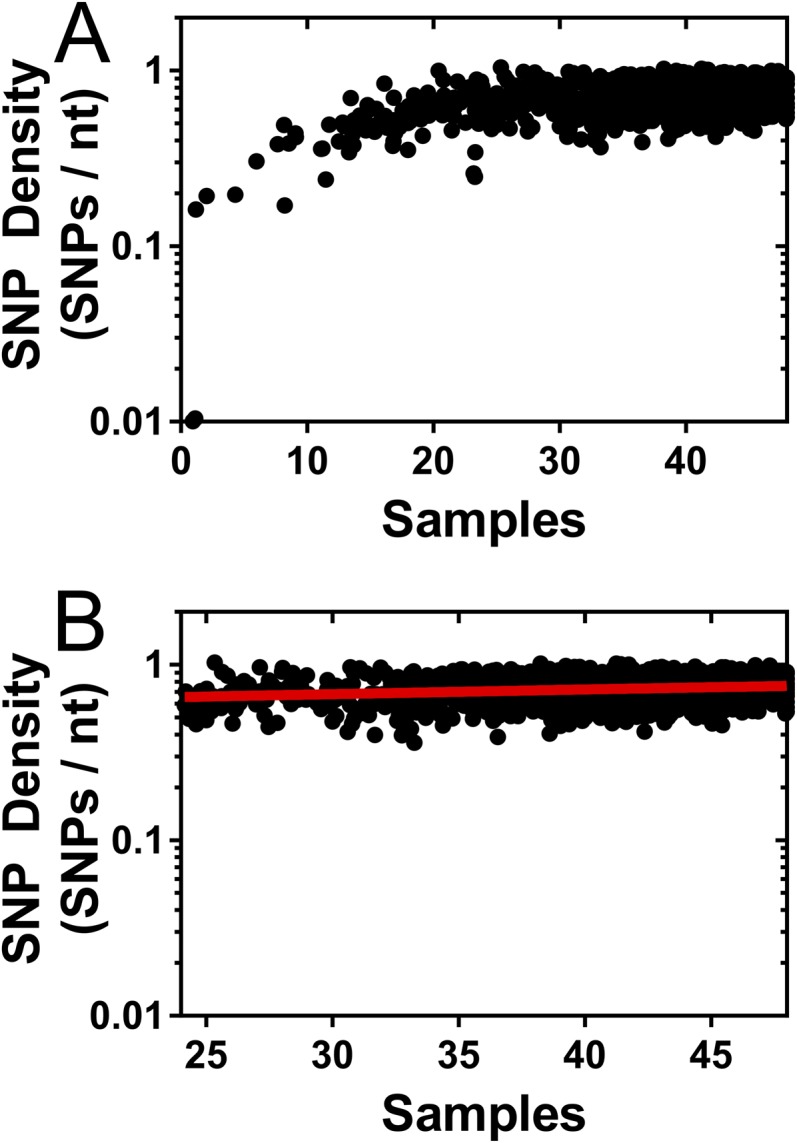
Relationship between SNPs detected and sample coverage. SNP density was calculated in 100-bp sliding windows across the HCMV genome and plotted as a function of the sample coverage for a window. Sample coverage is defined as the number of samples with an average sequencing depth >15× in a given window. (A) SNP density versus sample coverage for all windows. (B) SNP density versus sample coverage for regions in which sample coverage was ≥24. Red line depicts linear regression of data, with r2 = 0.02.
SNP density and nonsynonymous SNP density were strongly correlated across the genome, and variations in SNP density were observed. For example, the UL132 gene, a glycoprotein previously shown to be diverse in infants (30), and US2 gene, a well characterized immune evasion gene (31), harbored a high concentration of SNPs. Regions of statistically significant low SNP density were identified in 26 regions, encompassing ∼14 kilobases (kb) (Fig. 2, outer gray circle). These regions were enriched in herpesvirus core genes: that is, genes conserved across herpesviruses (Fig. S2). The low SNP density regions were also more frequently located in genes encoding DNA replication and processing proteins, as well as those encoding capsid, tegument, and regulatory proteins (Fig. 3A). In contrast, genes encoding envelope, glycoproteins, and immune evasion genes exhibited high SNP densities. Thus, the data suggest that variation in genome-wide diversity correlates with protein function.
Fig. S2.

Diversity by ORF conservation. Low SNP density regions of the genome were identified and were assigned to all ORFs of the HCMV genome. ORFs were classified according to herpesvirus conservation, and the number of significant low density windows per ORF was plotted as a function of ORF conservation. The P value represents results from a Kruskal–Wallis analysis. Core genes are conserved in the Alpha-, Beta- and Gammaherpesviridae, Beta-Gamma are conserved in the Beta- and Gammaherpesviridae, Beta are conserved in the Betaherpesviridae, and HCMV genes are not conserved across species. Red bars mark the group median, and black bars mark the interquartile range.
Fig. 3.

Diversity by ORF function and mutation and recombination rate. Plotted are the relationships between observed diversity in the HCMV genome and ORF protein function, mutation rate, and recombination rate. (A) Low SNP density regions of the genome were identified and were assigned to all ORFs of the HCMV genome. The number of significant low density windows per ORF was plotted as a function of protein function, and P value represents results from a Kruskal–Wallis analysis. Red bars mark the group mean, and black bars mark the SEM. (B) Mutation rates were calculated in 500-bp windows by identifying de novo mutations in time-sampled data. Genome-wide SNP densities were then plotted as a function of local mutation rates. A linear regression analysis (red line) was applied to the data and was significantly nonzero (P < 0.0001). The Pearson’s correlation for the data was 0.29 (r2 = 0.083). (C) As in B, SNP density was plotted as a function of recombination rates, with a linear regression shown as a red line. The regression analysis was significantly nonzero (P < 0.0001), and the Pearson’s correlation was 0.28 (r2 = 0.077).
Correlation of Diversity with Mutation and Recombination Rates.
Neutral factors, such as variation in mutation and recombination rates, likely contribute to variation in genome-wide diversity. Mutation rates have been shown to vary across the genome of a wide range of species (32–35). No genome-wide mutation rate data were available for HCMV; thus, the patient sample data collected here were used to estimate these rates. De novo mutations were identified in longitudinal patient samples, and, as with previous mutation accumulation analyses (34, 36), mutation rates were calculated in 500-bp windows. The genome-wide average was 2 × 10⁻⁷ mutations per base pair per generation. This estimate was ∼10-fold higher than previous in vitro estimates for herpes simplex virus type 1 (37, 38) but was comparable to in vivo estimates for murine cytomegalovirus (39). Further, there was a weak (Pearson’s correlation coefficient r = 0.28, r2 = 0.083) but highly significant positive correlation between estimated mutation rate and SNP density (Fig. 3B).
Recombination rates, like mutation rates, can also vary across the genome (40, 41) and have previously been shown to correlate with the level of intraspecies diversity (42). Although mutation rates can directly alter levels of diversity, recombination rates likely correlate with diversity because of a coupling with either positive or purifying selection, which reduces diversity in a region of the genome that is proportional to local recombination rates (43–45). No genome-wide recombination map was available for HCMV. To address this deficiency, the population sequence data from the current study was analyzed using an approach described previously (40), and recombination rates were estimated in 500-bp windows across the genome. The genome-wide average of 2Ner/kb, where Ne is the effective population size and r is the per generation recombination rate, was 2.01. Using previous estimates of ∼1,000 for the effective population size (Ne) of HCMV (11) resulted in a recombination rate of ∼0.23 cross-over events per genome per generation or 1 cross-over per genome every 4.2 generations. The highest recombination rates were detected near the oriLyt region and the UL/b′ and internal repeat short (IRS) junction, and the lowest rates were located in the UL86 ORF. Similar to mutation rate, a weak but highly significant correlation was observed between recombination rates and SNP density (Pearson’s correlation coefficient r = 0.28, r2 = 0.077) (Fig. 3C). In total, the data presented in Fig. 3 suggest that variation in genome-wide diversity is correlated with protein function, as well as mutation and recombination rates.
Compartmental Distribution of HCMV Diversity.
Our studies examined the limits and patterns of diversity observed in HCMV sampled from a diverse array of host compartments, including urine, plasma, cord blood, saliva, and a tumor. Previous work has shown that HCMV genetic diversity can vary across host compartments in a phenomenon known as compartmentalization (25, 26). To determine whether genomic diversity segregates according to host compartment, the dataset of the current study was subjected to discriminant analysis of principal components (DAPC) (46). This represents a three-phase approach, with the optimal number of clusters defined first, followed by a principal components analysis (PCA) and then discriminant analysis (DA) of the principal components. DA is designed to assign cluster or group membership by maximizing between-group variation and minimizing within-group variation, but requires a small number of uncorrelated variables, a requirement that is violated when studying large datasets of SNPs. PCA can transform a large dataset into a reduced number of uncorrelated variables (i.e., principal components). Thus, by combining PCA and DA, DAPC capitalizes on the strengths of two multivariate analyses to study large datasets and uncover underlying population structure.
The optimal number of clusters was first inferred using kmeans analysis of the genome-wide HCMV SNP frequency data from all patients and evaluation using Bayesian information criterion (BIC) (47). Clusters in this context are analogous to viral clades identified through phylogenetic analysis of consensus sequences, with a primary difference that the clustering analysis was performed on all SNPs, including consensus and those at lower frequencies. This analysis revealed that HCMV populations were best characterized with five clusters (Fig. 4A), a conclusion that was further supported by an independent cluster analysis (Fig. S3). The data were then transformed with PCA, and the principal components were analyzed with DA. The outputs from DA were discriminant functions, and the first two discriminant functions were plotted in Fig. 4B. Similarity between clusters and HCMV populations can be inferred from distance between groupings on the scatterplot (Fig. 4B) (47). Three clusters (clusters 3–5) were most alike whereas two clusters (clusters 1 and 2) showed increased genetic distance to the other groups (Fig. 4B). Cluster 4 was most closely related to all other clusters. All samples showed a high probability of belonging only to a single cluster (membership probabilities of Fig. 4C), reducing the ambiguity of the analysis and suggesting that most SNPs supported the membership assignment. Cluster membership was then analyzed by patient compartments (Fig. 4C) to test for a potential relationship between viral genetics and host compartments. The six saliva samples contained representatives of three clusters, and urine samples represented all five clusters. In contrast, all eight plasma samples contained members from a single cluster, specifically cluster 4. This cluster, however, was not exclusively represented by plasma samples because urine samples were also present in the grouping as was the adult GBM sample, originally chosen to serve as an outlier. The DAPC analysis revealed that the GBM population was very similar to plasma populations, such as those sampled from patients M103 and B103. In total, the data suggested that plasma populations may be more alike than populations sampled from saliva or urine compartments. Intragroup comparisons were performed to test this model. For example, plasma samples were compared with all other plasma samples using percent differences of consensus sequences (Fig. 4D) and FST as metrics of similarity (Fig. 4E). FST is a statistic evaluating the frequency of all alleles present in two populations and ranges from 0 to 1, with 0 meaning all diversity is shared between populations and 1 meaning no diversity is shared between populations. The intragroup comparisons showed that plasma populations are more similar than the intragroup comparisons of saliva or urine. Further, urine populations tended to be highly dissimilar, consistent with the DAPC analysis. In total, these data suggest that HCMV populations sampled from plasma compartments are more genetically related, and perhaps more strongly constrained, than those from the saliva or urine compartments.
Fig. 4.

Cluster analysis of HCMV populations. Discriminant analysis of principal components (DAPC) was performed on SNP frequency data from 48 HCMV populations. In this analysis, the optimal number of clusters or groupings was first inferred, followed by transformation of the data with principal components analysis. Lastly, a discriminant analysis of the principal components was performed, using the number of clusters inferred in the first step, to minimize within-cluster variance, maximize between-cluster variance, and reveal underlying population structure and genetic relatedness of samples. (A) Cluster analysis was performed with increasing numbers of clusters. A Bayesian information criterion (BIC) was implemented to identify the cluster number that minimizes within-cluster variance while avoiding model overfitting. Five clusters yielded the lowest BIC score and were used in subsequent analyses. These data suggest that there are at least five clusters or clades within the analyzed dataset. (B) Discriminant analysis, the final step of DAPC, was used to generate discriminant functions that “discriminate” between clusters and can be plotted to infer genetic relatedness and population structure. A scatter plot of the first two discriminant functions was generated to analyze HCMV populations. Distance on the plot is proportional to genetic distance between clusters, and thus clusters 3, 4, and 5 are alike whereas clusters 1 and 2 are more distantly related. The eigenvalues (Inset) show the amount of variance accounted for by the four retained discriminant functions, showing that the first two functions explain the majority of variance in the data. (C) Cluster membership probabilities of all samples used in this study, grouped by host compartment. All samples were assigned to clusters with 100% probability, yielding high confidence in the assignments and suggesting that many SNPs support the presented results. Saliva samples were predominantly represented in cluster 5 although members from cluster 2 and 3 were also present. Urine samples contained members of all five clusters. Plasma samples were exclusively grouped into cluster 4. (D and E) Samples from the same host compartment were grouped, and pairwise comparisons to all other samples from the same host compartment (i.e., intragroup comparisons) were performed. The percent difference of consensus sequences (D) or FST (E) from the pairwise comparisons are plotted. HCMV populations from plasma samples tended to be more alike than HCMV collected from the saliva or urine host compartments.
Fig. S3.

Gap statistic analysis of clustering in HCMV populations. The gap statistic was applied to the HCMV population data to determine the optimal number of clusters to fit to the data. The gap statistic calculates the difference or gap of within-cluster variance using a given cluster number and the expected variance given a null distribution. The number of clusters that maximize the gap statistic is considered the optimal number of clusters for a dataset. Shown is the calculated gap statistic for cluster numbers from 1 through 10. The blue line represents the median value from 1,000 bootstrap replicates, and the gray areas represent the 95% confidence interval.
Plasma-Associated Polymorphisms.
Given the relatedness of plasma-sampled populations, it was determined whether a subset of polymorphisms was enriched within these populations. It was assumed that the polymorphisms were binomially distributed across the various samples and were not preferentially associated with any host compartment. A binomial test of significance with a false discovery rate correction was then used to test whether polymorphisms were enriched in plasma populations (Fig. 5A). In total, 655 polymorphisms were significantly associated with plasma populations. These polymorphisms (Fig. 5B), and specifically the nonsynonymous polymorphisms (Fig. 5C), were more common in ORFs encoding glycoproteins and regulatory proteins. The polymorphisms with the highest statistical significance were present in the ORFs encoding the glycoproteins gB (UL55), gO (UL74), gN (UL73), and gH (UL75). In addition, the plasma-enriched SNPs were common in noncore ORFs: i.e., the ORFs that are not conserved across human herpesviruses (Fig. S4), suggesting that these SNPs affect phenotypes most associated with HCMV.
Fig. 5.

Identification of plasma-associated polymorphisms. (A) The significance of polymorphism enrichment in plasma samples compared with all other samples was tested assuming a binomial distribution and multiple testing correction. Plotted are –log(q values) generated from the test as a function of SNP genomic position. Shown in red are significant SNPs (q value of ≤0.01), and blue are nonsignificant SNPs. The plasma-enriched SNPs (B) or nonsynonymous SNPs (C) were then assigned to all ORFs of the HCMV genome and plotted by ORF function. P values represent results from a Kruskal–Wallis analysis. Polymorphism rate in B corresponds to plasma-enriched SNPs per 100 bp of coding sequence, and nonsynonymous polymorphism rate is plasma-enriched nonsynonymous SNPs per 100 codons.
Fig. S4.

Distribution of plasma-enriched SNPs by ORF conservation. ORFs were classified according to herpesvirus conservation, and the rate of plasma enriched SNPs (A) or plasma-enriched nonsynonymous SNPs (B) was plotted for each conservation class. P values represent results from a Kruskal–Wallis analysis. Polymorphism rate in A corresponds to plasma-enriched SNPs per 100 bp of coding sequence, and nonsynonymous polymorphism rate in B is plasma-enriched nonsynonymous SNPs per 100 codons. Core genes are conserved in the Alpha-, Beta- and Gammaherpesviridae, Beta-Gamma are conserved in the Beta- and Gammaherpesviridae, Beta are conserved in the Betaherpesviridae, and HCMV genes are not conserved across species. Red bars mark the group mean and black bars mark the SEM.
Analysis of Mixed Infections.
Many samples in this study were collected either across time and/or across compartments from the same patient. These samples were analyzed in an attempt to understand whether the observed patterns of diversity result from single or multiple strain infections. The hypothesis was that all samples collected from single strain infections would be genetically similar whereas those samples collected from mixed infections or reinfections could be more divergent because the relative proportion of mixed strains could change over time or across compartments within a host. Longitudinal or compartmental samples were collected from 12 patients, and genetic relatedness of the samples was visually analyzed with principal components analysis (PCA) (Fig. S5). PCA, as opposed to DAPC, was used for visualization because DAPC was designed to minimize within cluster or clade variation, which may decrease the ability to identify two strains from the same clade. Using the visual analysis, putatively single strain infections were exemplified by samples from patient HG1, in which five urine samples overlap on the PCA plot, and patient 1254, in which urine and saliva samples collected over 2 y were nearly identical (Fig. S5). In contrast, a later time point saliva sample collected from patient 1587 was highly differentiated from an earlier time point saliva sample, as well as urine samples collected at nearly the same time (Fig. S5), a pattern expected in mixed infections or reinfections. Samples collected from patients 1587, B103, M74, and U45 were consistent with mixed infections or reinfections. Consensus sequences from the samples were compared, with calculation of the percent differences as a measure of divergence. The percent differences from putatively mixed strain infections were similar to values obtained from unique strains (10) (Fig. S6) although the divergence of samples from patient U45 was at intermediate levels. Further analysis showed that the genome-wide intrahost diversity of samples collected from putatively single or mixed strain infections was indistinguishable and that the genome-wide patterns in diversity were highly similar (Fig. S7). Thus, the data suggest that mixed strain infections or reinfections occur in at least a third of congenitally infected infants although the genome-wide viral intrahost diversity is not greatly affected by the differences in infection status.
Fig. S5.

Principal components analysis of longitudinal and compartmental samples. Samples were collected across time or compartments for 12 patients. These samples were subjected to principal components analysis (PCA) to visualize divergence between samples. Principal component 1 (PC1) and principal component 2 (PC2) for each sample are plotted. Points on the plot are labeled to identify the sample from which the data were obtained.
Fig. S6.

Similarity of samples collected from putatively single or mixed strain infections. PCA was used to identify putatively single or mixed strain infections. Patients 1254 and HG1 were assigned as putatively single strain infections, and patients 1587, B103, M74, and U45 were putatively mixed strain infections. The consensus sequences from these samples were then aligned to calculate consensus sequence percent difference for all single patient pairwise comparisons. The percent differences are plotted as a heatmap with values ranging from 0 (blue) to 2% (red).
Fig. S7.

Analysis of genetic diversity of putatively single and mixed strain infections. Putatively single and mixed strain infections were identified from PCA and consensus sequence alignments between samples collected from single patients. (A) The genome-wide intrahost diversity of samples collected from putatively single and mixed strain infections are plotted. The center bar represents the media value, and the whiskers represent the interquartile ranges. Red bars mark the group mean, and black bars mark the SEM. (B) SNP Density was calculated in 100-bp windows across the HCMV genome for putatively single and mixed strain infections and are displayed as a scatterplot. Linear regression analysis (red line) was applied to the data, and the Pearson correlation of the data was r = 0.58. (C) Genome-wide SNP Density plots for putatively single and mixed strain infections, calculated in 100-bp windows. Average SNP density was lower in putative mixed infections than single infections, which likely reflects the lower number of samples in the mixed infection classification compared with the single infection classification.
Discussion
Increasing evidence has shown that HCMV is a genetically diverse virus when analyzed between and within human hosts. Here, we performed a large-scale analysis of 48 HCMV populations sampled from 17 infants with congenital CMV infection and 1 adult with glioblastoma multiforme and identified variable and highly conserved regions across the viral genome. We have shown that the most conserved regions of the genome are located in genes encoding DNA-processing enzymes, capsid, and tegument proteins. We also demonstrate how the genomic diversity is distributed across three host compartments, showing that plasma populations are genetically constrained and enriched for SNPs within glycoproteins and regulatory proteins. Lastly, analysis of mixed and single strain infections suggest that genome-wide intrahost diversity is similar between the types of infection.
These data have clear implications in our understanding of HCMV evolution. Polymorphisms were absent in approximately one-quarter of the HCMV genome, suggesting an upper limit to HCMV diversity in these patient samples. With Lmax values of 154,101–164,273 reported in Fig. 1, and high coverage sequence data for 91% of the genome (214,369 bp), ∼23–28% of the genome is conserved. These values differ from those estimated for other species. The number of conserved sites in the human genome is ∼8% (48), and, in other viruses, the proportion is much higher, including 66% for HIV (49), 63% for influenza A virus (50), and 78% for rubella virus (51). These trends suggest that the number of invariant sites is inversely correlated with genome size. An outlier, however, is hepatitis C virus, which encodes a 9.6-kb genome in which ∼35% of the genome is conserved although 84% of the 5′ UTR region is conserved (52). A practical application of the limit of diversity and identification of conserved sites is in rational design and evaluation of anti-HCMV therapeutics. Currently, antiviral resistance has been identified for all FDA-approved small molecule inhibitors of HCMV (4). Additional therapeutics have been developed, including the terminase inhibitor letermovir and at least one neutralizing monoclonal antibody against gH. However, resistance against these compounds has been generated in laboratory experiments (5, 53), reinforcing the need to design therapeutics with reduced probability of resistance. The current study has revealed the existence of small, highly conserved, and thus likely highly constrained, sites across the HCMV genome, thereby highlighting potential therapeutic targets. These small regions can form the basis for future informed therapeutic design.
The data presented here also provide evidence for several mechanisms that alter the distribution of diversity across the HCMV genome. The analysis revealed that DNA processing enzymes are conserved across patients whereas regulatory proteins and glycoproteins are variable. This correlation of ORF function and genetic diversity suggests that selection on protein function shapes diversity, in agreement with previous analyses of HCMV interhost diversity at a limited set of loci (54). Other mechanisms, however, could explain the observed correlation. Variations in transcription levels are associated with variations in mutation rates (55, 56) and thus could be a confounding factor in the analysis, as could alterations of transcriptional kinetics. Relatedly, differences in histone association (57) and epigenetic silencing (58) alter transcriptional activity and may be associated with protein function. Changes in DNA biophysical properties that alter mutation potential, such as secondary structure (59), also cannot be excluded as possible contributors to the observed pattern.
Furthermore, our analysis demonstrates that neutral mechanisms, such as mutation and recombination rates, can correlate with genetic diversity, similar to previous observations across a diverse range of species (42). Indeed, ∼10% of the variance in SNP density could be explained by variations in these rates. Although the correlation between these rates and diversity does not prove causation, potential mechanistic relationships between the factors can be proposed. In particular, the correlation between recombination rate and diversity likely results from the effects of either background selection and/or genetic hitchhiking. Background selection is the removal of neutral diversity linked to deleterious alleles (44), and hitchhiking is the fixation of neutral alleles linked to beneficial alleles (43, 60). Both mechanisms are expected to reduce local variation around the target of selection, and the size of the region of reduced variation is inversely proportional to recombination rates. As recombination rates increase, neutral variation can become unlinked from selected sites and remain as polymorphisms in the population. Debate continues on the relative contribution of background selection and hitchhiking on observed patterns of reduced diversity in natural populations (45) although it is likely that both factors are at play in many organisms (61, 62). Further studies will be needed to disentangle the roles of background selection, genetic hitchhiking, and recombination in shaping HCMV genomic diversity and evolution.
Host factors also may be an important contributor to shaping the patterns of HCMV in vivo diversity. The fetal/neonatal CMV-specific immune response may significantly affect the CMV genomic diversity observed in our study. Longitudinal samples were collected from young infants with ages ranging from 1 wk to 2.5 y. Prior reports from our group (63–65) and others (66) have shown that HCMV-specific CD8+ T-cell responses with similar antigen specificity, phenotype, and functional profiles as adults are detectable in infants with congenital CMV infection, even during gestation. Other studies have shown that infants can generate HIV-specific CD8+ T-cell responses that exert selective pressure and contribute to the evolution of viral quasi-species over the first year of life (67). The fate of HIV escape mutations transmitted from mother to infant may depend on concordance of the HLA alleles restricting these MHC class I responses, resulting in persistent mutations and escape from viral control in infants with shared alleles and reversion of fitness-cost mutations in those with nonshared alleles (67, 68). Similar studies are warranted in HCMV to better understand the role that host immunity has in shaping viral diversity and the potential role of viral diversity in immune evasion and mother-to-child transmission.
Greater knowledge of the rate of HCMV reinfections is of significant clinical importance, particularly in regard to the development of a vaccine against HCMV (69). The annualized rate of reinfection in healthy adults is as high as 10% (70), and multiple strain infections in transplant recipients also seem to be common (17). In this study, we analyzed the proportion of reinfections or mixed infections by studying the viral population divergence across time or compartments, estimating that approximately one-third of infections were mixed or reinfections. This number is similar to previous estimates based on genotype data (19) but is likely to be an underestimate because our analysis requires a change in population structure that may not occur in stable multiple strain infections. The genome-wide intrahost diversity in putative mixed infections was statistically identical to single strain infections, suggesting that infection status does not correlate with viral diversity in neonates and infants. The same result may not be true in other patient cohorts. The source of the multiple strains of patients in this study is unknown. Nonprimary maternal infections are increasingly recognized as important contributors to HCMV in utero transmission (71), accounting for up to 75% of HCMV congenital infections in the United States (72). Future investigation studying the natural history of HCMV infections, including viral population demographics of single and mixed strain infections, would allow for a much better quantification of the timing and dynamics of in utero mixed infections.
The estimates of HCMV genome-wide mutation rates presented here are approximately an order of magnitude higher than those of a closely related herpesvirus, HSV-1, but comparable with murine cytomegalovirus (39). It should be noted, however, that the HCMV estimates may be conservative, given the relatively stringent requirements of calling a de novo mutation, specifically maintaining a sustained frequency above the limits of detection. There are several reasons that the rates could be higher than those of HSV-1. Although the HSV and HCMV polymerases are similar at the amino acid level (73), differences exist throughout the coding sequence. The functional consequences of these variants have not been characterized although alterations of fidelity are a possibility. Furthermore, extrinsic or accessory factors can alter polymerase fidelity (74, 75), and the interaction of HSV and HCMV polymerases with their cognate accessory proteins, UL42 and UL44, respectively, has been shown to differ at the molecular level (76) as have the quaternary structures of the accessory proteins (77). Lastly, the role of host factors, such as proteins of the DNA damage response (78, 79), in altering mutation rates of viral replication cannot be excluded, particularly because herpesviruses are potent inducers of host DNA damage responses (79).
Finally, 655 SNPs, of which 219 were nonsynonymous, have been identified as being enriched in plasma populations, and these polymorphisms are primarily localized to the glycoproteins and regulatory proteins. These findings are in agreement with our previous results that have identified targets of selection during plasma-to-urine dissemination, in which glycoproteins were also enriched (11). The underlying biologic explanations of these patterns could be varied. Cellular tropism is a possible candidate, particularly because the contribution of HCMV glycoproteins to cellular tropism is well-established (80–83), and genetic variation in genes encoding glycoproteins may play a role in altering HCMV tropism in vivo (27, 28). Thus, it is possible that at least a portion of the plasma-enriched SNPs identified in the current study alter HCMV tropism. However, other possible biological mechanisms cannot be excluded, such as the adaptive immune response shaping the observed SNP compartmentalization. Tissue-specific differences in immune responses have evolved to address varied routes of pathogen transmission, such as via blood or mucosal surfaces (84), and could also be drivers of viral genetic diversity. With the identification of these plasma-enriched SNPs in patient samples, future genetic studies can focus on disentangling these and other possible biologic mechanisms.
HCMV is an important human pathogen and one for which prevention strategies and therapeutic interventions are needed. With the current study, we have begun to understand the patterns and limits of HCMV genomic diversity and have laid the groundwork for translating these results into future clinical interventions.
Materials and Methods
Ethics Statement.
Subjects B101, B103, M103, MS1, and MS2 were described previously (11) as were U01, U04, and U33 (10) and G1 (16). The use of specimens from subjects PL2 and U45 was approved by the University of Massachusetts Medical School and Baystate Medical Center Institutional Review Boards. Viruses from subjects 956, 1254, M74, and 1587 were collected during research studies at the University of São Paulo in Ribeirão Preto, São Paulo, Brazil and were approved by the Institutional Review Board of the Faculty of Medicine of the University of São Paulo in Ribeirão Preto and the School of Medicine at the University of Alabama in Birmingham as part of a National Institute of Child Health and Human Development-supported research project. The use of stored specimens from Brazilian HCMV-infected infants (subjects 956, 1254, M74 and 1587) was approved by the Research Ethics Committee of the University Hospital. The samples H5478/H5529 and H1109/H1861/H1875 were derived from the Epidemiologische Untersuchung zur Erhebung der lnzidenz der kongenitalen Cytomegalvirus Infektion study, which was approved by the Ethik-Kommission der Medizinischen Fakultät at the Universitätsklinikum Tübingen. Informed consent was obtained from subjects’ parents for study of HCMV.
Amplification and Sequencing of HCMV DNA.
A previously described set of PCR primers (10) was designed to amplify the entire HCMV genome from a diverse collection of patient samples. PCR amplification was performed as described previously (11). The DNA from all reactions of a single sample was quantified on a Nanodrop 2000 (Thermo Fisher) and pooled in equimolar proportions. Pooled DNA was then prepared for sequencing on the Illumina HiSeq2000 as described previously (11) or for sequencing on the ION proton sequencer (Life Technologies) using the manufacturer’s standard protocols and reagents. Samples were labeled with DNA barcodes and aggregated into libraries that generally included four to six samples. Error controls were produced by whole genome amplification of a BAC clone of HCMV strain AD169, using the same primers and amplification protocols as used for patient samples. Error control DNA was then prepared for high throughput sequencing in a manner identical to the patient samples, and the barcoded error control DNA was included in sequencing libraries.
Sequence Analysis.
Sequence data were analyzed in a manner identical to previously described methods (10, 11), in which a sample-specific consensus sequence was called and variants from the consensus were then inferred. SNP calling was modified from our previously described method. Polymorphisms were discarded if basecall quality was <20 or if local sequencing depth was <15. Polymorphisms were then filtered based on platform- and base-specific error rates calculated from sequencing an error control (Fig. S8). We then calculated P values for all polymorphisms, assuming a Poisson distribution of error frequencies. Variants with P values of >0.01 were excluded. When ORFs were classified by function, the classification of Sylwester et al. (85) was used, except for the inclusion of latency ORFs, which were classified according to Poole et al. (86). Classification by ORF conservation, including core, beta-gamma, beta, and noncore genes, was performed according to the information available from the National Center for Biotechnology Information for the HCMV reference sequence (RefSeq ID no. NC006273.2).
Fig. S8.

Error rates of Illumina and ION sequencing platforms. An error control was processed in parallel with all samples in this study. Error control sequencing data were used to calculate platform- and base-specific mutation rates. The data were calculated for the Illumina HiSeq2000 (A) and ION Torrent (B) platforms. These data were included in filtering of the experimental sequence data to reduce error levels.
Mutation and Recombination Rate Estimation.
Mutation rates were estimated from putatively de novo mutations accumulated during the time of sampling. In this study, five patients provided longitudinal samples collected at three or more time points. These patients are identified as MS1, MS2, HG1, 1587, and 1254. These longitudinal samples were collected from the urine. Putative de novo mutations were identified as newly arising SNPs that were absent in earlier samples and present in all later samples. For example, five samples were collected from patient 1254. A de novo mutation was called if an SNP was not present in the first two samples and then identified in all of the three later samples. Mutation rates were then calculated as mutations per generation per base by dividing the genome into 500-bp windows and using previously described estimates of HCMV in vivo generation time (87). Recombination rates were estimated using the population sequence data from the current study and were analyzed with the interval algorithm provided in the LDhat program (40). The algorithm implements a Bayesian reversible jump Markov chain Monte Carlo approach. Recombination rate estimates were calculated in 500-bp windows across the genome, and regions with sample coverage <24 (Fig. S1) were excluded from further analysis.
Discriminant Analysis of Principal Components.
DAPC (46), as implemented in the adegenet R software package (47), was applied to polymorphism data in this study. This approach occurs in three phases, with the optimal number of clusters defined first, followed by a principal components analysis (PCA) and then discriminant analysis (DA) of the principal components. PCA transforms a large dataset, such as SNP data, into a reduced number of uncorrelated variables, which are subjected to DA to assign cluster or group membership by maximizing between-group variation and minimizing within-group variation. The input for the DAPC analysis was a matrix in which the rows were the patient samples and the columns were the analyzed SNPs. The elements of the matrix were the frequencies of each SNP in each patient sample. To account for variation in sequencing coverage across samples or possible erroneous SNP calls, only polymorphic sites that were covered in >90% of samples were included, and all singleton SNPs (i.e., SNPs occurring in only one sample) were excluded. This filtering resulted in a dataset consisting of 4,060 SNPs. The kmeans algorithm was implemented with the find.clusters command of the adegenet R software package (88), with a maximum number of clusters equal to 47 and 10,000 iterations of the algorithm. Optimal cluster values were evaluated using the Bayesian information criterion (BIC), and results for cluster values of ≤10 are presented for clarity (Fig. 5A). The dapc command with a cluster value of 5 was then applied to transform the data with PCA followed by DA to calculate cluster membership and membership probabilities.
The gap statistic was also used to verify the results obtained with the kmeans analysis. The gap statistic measures the difference, or gap, between the within-cluster variance compared with the expected variance given a null distribution (89). This statistic was calculated for cluster values ranging from 1 to 10 (Fig. S3) using the cluster R software package (90) and 1,000 bootstrap replicates. The maximum value for the gap statistic, corresponding to the number of clusters that best explain the data, was obtained at five clusters, in agreement with the results from the kmeans analysis. It is noted that a larger numbers of clusters (for example six clusters) were also good fits for the data. This result likely reflects the fact that HCMV within and among humans are not wholly isolated, panmictic populations, as assumed by the clustering algorithms, because migration within hosts (11) and transmission between hosts (70) occurs at an appreciable rate.
Intragroup comparisons were performed as described in Results, Compartmental Distribution of HCMV Diversity. Only one sample from each patient was included and was chosen based on the highest genomic coverage. FST was performed using a previously described method (91). For these analyses, the amniotic fluid sample (H1109) was included in the urine grouping because this sample was collected later in pregnancy when fetal urine contributes significantly to the production of amniotic fluid (92), and cord blood samples were grouped with plasma samples. The GBM sample was excluded from these comparisons.
Statistical Analysis.
SNP density was analyzed using the method described previously (29) to identify and calculate q values for low density regions. SNP density was analyzed in a sliding window analysis, with 100-bp window sizes and 25-bp step sizes. A background distribution of densities was calculated by resampling from the data 10,000 times, and P values were calculated from this distribution. A Benjamini–Hochberg false discovery rate was ascertained from the data to calculate q values. Significance of SNP enrichment in plasma samples was evaluated assuming a binomial distribution of SNP associations, and a multiple testing correction was applied with a Benjamini–Hochberg false discovery rate procedure. Only sites that were covered in >90% of samples were included in the analysis.
Acknowledgments
We thank Stuart Adler for helpful advice and thoughtful input on the clinical interpretation of the data. We also thank all of the clinicians and patients who contributed samples. We thank the University of Massachusetts Deep Sequencing and Molecular Biology Core Laboratories for their contribution and services. This work was supported by grants from the Deutsche Forschungsgemeinschaft Priority Programme SPP 1590 (to C.P.), by the Swiss National Science Foundation and a European Research Council Starting Grant (to J.D.J.), by National Institutes of Health (NIH) Grants HD061959 (to W.J.B. and T.F.K.), AI109001 (to T.F.K.), and F32AI084437 (to N.R.), and by National Center for Advancing Translational Sciences of the NIH Grant UL1TR000161.
Footnotes
The authors declare no conflict of interest.
This article is a PNAS Direct Submission.
Data deposition: The sequences reported in this paper have been deposited in the GenBank database (BioProject ID PRJNA279971).
This article contains supporting information online at www.pnas.org/lookup/suppl/doi:10.1073/pnas.1501880112/-/DCSupplemental.
References
- 1.Alford CA, Stagno S, Pass RF, Britt WJ. Congenital and perinatal cytomegalovirus infections. Rev Infect Dis. 1990;12(Suppl 7):S745–S753. doi: 10.1093/clinids/12.supplement_7.s745. [DOI] [PubMed] [Google Scholar]
- 2.Cannon MJ. Congenital cytomegalovirus (CMV) epidemiology and awareness. J Clin Virol. 2009;46(Suppl 4):S6–S10. doi: 10.1016/j.jcv.2009.09.002. [DOI] [PubMed] [Google Scholar]
- 3.Balfour HH., Jr Cytomegalovirus: The troll of transplantation. Arch Intern Med. 1979;139(3):279–280. doi: 10.1001/archinte.139.3.279. [DOI] [PubMed] [Google Scholar]
- 4.Lurain NS, Chou S. Antiviral drug resistance of human cytomegalovirus. Clin Microbiol Rev. 2010;23(4):689–712. doi: 10.1128/CMR.00009-10. [DOI] [PMC free article] [PubMed] [Google Scholar]
- 5.Fouts AE, et al. Mechanism for neutralizing activity by the anti-CMV gH/gL monoclonal antibody MSL-109. Proc Natl Acad Sci USA. 2014;111(22):8209–8214. doi: 10.1073/pnas.1404653111. [DOI] [PMC free article] [PubMed] [Google Scholar]
- 6.Renzette N, Gibson L, Jensen JD, Kowalik TF. Human cytomegalovirus intrahost evolution-a new avenue for understanding and controlling herpesvirus infections. Curr Opin Virol. 2014;8:109–115. doi: 10.1016/j.coviro.2014.08.001. [DOI] [PMC free article] [PubMed] [Google Scholar]
- 7.Bradley AJ, et al. Genotypic analysis of two hypervariable human cytomegalovirus genes. J Med Virol. 2008;80(9):1615–1623. doi: 10.1002/jmv.21241. [DOI] [PMC free article] [PubMed] [Google Scholar]
- 8.Cunningham C, et al. Sequences of complete human cytomegalovirus genomes from infected cell cultures and clinical specimens. J Gen Virol. 2010;91(Pt 3):605–615. doi: 10.1099/vir.0.015891-0. [DOI] [PMC free article] [PubMed] [Google Scholar]
- 9.McGeoch DJ, Rixon FJ, Davison AJ. Topics in herpesvirus genomics and evolution. Virus Res. 2006;117(1):90–104. doi: 10.1016/j.virusres.2006.01.002. [DOI] [PubMed] [Google Scholar]
- 10.Renzette N, Bhattacharjee B, Jensen JD, Gibson L, Kowalik TF. Extensive genome-wide variability of human cytomegalovirus in congenitally infected infants. PLoS Pathog. 2011;7(5):e1001344. doi: 10.1371/journal.ppat.1001344. [DOI] [PMC free article] [PubMed] [Google Scholar]
- 11.Renzette N, et al. Rapid intrahost evolution of human cytomegalovirus is shaped by demography and positive selection. PLoS Genet. 2013;9(9):e1003735. doi: 10.1371/journal.pgen.1003735. [DOI] [PMC free article] [PubMed] [Google Scholar]
- 12.Huang ES, Huong SM, Tegtmeier GE, Alford C. Cytomegalovirus: Genetic variation of viral genomes. Ann N Y Acad Sci. 1980;354:332–346. doi: 10.1111/j.1749-6632.1980.tb27976.x. [DOI] [PubMed] [Google Scholar]
- 13.Bradley AJ, et al. High-throughput sequence analysis of variants of human cytomegalovirus strains Towne and AD169. J Gen Virol. 2009;90(Pt 10):2375–2380. doi: 10.1099/vir.0.013250-0. [DOI] [PMC free article] [PubMed] [Google Scholar]
- 14.Meyer-König U, Ebert K, Schrage B, Pollak S, Hufert FT. Simultaneous infection of healthy people with multiple human cytomegalovirus strains. Lancet. 1998;352(9136):1280–1281. doi: 10.1016/S0140-6736(05)70487-6. [DOI] [PubMed] [Google Scholar]
- 15.Coaquette A, et al. Mixed cytomegalovirus glycoprotein B genotypes in immunocompromised patients. Clin Infect Dis. 2004;39(2):155–161. doi: 10.1086/421496. [DOI] [PubMed] [Google Scholar]
- 16.Bhattacharjee B, Renzette N, Kowalik TF. Genetic analysis of cytomegalovirus in malignant gliomas. J Virol. 2012;86(12):6815–6824. doi: 10.1128/JVI.00015-12. [DOI] [PMC free article] [PubMed] [Google Scholar]
- 17.Görzer I, Guelly C, Trajanoski S, Puchhammer-Stöckl E. Deep sequencing reveals highly complex dynamics of human cytomegalovirus genotypes in transplant patients over time. J Virol. 2010;84(14):7195–7203. doi: 10.1128/JVI.00475-10. [DOI] [PMC free article] [PubMed] [Google Scholar]
- 18.Numazaki K, Ikehata M, Asanuma H, Chiba S. Simultaneous infection of immunocompetent individuals with multiple cytomegalovirus strains. Lancet. 1998;352(9141):1710. doi: 10.1016/S0140-6736(05)61490-0. [DOI] [PubMed] [Google Scholar]
- 19.Ross SA, et al. Mixed infection and strain diversity in congenital cytomegalovirus infection. J Infect Dis. 2011;204(7):1003–1007. doi: 10.1093/infdis/jir457. [DOI] [PMC free article] [PubMed] [Google Scholar]
- 20.Spector SA, Hirata KK, Newman TR. Identification of multiple cytomegalovirus strains in homosexual men with acquired immunodeficiency syndrome. J Infect Dis. 1984;150(6):953–956. doi: 10.1093/infdis/150.6.953. [DOI] [PubMed] [Google Scholar]
- 21.Puchhammer-Stöckl E, Görzer I. Cytomegalovirus and Epstein-Barr virus subtypes: The search for clinical significance. J Clin Virol. 2006;36(4):239–248. doi: 10.1016/j.jcv.2006.03.004. [DOI] [PubMed] [Google Scholar]
- 22.Pang X, Humar A, Preiksaitis JK. Concurrent genotyping and quantitation of cytomegalovirus gB genotypes in solid-organ-transplant recipients by use of a real-time PCR assay. J Clin Microbiol. 2008;46(12):4004–4010. doi: 10.1128/JCM.01341-08. [DOI] [PMC free article] [PubMed] [Google Scholar]
- 23.Sowmya P, Madhavan HN. Analysis of mixed infections by multiple genotypes of human cytomegalovirus in immunocompromised patients. J Med Virol. 2009;81(5):861–869. doi: 10.1002/jmv.21459. [DOI] [PubMed] [Google Scholar]
- 24.Leach CT, et al. A longitudinal study of cytomegalovirus infection in human immunodeficiency virus type 1-seropositive homosexual men: Molecular epidemiology and association with disease progression. J Infect Dis. 1994;170(2):293–298. doi: 10.1093/infdis/170.2.293. [DOI] [PubMed] [Google Scholar]
- 25.Frange P, et al. Temporal and spatial compartmentalization of drug-resistant cytomegalovirus (CMV) in a child with CMV meningoencephalitis: Implications for sampling in molecular diagnosis. J Clin Microbiol. 2013;51(12):4266–4269. doi: 10.1128/JCM.02411-13. [DOI] [PMC free article] [PubMed] [Google Scholar]
- 26.Hamprecht K, et al. Ganciclovir-resistant cytomegalovirus disease after allogeneic stem cell transplantation: Pitfalls of phenotypic diagnosis by in vitro selection of an UL97 mutant strain. J Infect Dis. 2003;187(1):139–143. doi: 10.1086/346240. [DOI] [PubMed] [Google Scholar]
- 27.Zhou M, Yu Q, Wechsler A, Ryckman BJ. Comparative analysis of gO isoforms reveals that strains of human cytomegalovirus differ in the ratio of gH/gL/gO and gH/gL/UL128-131 in the virion envelope. J Virol. 2013;87(17):9680–9690. doi: 10.1128/JVI.01167-13. [DOI] [PMC free article] [PubMed] [Google Scholar]
- 28.Meyer-König U, et al. Glycoprotein B genotype correlates with cell tropism in vivo of human cytomegalovirus infection. J Med Virol. 1998;55(1):75–81. [PubMed] [Google Scholar]
- 29.Zhang YJ, et al. Global assessment of genomic regions required for growth in Mycobacterium tuberculosis. PLoS Pathog. 2012;8(9):e1002946. doi: 10.1371/journal.ppat.1002946. [DOI] [PMC free article] [PubMed] [Google Scholar]
- 30.Sun ZR, et al. Genetic variability of human cytomegalovirus UL132 gene in strains from infected infants. Microbiol Immunol. 2006;50(10):773–779. doi: 10.1111/j.1348-0421.2006.tb03853.x. [DOI] [PubMed] [Google Scholar]
- 31.Jones TR, Sun L. Human cytomegalovirus US2 destabilizes major histocompatibility complex class I heavy chains. J Virol. 1997;71(4):2970–2979. doi: 10.1128/jvi.71.4.2970-2979.1997. [DOI] [PMC free article] [PubMed] [Google Scholar]
- 32.Ananda G, Chiaromonte F, Makova KD. A genome-wide view of mutation rate co-variation using multivariate analyses. Genome Biol. 2011;12(3):R27. doi: 10.1186/gb-2011-12-3-r27. [DOI] [PMC free article] [PubMed] [Google Scholar]
- 33.Gao LZ, Xu H. Comparisons of mutation rate variation at genome-wide microsatellites: Evolutionary insights from two cultivated rice and their wild relatives. BMC Evol Biol. 2008;8:11. doi: 10.1186/1471-2148-8-11. [DOI] [PMC free article] [PubMed] [Google Scholar]
- 34.Lynch M, et al. A genome-wide view of the spectrum of spontaneous mutations in yeast. Proc Natl Acad Sci USA. 2008;105(27):9272–9277. doi: 10.1073/pnas.0803466105. [DOI] [PMC free article] [PubMed] [Google Scholar]
- 35.Lynch M. Rate, molecular spectrum, and consequences of human mutation. Proc Natl Acad Sci USA. 2010;107(3):961–968. doi: 10.1073/pnas.0912629107. [DOI] [PMC free article] [PubMed] [Google Scholar]
- 36.Conrad DF, et al. 1000 Genomes Project Variation in genome-wide mutation rates within and between human families. Nat Genet. 2011;43(7):712–714. doi: 10.1038/ng.862. [DOI] [PMC free article] [PubMed] [Google Scholar]
- 37.Sanjuán R, Nebot MR, Chirico N, Mansky LM, Belshaw R. Viral mutation rates. J Virol. 2010;84(19):9733–9748. doi: 10.1128/JVI.00694-10. [DOI] [PMC free article] [PubMed] [Google Scholar]
- 38.Drake JW, Hwang CB. On the mutation rate of herpes simplex virus type 1. Genetics. 2005;170(2):969–970. doi: 10.1534/genetics.104.040410. [DOI] [PMC free article] [PubMed] [Google Scholar]
- 39.Cheng TP, Valentine MC, Gao J, Pingel JT, Yokoyama WM. Stability of murine cytomegalovirus genome after in vitro and in vivo passage. J Virol. 2010;84(5):2623–2628. doi: 10.1128/JVI.02142-09. [DOI] [PMC free article] [PubMed] [Google Scholar]
- 40.McVean GAT, et al. The fine-scale structure of recombination rate variation in the human genome. Science. 2004;304(5670):581–584. doi: 10.1126/science.1092500. [DOI] [PubMed] [Google Scholar]
- 41.Chan AH, Jenkins PA, Song YS. Genome-wide fine-scale recombination rate variation in Drosophila melanogaster. PLoS Genet. 2012;8(12):e1003090. doi: 10.1371/journal.pgen.1003090. [DOI] [PMC free article] [PubMed] [Google Scholar]
- 42.Begun DJ, Aquadro CF. Levels of naturally occurring DNA polymorphism correlate with recombination rates in D. melanogaster. Nature. 1992;356(6369):519–520. doi: 10.1038/356519a0. [DOI] [PubMed] [Google Scholar]
- 43.Smith JM, Haigh J. The hitch-hiking effect of a favourable gene. Genet Res. 1974;23(1):23–35. [PubMed] [Google Scholar]
- 44.Charlesworth B, Morgan MT, Charlesworth D. The effect of deleterious mutations on neutral molecular variation. Genetics. 1993;134(4):1289–1303. doi: 10.1093/genetics/134.4.1289. [DOI] [PMC free article] [PubMed] [Google Scholar]
- 45.Stephan W. Genetic hitchhiking versus background selection: The controversy and its implications. Philos Trans R Soc Lond B Biol Sci. 2010;365(1544):1245–1253. doi: 10.1098/rstb.2009.0278. [DOI] [PMC free article] [PubMed] [Google Scholar]
- 46.Jombart T, Devillard S, Balloux F. Discriminant analysis of principal components: A new method for the analysis of genetically structured populations. BMC Genet. 2010;11:94. doi: 10.1186/1471-2156-11-94. [DOI] [PMC free article] [PubMed] [Google Scholar]
- 47.Jombart T. adegenet: A R package for the multivariate analysis of genetic markers. Bioinformatics. 2008;24(11):1403–1405. doi: 10.1093/bioinformatics/btn129. [DOI] [PubMed] [Google Scholar]
- 48.Rands CM, Meader S, Ponting CP, Lunter G. 8.2% of the Human genome is constrained: Variation in rates of turnover across functional element classes in the human lineage. PLoS Genet. 2014;10(7):e1004525. doi: 10.1371/journal.pgen.1004525. [DOI] [PMC free article] [PubMed] [Google Scholar]
- 49.Snoeck J, Fellay J, Bartha I, Douek DC, Telenti A. Mapping of positive selection sites in the HIV-1 genome in the context of RNA and protein structural constraints. Retrovirology. 2011;8:87. doi: 10.1186/1742-4690-8-87. [DOI] [PMC free article] [PubMed] [Google Scholar]
- 50.Jia F, Lo N, Ho SYW. The impact of modelling rate heterogeneity among sites on phylogenetic estimates of intraspecific evolutionary rates and timescales. PLoS ONE. 2014;9(5):e95722. doi: 10.1371/journal.pone.0095722. [DOI] [PMC free article] [PubMed] [Google Scholar]
- 51.Zhou Y, Ushijima H, Frey TK. Genomic analysis of diverse rubella virus genotypes. J Gen Virol. 2007;88(Pt 3):932–941. doi: 10.1099/vir.0.82495-0. [DOI] [PubMed] [Google Scholar]
- 52.Hraber PT, Fischer W, Bruno WJ, Leitner T, Kuiken C. Comparative analysis of hepatitis C virus phylogenies from coding and non-coding regions: The 5′ untranslated region (UTR) fails to classify subtypes. Virol J. 2006;3(1):103. doi: 10.1186/1743-422X-3-103. [DOI] [PMC free article] [PubMed] [Google Scholar]
- 53.Goldner T, et al. The novel anticytomegalovirus compound AIC246 (Letermovir) inhibits human cytomegalovirus replication through a specific antiviral mechanism that involves the viral terminase. J Virol. 2011;85(20):10884–10893. doi: 10.1128/JVI.05265-11. [DOI] [PMC free article] [PubMed] [Google Scholar]
- 54.Puchhammer-Stöckl E, Görzer I. Human cytomegalovirus: An enormous variety of strains and their possible clinical significance in the human host. Future Virol. 2011;6(2):259–271. [Google Scholar]
- 55.Datta A, Jinks-Robertson S. Association of increased spontaneous mutation rates with high levels of transcription in yeast. Science. 1995;268(5217):1616–1619. doi: 10.1126/science.7777859. [DOI] [PubMed] [Google Scholar]
- 56.Park C, Qian W, Zhang J. Genomic evidence for elevated mutation rates in highly expressed genes. EMBO Rep. 2012;13(12):1123–1129. doi: 10.1038/embor.2012.165. [DOI] [PMC free article] [PubMed] [Google Scholar]
- 57.Liang Y, et al. Targeting the JMJD2 histone demethylases to epigenetically control herpesvirus infection and reactivation from latency. Sci Transl Med. 2013;5(167):167ra165. doi: 10.1126/scitranslmed.3005145. [DOI] [PMC free article] [PubMed] [Google Scholar]
- 58.Hill JM, et al. Inhibition of LSD1 reduces herpesvirus infection, shedding, and recurrence by promoting epigenetic suppression of viral genomes. Sci Transl Med. 2014;6(265):265ra169. doi: 10.1126/scitranslmed.3010643. [DOI] [PMC free article] [PubMed] [Google Scholar]
- 59.Burkala E, et al. Secondary structures as predictors of mutation potential in the lacZ gene of Escherichia coli. Microbiology. 2007;153(Pt 7):2180–2189. doi: 10.1099/mic.0.2007/005470-0. [DOI] [PubMed] [Google Scholar]
- 60.Kaplan NL, Hudson RR, Langley CH. The “hitchhiking effect” revisited. Genetics. 1989;123(4):887–899. doi: 10.1093/genetics/123.4.887. [DOI] [PMC free article] [PubMed] [Google Scholar]
- 61.Kim Y, Stephan W. Joint effects of genetic hitchhiking and background selection on neutral variation. Genetics. 2000;155(3):1415–1427. doi: 10.1093/genetics/155.3.1415. [DOI] [PMC free article] [PubMed] [Google Scholar]
- 62.Corbett-Detig RB, Hartl DL, Sackton TB. Natural selection constrains neutral diversity across a wide range of species. PLoS Biol. 2015;13(4):e1002112. doi: 10.1371/journal.pbio.1002112. [DOI] [PMC free article] [PubMed] [Google Scholar]
- 63.Gibson L, et al. Cytomegalovirus (CMV) IE1- and pp65-specific CD8+ T cell responses broaden over time after primary CMV infection in infants. J Infect Dis. 2007;195(12):1789–1798. doi: 10.1086/518042. [DOI] [PubMed] [Google Scholar]
- 64.Gibson L, et al. Human cytomegalovirus proteins pp65 and immediate early protein 1 are common targets for CD8+ T cell responses in children with congenital or postnatal human cytomegalovirus infection. J Immunol. 2004;172(4):2256–2264. doi: 10.4049/jimmunol.172.4.2256. [DOI] [PubMed] [Google Scholar]
- 65.Gibson L, et al. Reduced frequencies of polyfunctional CMV-specific T cell responses in infants with congenital CMV infection. J Clin Immunol. 2015;35(3):289–301. doi: 10.1007/s10875-015-0139-3. [DOI] [PMC free article] [PubMed] [Google Scholar]
- 66.Marchant A, et al. Mature CD8(+) T lymphocyte response to viral infection during fetal life. J Clin Invest. 2003;111(11):1747–1755. doi: 10.1172/JCI17470. [DOI] [PMC free article] [PubMed] [Google Scholar]
- 67.Sanchez-Merino V, Nie S, Luzuriaga K. HIV-1-specific CD8+ T cell responses and viral evolution in women and infants. J Immunol. 2005;175(10):6976–6986. doi: 10.4049/jimmunol.175.10.6976. [DOI] [PubMed] [Google Scholar]
- 68.Sanchez-Merino V, Farrow MA, Brewster F, Somasundaran M, Luzuriaga K. Identification and characterization of HIV-1 CD8+ T cell escape variants with impaired fitness. J Infect Dis. 2008;197(2):300–308. doi: 10.1086/524845. [DOI] [PubMed] [Google Scholar]
- 69.Griffiths P, et al. Desirability and feasibility of a vaccine against cytomegalovirus. Vaccine. 2013;31(Suppl 2):B197–B203. doi: 10.1016/j.vaccine.2012.10.074. [DOI] [PMC free article] [PubMed] [Google Scholar]
- 70.Ross SA, et al. Cytomegalovirus reinfections in healthy seroimmune women. J Infect Dis. 2010;201(3):386–389. doi: 10.1086/649903. [DOI] [PMC free article] [PubMed] [Google Scholar]
- 71.Britt W. Controversies in the natural history of congenital human cytomegalovirus infection: The paradox of infection and disease in offspring of women with immunity prior to pregnancy. Med Microbiol Immunol (Berl) 2015;204(3):263–271. doi: 10.1007/s00430-015-0399-9. [DOI] [PubMed] [Google Scholar]
- 72.Wang C, Zhang X, Bialek S, Cannon MJ. Attribution of congenital cytomegalovirus infection to primary versus non-primary maternal infection. Clin Infect Dis. 2011;52(2):e11–e13. doi: 10.1093/cid/ciq085. [DOI] [PubMed] [Google Scholar]
- 73.Chee MS, Lawrence GL, Barrell BG. Alpha-, beta- and gammaherpesviruses encode a putative phosphotransferase. J Gen Virol. 1989;70(Pt 5):1151–1160. doi: 10.1099/0022-1317-70-5-1151. [DOI] [PubMed] [Google Scholar]
- 74.Gawel D, Pham PT, Fijalkowska IJ, Jonczyk P, Schaaper RM. Role of accessory DNA polymerases in DNA replication in Escherichia coli: Analysis of the dnaX36 mutator mutant. J Bacteriol. 2008;190(5):1730–1742. doi: 10.1128/JB.01463-07. [DOI] [PMC free article] [PubMed] [Google Scholar]
- 75.Longley MJ, Nguyen D, Kunkel TA, Copeland WC. The fidelity of human DNA polymerase γ with and without exonucleolytic proofreading and the p55 accessory subunit. J Biol Chem. 2001;276(42):38555–38562. doi: 10.1074/jbc.M105230200. [DOI] [PubMed] [Google Scholar]
- 76.Appleton BA, et al. Crystal structure of the cytomegalovirus DNA polymerase subunit UL44 in complex with the C terminus from the catalytic subunit: Differences in structure and function relative to unliganded UL44. J Biol Chem. 2006;281(8):5224–5232. doi: 10.1074/jbc.M506900200. [DOI] [PubMed] [Google Scholar]
- 77.Appleton BA, Loregian A, Filman DJ, Coen DM, Hogle JM. The cytomegalovirus DNA polymerase subunit UL44 forms a C clamp-shaped dimer. Mol Cell. 2004;15(2):233–244. doi: 10.1016/j.molcel.2004.06.018. [DOI] [PubMed] [Google Scholar]
- 78.e X, et al. An E2F1-mediated DNA damage response contributes to the replication of human cytomegalovirus. PLoS Pathog. 2011;7(5):e1001342. doi: 10.1371/journal.ppat.1001342. [DOI] [PMC free article] [PubMed] [Google Scholar]
- 79.Xiaofei E, Kowalik TF. The DNA damage response induced by infection with human cytomegalovirus and other viruses. Viruses. 2014;6(5):2155–2185. doi: 10.3390/v6052155. [DOI] [PMC free article] [PubMed] [Google Scholar]
- 80.Sinzger C, et al. Cloning and sequencing of a highly productive, endotheliotropic virus strain derived from human cytomegalovirus TB40/E. J Gen Virol. 2008;89(Pt 2):359–368. doi: 10.1099/vir.0.83286-0. [DOI] [PubMed] [Google Scholar]
- 81.Ryckman BJ, Chase MC, Johnson DC. HCMV gH/gL/UL128-131 interferes with virus entry into epithelial cells: Evidence for cell type-specific receptors. Proc Natl Acad Sci USA. 2008;105(37):14118–14123. doi: 10.1073/pnas.0804365105. [DOI] [PMC free article] [PubMed] [Google Scholar]
- 82.Wang D, Shenk T. Human cytomegalovirus virion protein complex required for epithelial and endothelial cell tropism. Proc Natl Acad Sci USA. 2005;102(50):18153–18158. doi: 10.1073/pnas.0509201102. [DOI] [PMC free article] [PubMed] [Google Scholar]
- 83.Sinzger C, Digel M, Jahn G. Cytomegalovirus cell tropism. In: Shenk T, Stinski M, editors. Human Cytomegalovirus, Current Topics in Microbiology and Immunology. Vol 325. Springer; Berlin: 2008. pp. 63–83. [DOI] [PubMed] [Google Scholar]
- 84.Janeway C, Travers P, Walport M, Shlomchik M. 2001. Immunobiology: The Immune System in Health and Disease (Garland Science, New York), 5th Ed.
- 85.Sylwester AW, et al. Broadly targeted human cytomegalovirus-specific CD4+ and CD8+ T cells dominate the memory compartments of exposed subjects. J Exp Med. 2005;202(5):673–685. doi: 10.1084/jem.20050882. [DOI] [PMC free article] [PubMed] [Google Scholar]
- 86.Poole E, Wills M, Sinclair J. Human cytomegalovirus latency: Targeting differences in the latently infected cell with a view to clearing latent infection. New J Sci. 2014;2014:313761. [Google Scholar]
- 87.Emery VC, Cope AV, Bowen EF, Gor D, Griffiths PD. The dynamics of human cytomegalovirus replication in vivo. J Exp Med. 1999;190(2):177–182. doi: 10.1084/jem.190.2.177. [DOI] [PMC free article] [PubMed] [Google Scholar]
- 88.R Core Team 2014 R: A Language and Environment for Statistical Computing (R Foundation for Statistical Computing, Vienna). Available at www.R-project.org/
- 89.Tibshirani R, Walther G, Hastie T. Estimating the number of clusters in a data set via the gap statistic. J R Stat Soc Series B Stat Methodol. 2001;63(2):411–423. [Google Scholar]
- 90.Maechler M, Rousseeuw P, Struyf A, Hubert M, Hornik K. 2015. cluster: Cluster Analysis Basics and Extensions R package version 2.0.2.
- 91.Weir BS, Cockerham CC. Estimating F-statistics for the analysis of population structure. Evolution. 1984;38(6):1358–1370. doi: 10.1111/j.1558-5646.1984.tb05657.x. [DOI] [PubMed] [Google Scholar]
- 92.Underwood MA, Gilbert WM, Sherman MP. Amniotic fluid: Not just fetal urine anymore. J Perinatol. 2005;25(5):341–348. doi: 10.1038/sj.jp.7211290. [DOI] [PubMed] [Google Scholar]