

Significance
Macaque monkeys are often used as a model for the biological basis of human cognition. However, the two species last shared a common ancestor 25 million years ago, and in the intervening time the brain areas underlying cognition have likely evolved along different paths. We examined the similarities and differences of human and macaque brain areas underlying attention, a core cognitive ability, by recording brain activity while subjects of both species performed the same attention-demanding task. We found fundamental differences in the attention-related brain areas in the two species, including the complete absence, in monkeys, of a ventral-attention network present in humans. These results shed light on the evolution of the unique properties of the human brain.
Keywords: attention, human, monkey, fMRI, cortex
Abstract
Macaques are often used as a model system for invasive investigations of the neural substrates of cognition. However, 25 million years of evolution separate humans and macaques from their last common ancestor, and this has likely substantially impacted the function of the cortical networks underlying cognitive processes, such as attention. We examined the homology of frontoparietal networks underlying attention by comparing functional MRI data from macaques and humans performing the same visual search task. Although there are broad similarities, we found fundamental differences between the species. First, humans have more dorsal attention network areas than macaques, indicating that in the course of evolution the human attention system has expanded compared with macaques. Second, potentially homologous areas in the dorsal attention network have markedly different biases toward representing the contralateral hemifield, indicating that the underlying neural architecture of these areas may differ in the most basic of properties, such as receptive field distribution. Third, despite clear evidence of the temporoparietal junction node of the ventral attention network in humans as elicited by this visual search task, we did not find functional evidence of a temporoparietal junction in macaques. None of these differences were the result of differences in training, experimental power, or anatomical variability between the two species. The results of this study indicate that macaque data should be applied to human models of cognition cautiously, and demonstrate how evolution may shape cortical networks.
Selective attention operates in at least two functional modes: stimulus-driven (bottom-up) control of attention and goal-directed (top-down) (1). A recently proposed model by Corbetta et al., based on human neuroimaging and stroke studies, divides the control of attention between two cortical networks that underlie these modes of attention: the dorsal attention network, comprising the human frontal eye-fields (FEF) and intraparietal sulcus (IPS), and the ventral attention network, centered around an area at the temporoparietal junction (TPJ), located on the right hemisphere caudal supramarginal gyrus (Brodmann area 40 or area PFG/PF) and posterior superior temporal gyrus (Brodmann area 22) (2–4). This functionally defined ventral attention network area is referred to as the TPJ by Corbetta et al. (2) and TPJa in Mars et al. (5). Here, we refer to the functionally defined area as the TPJ, and reserve “temporoparietal junction” for the anatomical region in both species. According to this model, the dorsal attention network is activated when the subject sustains attention on a cued spatial location (6). The TPJ is activated only by the presentation of a behaviorally relevant stimulus that captures attention, with larger activations evoked by stimuli that are unexpected or cause reorienting of attention, and is deactivated when distracting stimuli are presented during sustained attention (6, 7). The conjunction of deactivation during sustained attention and activation during target detection functionally identifies the TPJ in event-related paradigms (6). Damage to the TPJ decreases the ability to detect and orient attention to novel stimuli presented, especially in the left hemifield, a condition known as visuospatial neglect (3). The dorsal and ventral attention networks interact with each other and with the visual cortex (2). During top-down or goal-directed control of attention, the dorsal attention network is activated, enhancing the selected stimulus in visual cortex, and the TPJ is deactivated, suppressing the orienting of attention to potentially distracting stimuli. However, when a behaviorally relevant stimulus is presented, the TPJ is activated, causing attention to be focused on this stimulus (2). However, these roles of the TPJ in the control of attention remain open to debate, partly because little is known about the TPJ’s connectivity or neuronal response properties.
The macaque has been used as a model for studying attention using invasive techniques that complement neuroimaging. There are established maps of cortico-cortical connectivity (8) and many electrophysiological studies of how these areas interact (9). As with all model systems, interspecies differences in these cortical systems are likely to exist. For example, the dorsal attention networks are assumed to be homologous between the two species, but basic facts, such as the number of areas within the dorsal network in each species, remain unknown. Furthermore, a ventral attention system has been functionally characterized only in humans, and the underlying architectonics and connections remain largely unknown. The macaque model might be used to examine these features, but in macaques the ventral attention system has not been functionally isolated and an anatomical homolog is unclear. Areas PF/7b or PFG seem most likely to be anatomically homologous to the human TPJ, but functionally these areas are more involved in polysensory integration and motor functions than in the control of attention (4, 10, 11). A recent functional connectivity study (12) found an area in the region of the macaque temporoparietal junction that shares a similar pattern of connectivity and right hemisphere lateralization with the human TPJ. However, this potential homolog covers multiple areas—7a, temporal parietal occipital caudal, and retroinsular—with no unifying function (13). However, another recent study finds the homolog of a human area adjacent to the TPJ involved in social cognition to be located in the mid-superior temporal sulcus of the macaque, far from the expected location at the macaque temporoparietal junction (14). Many details about the anatomy and physiology of the ventral attention network in either species remain unknown (3, 5).
To address the similarity of attention systems, we quantitatively compared humans and macaques using functional MRI (fMRI). We had both species attend to and search through a rapid serial visual presentation (RSVP) stream of images to detect a previously memorized target image. The task was designed to separate activation of visual areas and the dorsal attention network from deactivations of the TPJ during search (which combines sustained covert attention and visual processing of the RSVP stimuli), and activation of the TPJ by target detection (Fig. S1A) (2, 6). We used the same macaque data to report on topographic organization in the lateral intraparietal (LIP) previously (15).
Fig. S1.
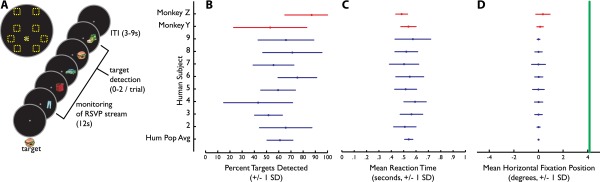
Paradigm and behavior. (A) After memorizing a target object, subjects were instructed to fixate on the central gray point while signaling detection of the target with a hand response device. Streams in each trial appeared in one of the locations outlined in yellow (Upper Left) in relation to the gray fixation point; the location was chosen randomly for each trial. (B–D) Comparison of behavioral performance between two monkey subjects (red) versus the human subjects (blue). Green line in D represents the inner edge of peripherally presented stimuli.
Results
Behavior.
Behavior in humans and macaques was closely matched. Fig. S1B shows that the range of detection rates in the eight human subjects approximated that of the two macaques. Although a button-box malfunction made the recorded reaction times for the humans in the MRI scanner unusable, the human reaction times recorded in the behavioral set-up (human mean 0.541 s, SD = 0.036) were similar to the macaque reaction times (macaque Y mean 0.539 s, SD = 0.062; macaque Z 0.484 s, SD = 0.048) (Fig. S1C). Fixation breaks in the human subjects were relatively infrequent (0.247 fixation breaks per trial, SD = 0.170) and relatively short (0.508 s per fixation break, SD = 0.080), and the average fixation position in humans was similar to the macaques (Fig. S1D).
Topography of Activation Maps.
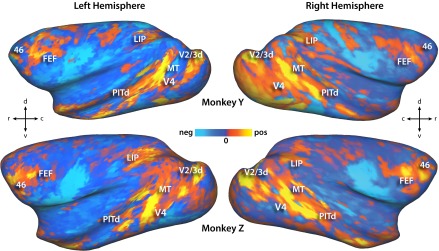
Qualitatively, the patterns of activation in both species showed broadly similar patterns but several clear differences. The two-stream trials in both species evoked activations in the visual cortex as well as attention-related areas of the parietal and frontal cortex. For each individual, we defined cortical surface frontoparietal regions of interest (ROIs) as contiguous activations that were consistent in most individual’s hemispheres (P < 0.05 Bonferroni multiple comparisons correction). These were then labeled by comparing locations to previous functional and anatomical studies in each species (see SI Materials and Methods for more details). This qualitative analysis revealed activation patterns that were highly consistent within species but markedly different between species (Fig. 1 and Figs. S2–S4). In the parietal lobe of all four monkey hemispheres there was only one focus of activity on the lateral bank of the IPS corresponding to the anatomical location of area LIP (Fig. 1 A and C). One additional focus of activity may have been present corresponding to area dorsal prelunate, but was not consistent and may have been V2/3d activity misprojected to the opposing sulcal bank. Similarly, Fig. 1C demonstrates that the activity on the medial bank of the IPS in Fig. 1B represents misprojection from the lateral bank. In most of the humans, however, two parietal foci were identified (Fig. 1B), one in the ventral portion of the IPS (vIPS, 13 of 16 hemispheres) and one in the posterior portion of the IPS (pIPS, 16 of 16 hemispheres). In the macaque prefrontal cortex, two adjacent foci were consistently identified in the four hemispheres: one on the anterior bank of the arcuate sulcus corresponding to the anatomical location of the FEF, and the other at the posterior end of the principal sulcus (area 46). Fig. 1 A and C also demonstrate potential foci in the inferior and posterior ramus of the arcuate sulcus, but neither of these were consistently present in all four hemispheres and did not match known oculomotor or attention areas in the macaque; these foci were not considered further. In the human prefrontal cortex, three foci were consistently identified (Fig. 1B): one at the junction of the precentral and superior frontal sulcus corresponding anatomically to what has been previously labeled as the FEF (14 of 16 hemispheres), one inferior to this location in the precentral sulcus (iPCS, 14 of 16 hemispheres), and another in the anterior portion in or near the inferior frontal sulcus (aIFS, 12 of 16 hemispheres). These gross qualitative differences in the functional anatomy of the dorsal attention network are reinforced by the quantitative measurements of areal characteristics described below.
Fig. 1.

(A) Areas activated by two-stream paradigm averaged across both hemispheres for all subjects of each species. Human labels derived from sulcal features, and macaque labels derived from ref. 13. Threshold set at z > 10 for both species (P << 0.05 multiple comparisons corrected). Human data on the Conte 69 right hemisphere cortical surface, and macaque data on the macaque F6 right hemisphere surface. (B) Overlap of human areas activated in the two-stream paradigm from all 16 hemispheres. Locations with more overlap have lighter shades of color. (C) Two-stream activations in both individual macaques, overlaid on their own epipolar plane image (EPI) volumes and cortical surface models (P < 0.05 multiple comparisons corrected). Blue lines on EPI volumes represent cortical surface outline. Black lines on surfaces represent architectonic borders in ref. 13, in which, area 8ac partially overlaps the functionally defined FEF, and area 46 is subdivided into 46p and 46v.
Fig. S2.

Group average of left hemisphere areas activated in two-stream paradigm in humans. Black outlines and yellow labels represent Brodmann areas associated with the language system (areas 22, 39, 40, 44, and 45) derived from ref. 66. Conventions are the same as in Fig. 1A.
Fig. S4.
Unthresholded z-statistic map of activity evoked by two-stream paradigm for each monkey subject. Each subject’s data are shown on own right hemisphere cortical surface generated from an average EPI image. Activity on posterior bank of the arcuate sulcus in monkey Z and medial bank of the inferior parietal sulcus of both monkeys reflect misprojection of activation data from the opposite bank of sulcus. Note that because the map is unthresholded, activations that appear to be bridging the ROIs are often far below the multiple-comparisons–corrected threshold used to define regions and likely represent noise.
Fig. S3.

Unthresholded z-statistic map of activity evoked by two-stream paradigm for four human subjects. Each subject’s data are shown on the Conte 69 right hemisphere cortical surface. Note that because map is unthresholded, activations that appear to be bridging the regions of interest are often far below the multiple-comparisons–corrected threshold used to define regions and likely represent noise.
Contralateral Preference.
For each subject, the foci from the two-stream data described above were used to create ROIs, from which were extracted time courses of blood-oxygen level-dependent (BOLD) activity evoked by the 12-s RSVP stream presentation for each of the six locations at 6.8° eccentricity. For each ROI, the average magnitude of activation was calculated for the three contralaterally and ipsilaterally presented streams over the peak activation period (3–12 s for the macaques and 6–15 s for the humans) (Fig. 2A). The contralateral and ipsilateral magnitudes were then used to calculate a contralaterality index [(contra − ipsi)/contra], with values of 1 indicating no evoked ipsilateral activity and 0 indicating equal contralateral- and ipsilateral-evoked activity (Fig. 2B). In both species, visual cortex ROIs [V1, V2/3v, V2/3d, V4, middle temporal (MT)] had contralateral index values near 1, indicating little or no ipsilateral-evoked activity in these areas. In macaques, frontoparietal areas were also strongly lateralized, with index values near 1 [repeated-measures ANOVA, hemisphere × ROI, ROI: F(7,7) = 1.57, P = 0.429]. However, in humans, the contralateral bias of the frontoparietal areas was significantly decreased [repeated-measures ANOVA, hemisphere × ROI, ROI: F(9,63) = 25.9, P < 10−15]. There was no significant effect of hemisphere on the contralateral preference in humans [hemisphere: F(1,7) = 0.15, P = 0.71].
Fig. 2.

(A) Time courses of contralaterally evoked versus ipsilaterally evoked activity in the parietal cortex (macaque LIP and human pIPS). (B) Contralateral preferences in humans and monkeys. Bars represent mean preference of all hemispheres, error bars SD, and each black dot a measurement from one hemisphere of one subject. Index value of 1 represents complete contralateral bias (no ipsilaterally evoked activity) and 0 equal magnitudes of contralaterally and ipsilaterally evoked activity. (C) Effect of overtraining on human contralateral preferences in three subjects.
To determine whether the contralateral index differences in the two species were a result of differences in training history, three of the human subjects trained for an additional ∼19 h over 3–4 mo on the single-stream task, and were then scanned once again while performing that task. Using the same ROIs as in the pretraining session, contralateral index values were recalculated from the posttraining scanning session (Fig. 2C). On average, the contralateral index did not change significantly with training [repeated-measures ANOVA, pre/posttraining × hemisphere × ROI, main effect of training: F(1,2) = 0.144, P = 0.741]. In fact, in 9 of 10 regions the average degree of contralateral preference decreased with training.
Functional Localization of the TPJ.
In humans, the TPJ node of the ventral attention system was defined on the group average map on the Conte 69 surface as voxels on or near the right hemisphere supramarginal gyrus that were both significantly deactivated while searching for targets and significantly activated by the detection of targets (Fig. 3). This resulted in an ROI with similar shape and location as defined in Shulman et al. (6); a comparison of Fig. 3 with Fig. S5 demonstrates the hemispheric asymmetry in the TPJ seen in Shulman et al. and other studies (6, 7, 12). In macaques, the same conjunction failed to reveal any similar ROI on or around the inferior parietal lobule or superior temporal gyrus in either hemisphere at the group level (Fig. 3A).
Fig. 3.

Activations/deactivation evoked by search and detection. Fixed-effects group average maps of right hemisphere cortical voxels activated and deactivated while (A) searching for or (B) detecting a target in the one-stream paradigm. Threshold set at P < 0.05 multiple comparisons corrected [z > 4.9 for humans (Upper) and z > 4.7 for macaques (Lower)]. The green is the TPJ region of interest formed by the conjunction of the underlying search deactivations in A and detection activations in B on the right supramarginal gyrus in humans and projected to macaques.
Fig. S5.

Group average of left hemisphere areas activated and deactivated by (A) search for and (B) detection of a target in one-stream paradigm in both species. Conventions are the same as in Fig. 3. Green circles in the upper row show where anatomically the TPJ would be expected to be located if in the left hemisphere. Unlike the right hemisphere, this left hemisphere region has only mild search deactivation and no activation by detection.
To verify that the group average human TPJ ROI reliably represented the TPJ in each individual, this ROI was projected to each individual’s surface and used to extract time courses of BOLD activity. These time courses revealed substantial deactivation evoked by visual search and activation evoked by target detection in all eight subjects (Fig. 4A). Because no similar ROI could be defined in the macaques, the human surface ROI was projected to the macaque atlas surface using the interspecies registration algorithm in CARET (www.nitrc.org/projects/caret). The projected ROI overlapped with macaques areas 7op and PA in the Lewis and van Essen atlas (13). This surface ROI was then used to extract BOLD time courses of activity for visual search and detection using the same procedure in macaques and humans. These time courses did not reliably reveal either search deactivations or target activations in any of the four macaque hemispheres, with the exception of one left hemisphere deactivation; this is in contrast to finding search deactivations and detection activations in all human subjects. In the three subjects that underwent additional training and a posttraining scan, the search deactivations and detection activations did not change substantially after training (Fig. 4B). A recent study used resting-state functional connectivity to isolate a potential macaque TPJ homolog (12) (Fig. 3). BOLD time courses extracted from the ROI revealed by this method, which overlaps considerably with the projected human ROI, also show neither the search activations nor detection activations that would be expected of a macaque homolog of human TPJ (Fig. S6).
Fig. 4.

(A) Time courses of TPJ transient activations evoked by target detection (orange) and sustained deactivations evoked by 12 s of search (blue), both realigned to start at 0 s. Human time courses derived from conjunction ROI shown in Fig. 3, and macaque time courses derived from projected ROI shown in Fig. 3. (B) Time courses of sustained search deactivations and transient target detection activations from TPJ before (solid lines) and after (dotted lines) training sessions.
Fig. S6.

Time courses of detection activations and search deactivations from candidate TPJ homolog detailed in ref. 12. Conventions are the same as in Fig. 4A.
SI Materials and Methods
Animal Subjects, Surgery, and Experimental Set-up.
Two male monkeys (Y and Z, Macaca mulatta, 5–7 kg) were used in accordance with the Washington University Animal Studies Committee and the NIH Guide for the Care and Use of Laboratory Animals. Before training, surgery was performed in aseptic conditions under isofluorane anesthesia to implant a head restraint device. The head restraint was constructed from polyetheretherketone and was anchored to the skull with dental acrylic and 10–16 ceramic screws (4-mm diameter; Thomas Recording).
The monkeys were trained to perform two RSVP tasks (the single- and two-stream tasks, see below for details) in a set-up that simulated the fMRI scanner environment. In both the training set-up and scanner, the animal sat horizontally in a “sphinx” position inside a cylindrical monkey chair with its head restraint rigidly fixed to a head holder on the chair (Primatrix). An LCD projector (BENQ) was used to present visual stimuli on a screen that was positioned at the end of the bore, 75 cm from the monkeys’ eyes. A flexible plastic waterspout was positioned near the animal’s mouth for delivery of liquid rewards.
Each monkey was trained to place its hand inside a box that was affixed to the front of the chair under the monkey’s chin, and to rapidly withdraw and replace its paw when a target appeared (see below). Both monkeys used their right hand. These movements were detected by a photoelectric sensor (Banner). Eye movements were monitored by an infrared tracking system (ISCAN). A camera positioned outside of the bore monitored the left eye through a hole in the bottom of the screen. The eye was illuminated with an IR light source positioned 5–6 cm below the monkey’s left eye. The eye-position coordinates were relayed to the behavioral control system, which consisted of two linked computers running custom software. The behavioral control system recorded the state of the photoelectric sensor, eye position, and scanner synchronization signals, presented visual stimuli synchronized to the MRI scanner, and controlled reward timing. The behavioral control system also removed blink artifacts online. For further details about the experimental set-up, see ref. 64.
Trials began when the monkey positioned its gaze to within 1.3° horizontally and 3.5° vertically of the fixation point for the single-stream task (1.1° horizontally and 5° vertically for the two-stream task) and inserted its hand into the hand-response device. The eye-window was longer in the vertical axis to accommodate residual artifacts in the eye-tracking signal stemming from blinks and transient pupillary constriction.
At the beginning of a scanning session, a block of instruction trials lasting ∼20 min acquainted the monkey with the session’s target and allowed the animal to practice discriminating the target from the distractors. Occasionally the previous session’s target was eliminated as a distractor if the monkey repeatedly signaled detection of this object during the practice trials.
Once the scanning session began, if the monkey broke visual fixation or removed its hand from the device at any time other than the 1-s response interval (such as when falsely detecting a target), the display was blanked and the trial aborted. After a short pause of 2–9 s, during which no stimuli were presented and no rewards could be obtained, the fixation point reappeared and a new trial began. If the monkey made several errors in a row, the pause was made longer (15–60 s). These time-outs provide a disincentive for the animal to break fixation or produce false positive responses. Failures to detect presented targets (misses) were not punished. Animals were water-restricted before each session, and correct responses (hits) were rewarded with a fluid reward (details below).
Human Subjects and Experimental Set-up.
Eight human subjects (ages 20–34 y, three female) were recruited in accordance with the New York State Psychiatric Institute Institutional Review Board. All subjects self-identified as right-handed, had normal or corrected-to-normal visual acuity, and indicated no clinically significant neurological history. Informed consent was obtained from each subject. The subjects were trained to perform the two same two RSVP tasks as the monkeys in a 1-h behavioral session in a darkened room. Their heads were positioned 56 cm from the display (Digital Equipment Corporation) by a chin rest, and they indicated their responses by pressing a key on the keyboard. The stimuli were generated and responses recorded by MATLAB (Mathworks) with Psychtoolbox (65) extensions installed on a desktop computer (Apple). Each subject performed both tasks at various speeds to practice the task and to generate behavioral data, which was then used to set the difficulty of the task in the scanner.
Scanning sessions followed the training session on a separate day. The subjects were asked not to consume fluids for 6 h before the scanning session. This was done to match the water-restricted state of the animals in their experiments. Subjects lay on their backs in the MRI scanner, viewing the display screen 107-cm away at the back of the bore through a mirror attached to the head coil. The stimuli were displayed on a translucent screen by an LCD projector (Epson). Button-press responses were recorded by an MRI-compatible response device (Current Designs). Eye-movements were monitored by an infrared tracking system (ISCAN), with the camera mounted on the head coil. Subjects received liquid rewards through plastic tubing mounted on the head coil; liquid delivery was controlled by a solenoid valve. A laptop (Apple) running MATLAB (Mathworks) with Psychtoolbox extensions (65) controlled the stimulus display, recorded responses, and synchronized the display with the MRI scanner through the USB interface. It also recorded eye-movements and controlled the delivery of juice rewards through a digital-analog input/output device connected via USB (Measurement Computing).
Single-Stream RSVP Display and Task.
The RSVP task used here tests subjects’ ability to detect a briefly presented target embedded in a rapid stream of distractors. This task requires attention both to the target features and to the location where the stream is presented. At the beginning of a trial, a white fixation point (0.3° × 0.3°) appeared vertically below the center of the screen (4.2° below for macaques, 5° for humans). The RSVP stream, 12 s in duration, consisted of bitmap images drawn from a pool of 42 color illustrations of everyday objects (Barry’s Clipart Server, www.barrysclipart.com/en/). For each session, one of the 42 objects was selected at random as the target and the other 41 were used as distractors (Fig. S1). Distractors were shown in random order with the constraint that the same image was not shown twice in a row. For each BOLD run, the time that a single object was on the screen (stimulus duration) was set as short as possible while maintaining the subject’s detection rate between 50% and 100%. For the monkeys, the range of durations was 95–300 ms and for the humans it was 90–130 ms.
In the single-stream experiment, for each 12-s trial the stream appeared randomly in any one of nine preselected locations: the fovea (in which case the fixation point was superimposed over the stimuli) or one of eight peripheral locations. There were six peripheral locations at 6.8° eccentricity; starting at the right-horizontal meridian the polar angle positions were 0°, 45°, 135°, 180°, 225°, and 315°. The two additional peripheral locations were at 15.6° eccentricity in the upper visual field at 18° to the left or right of the upper vertical meridian. Objects at the fovea were 3.6° × 3.6° in size, near peripheral objects were 5.3° × 5.3°, and far peripheral objects were 5.9° × 5.9°. For the monkeys, near and far locations were presented in separate sessions, with foveal locations included in both.
The subjects’ task was to detect the one object designated as the target while maintaining fixation on the central point. Half of all trials had a single target embedded within the first 10.5 s in the 12-s stream. One-quarter of trials had no target (catch trials). In the remaining one-quarter of trials, the target appeared twice within the single stream, once within the first 4 s and again from 1 to 6 s later. After the target appeared, the subject had 1 s to indicate detection by pressing the designated button. Following each 12-s stream, the subject was required to maintain fixation for the 3-, 6-, or 9-s duration of the intertrial interval.
Upon each successful target detection, the subject was rewarded with a few drops of water. Another reward was given during the intertrial interval of about one in six trials. For the monkeys an additional reward was sometimes added to the beginning of the stream, and the number and relative sizes of rewards were adjusted to encourage fixation as well as maximize hits and minimize false-positives. Reward sizes started at ∼0.1 mL and increased over the course of each session as the subject became more sated.
Two-Stream RSVP Display and Task.
The two-stream task was similar to the single-stream task, except for a few key characteristics and parameters. Two RSVP streams of 4.6° × 4.6° in size were presented simultaneously along the horizontal meridian: one 5.3° to the left of the fixation point and the other 5.3° to the right. Stream duration was 60 s, and a target appeared at 3-, 6- or 9-s intervals with ±1.5 s of jitter. For the monkeys, stimulus duration varied between 45 ms and 225 ms, and for humans between 150 ms and 300 ms. In monkeys the duration was set during initial practice (“warm-up”) trials such that the monkey detected 50–90% of the presented targets, and in humans the duration was decreased 25–50 ms every other run. One of the streams was designated as the “target” stream and all targets appeared in that stream. This designation cued the subject to attend to the target stream. For monkeys, the target stream changed randomly every scanning session, and for the humans the target stream alternated with each BOLD run. Monkeys learned during the warm-up trials which stream had been chosen as the target, whereas human subjects were instructed verbally before each run. The reward system was similar to that of the one-stream task. A 30-s fixation interval occurred following each 60-s RSVP period, during which the subject was rewarded once or twice every 3–9 s for maintaining fixation.
Monkey Data Collection.
Functional and anatomical data were collected in a Siemens 3T Allegra MRI scanner (Siemens Medical Solutions). High-resolution structural images were collected in separate sessions, during which the animal was chemically restrained (10 mg/kg ketamine, 0.6 mg/kg xylazine, 0.05 mg/kg atropine). T1-weighted images were acquired using a magnetization-prepared rapid-acquisition gradient-echo pulse sequence [MP-RAGE; (0.5 mm)3 isotropic resolution, flip angle = 7°, six acquisitions] and a volumetric transmit and receive coil (16 cm inner diameter; Primatrix).
Functional data were collected using a gradient-echo echo-planar pulse sequence sensitive to BOLD contrast (T2*) (T2* evolution time = 25 ms, flip angle = 90°) and a transmit-receive surface coil (13-cm inner diameter; Primatrix). The coil fit around each animal’s head post and was saddle-shaped to provide more extensive brain coverage compared with a planar surface coil. Fifty-two coronal slices, each with a square field of view (96 × 96 mm, 64 × 64 base resolution, dorsal-to-ventral phase-encoding) and a thickness of 1.5 mm, were obtained using contiguous, interleaved acquisition, and a volume repetition time (TR) of 3,000 ms. This scanning protocol was chosen to cover the whole brain at an isotropic spatial resolution of (1.5 mm)3. The first four volumes of each run were excluded from the analyses to allow for the equilibration of longitudinal magnetization. A T2-weighted image to facilitate registration of anatomical and functional images was acquired at the beginning of one session using a turbo spin-echo sequence [TSE; (1 × 1 × 1.5mm)3 resolution, flip-angle = 150°, single acquisition].
In the single-stream polar angle experiment, up to 200 volumes were acquired in each fMRI run. The session was ended in midrun if the monkey stopped performing the task. A total of 7,500 frames in 39 runs across 7 sessions were collected from monkey Y, and 6,700 frames in 39 runs across 18 sessions from monkey Z. Overall, about 100 successfully completed trials were collected for each of the seven stream positions in each monkey. In the eccentricity experiment, 23 runs (4,400 frames) were collected in monkey Y and 30 runs (5,900 frames) in monkey Z, resulting in about 100 and 200 trials per position in monkeys Y and Z, respectively.
In the two-stream experiment, up to 1,409 frames (71 min) were collected in a single run. The scanner was stopped if the stimulus parameters needed adjustment or if the monkey stopped working. In monkey Y, a total of 5,800 frames were collected in 11 runs in 9 scanning sessions, and in monkey Z a total of 7,100 frames were collected in 8 runs in 8 scanning sessions.
Human Data Collection.
Functional and anatomical data were collected in a Philips 3T Achieva MRI scanner with a SENSE 8-channel volumetric head coil (Philips Healthcare) in two separate sessions. In the first session high-resolution structural images were collected along with the two-stream BOLD-EPI data, and in the second session the single-stream BOLD-EPI data were collected. T1-weighted images were acquired using a MP-RAGE [(1 mm)3 isotropic resolution, flip angle = 8°, three acquisitions]. Functional data were collected using a gradient-echo echo-planar pulse sequence sensitive to BOLD contrast (T2*) (T2* evolution time = 30 ms, flip angle = 77°). Fifty-four transverse slices, each with a square field of view (192 × 192 mm, 64 × 64 base resolution) and a thickness of 3 mm, were obtained using contiguous, interleaved acquisition, and a volume TR of 3,000 ms. This scanning protocol was chosen to cover the whole brain at an isotropic spatial resolution of (3 mm)3. A T2-weighted image was acquired at the beginning of one session using a TSE sequence [(3 mm)3 resolution, flip-angle = 90°, single acquisition]. In the two-stream experiment, eight BOLD-EPI runs were collected from each subject, with each run consisting of 90 volumes (4.5 min). In the single-stream experiment, 12 BOLD-EPI runs were collected from each subject, with each run consisting of 100 volumes (5 min).
Overtraining.
To determine whether the differences in the length of training for the task between the two species would affect the results, three human subjects received extensive additional training in the behavioral set-up after the initial scanning sessions were completed. They were then scanned again while performing the single-stream task. Each of the three subjects performed six 5-min runs of the single-stream task (30 min) two to three times per week for 3 to 4 mo, for a total of 18–19 h. Training started with long stimulus durations (200–300 ms) to guarantee 100% performance, and then the stimulus durations were adjusted automatically after each run. Durations were shortened by 10 ms if the previous detection rate exceeded 90% and lengthened by 10 ms if the rate fell below 50%. Subjects were paid $10 per hour of training plus $0.05 per correctly detected target to approximate the effect of rewarding the monkeys with drops of water or juice. At the end of the training period, BOLD-fMRI data were collected once again during performance of the single stream task, following the same protocol as in the earlier session.
Preprocessing.
Each reconstructed fMRI run produced a 4D (x, y, z, time) dataset that was passed through a sequence of unsupervised processing steps using in-house software. The data were first corrected for asynchronous slice acquisition using sync interpolation, and also for odd-even slice intensity differences resulting from the interleaved acquisition of slices. Correction factors were then calculated: (i) for within- and across-run movement using a six-parameter rigid body realignment algorithm; and (ii) by aligning the frames from each session first to each other, second to the subject’s own T2-weighted image, and then to an atlas volume using a 12-parameter affine registration algorithm. For monkeys, the macaque F6 atlas was used (sumsdb.wustl.edu/sums/archivelist.do?archive_id=6636170). For humans, a Talairach atlas registered average of 12 separate individuals was used. To optimize cross-session alignment within each monkey, an additional recursive alignment algorithm was implemented. Atlas-aligned images representing each session were averaged together, and then each session’s representative image was realigned to this average using the 12-parameter affine registration. These newly aligned images were then averaged together and realigned to the T2-weighted image, which in turn was used as the target for the next realignment iteration. This procedure was repeated until the change in variance averaged across all of the voxels across all of the sessions asymptotically approached a minimum. Finally, the final atlas-registration matrix and the above-calculated normalization and movement-corrections factors were reapplied to the data in a single resampling step.
For the monkeys, all runs of the polar angle and eccentricity experiments in which the monkey successfully completed more than 50% of the presented trials (that is, reached the end of the trial without a fixation break or false-positive response) were included in the analysis (37 of 39 runs in monkey Y, 35 of 39 runs in monkey Z). For monkey Y, this criterion was relaxed for the eccentricity data; because of the problems this monkey had with maintaining fixation during the task, all runs were included. In the two-stream experiment behavior was uniformly good and no runs/sessions were excluded because of poor performance.
Projection of the Statistical Data to the Cortical Surface.
For each subject, a cortical surface model was created by segmenting the gray and white matter of the subject’s own anatomical image. For the monkeys, the anatomical image used was an atlas-aligned average of multiple EPI images segmented with CARET (brainvis.wustl.edu/wiki/index.php/Main_Page), and for the humans the T1 (MPRAGE) was segmented using FreeSurfer (Athinoula A. Martinos Center for Biomedical Imaging, Harvard-Massachusetts Institute of Technology, Boston). The cortical surface was then flattened and registered to an atlas surface (macaque F6 for the monkeys and PALS for the humans, brainvis.wustl.edu/wiki/index.php/Caret:Atlases) with a nonlinear surface-warping algorithm using standard anchors representing the fundi of sulci and other common anatomical features. To project statistical maps (see below) onto the flattened, registered cortical surface, each point on the surface was painted with the z-score of the intersected voxel.
Group comparisons and averages were calculated on the species’ respective atlas surfaces. For cross-species comparisons, group-averaged human data were projected from the PALS atlas to the macaque F6 surface using CARET (58).
Analysis of Contralateral Preference.
Statistical maps of activity were created using a general linear model implemented with in-house software. To create z-statistic maps, each event-type was modeled as an independent regressor formed by convolving a γ-function with a 2-s delay with a boxcar of a specified duration. In the single-stream experiment, the included regressors were a 12-s event for corresponding to the stream at each location, a target detection event for each location (0.5 s), missed targets for each location (0.5 s), and bonus rewards (0.5 s) (Fig. S1). The eccentricity trials (those with stream locations at 15.6° eccentricity) and foveal trials were excluded from this analysis. In the monkeys, RSVP streams cut short by errors were coded separately from completed (12-s) streams, and regressors were included for the fixation break and false-detection error pauses. If the punish period lasted longer than 21 s, those frames were excluded from the analysis. In the two-stream experiment, reward and punish events were similarly modeled. Separate regressors were included for streams that were 60 ± 3 s in duration and streams of less than 60 s because of errors. In addition, “target-left” and “target-right” streams were coded separately. Linear trend and baseline terms were also included as regressors. Voxel-wise z-maps were calculated for regressors in the model and for the differences between regressors. To estimate the time course of the response to a given event, separate models were created in which no response was assumed for the fixed-length event-types.
To consistently define visually driven regions in all hemispheres of both species, we defined ROIs on the cortical surface projection in each hemisphere, starting with tiles significantly activated in the two-stream experiment relative to the fixation baseline. Significance was defined as P < 0.05 (Bonferroni multiple comparisons correction: human z > 4.9, monkey z > 4.7) with the exception of human subject 6, whose data were thresholded at P < 0.05 uncorrected because of an anatomical abnormality causing excessive noise in the BOLD-EPI data. On these cortical maps, we then selected peak activations in or near sulcal boundaries corresponding to known attention-related areas. In humans, the labels and locations of these ROIs were the vIPS in the fundus of the posterior IPS, pIPS near the posterior end of the IPS on the superior parietal lobule, FEF at the junction of the superior frontal and precentral sulci, iPCS inferior to this junction in the precentral sulcus, and aIFS in the anterior extent of the inferior frontal sulcus. In monkeys, the labels and locations were LIP on the lateral bank of the IPS, FEF on the anterior bank of the arcuate sulcus, and area 46 on the posterior portion of the principal sulcus. All tiles continuous with these peak activations and with z-values above the multiple comparisons threshold were included in the ROI. In the case of adjoining ROIs, this minimum threshold for inclusion was raised until the ROIs separated. In both species, we also defined visual cortex ROIs using retinotopic maps defined by the single-stream data. In the monkeys, because of poor registration of the cortical surface projection (see previous section) with the gray matter in the BOLD-EPI images, a separate set of ROIs were calculated with a conjunction of criteria from each of the two experiments: (i) voxels significantly activated in the two-stream experiment relative to the fixation baseline, and (ii) voxels significantly activated in the single-stream polar angle experiment by streams in one hemifield relative to the other. The voxels in (ii) were isolated by summing the contrast maps generated by the three left visual-field stream regressors, subtracting from this the sum of the three right visual-field stream regressors, and taking the absolute value of the result. The two maps that resulted from (i) and (ii) were each thresholded at P < 0.05 (Bonferroni multiple comparisons correction: z > 4.9). The logical conjunction of the two thresholded maps (“and” operation) was used to mask the fixed-effects volume map from each hemisphere. ROIs were created in each subject from this masked volume using an automated peak-search algorithm that grouped together voxels within 6 mm of a local maximum. Labels for the ROIs were determined by comparing the activation maps with the partitioning schemes available on the PALS surface atlas in CARET.
For each ROI, we extracted the average time-course of the response to the RSVP stream at each location in the polar angle experiment. Time points 3–6 for humans and 2–5 for monkeys were averaged together for each location to create an estimate of the BOLD-response magnitude. For each ROI, these magnitudes were averaged together for the three contralateral locations, and also for the three ipsilateral locations. These magnitudes were used to create an index of the preference for the contralateral visual field over the ipsilateral field [(contra − ipsi)/contra], which was then averaged across the same ROIs from all of the hemispheres with in each species.
Analysis of the TPJ.
For this analysis, we projected the statistical maps from the single-stream experiment for both the 12-s RSVP stream and the 0.5-s detection regressors to the atlas cortical surface for each human subject as described above. The eccentricity trials (those with stream locations at 15.6° eccentricity) were excluded from this analysis; all other trials with stream locations at the fovea and at 6.8° eccentricity were included. The maps were then averaged across the group with fixed-effects and then thresholded on the cortical surface at P < 0.05 (Bonferroni multiple comparisons corrected). A group average TPJ ROI was then defined as the surface tiles on the posterior bank of the supramarginal gyrus that were significantly deactivated by the RSVP streams and significantly activated by the detection events only in the right hemisphere (6). The resulting ROI was then projected back to the individual’s own volume space via their own surface and used to extract time courses of activation for both the RSVP and detection events. A similar conjunction was attempted in the macaque, but no surface tiles survived the conjunction in the region of the inferior parietal lobule or superior temporal gyrus. To confirm this negative finding, the human ROI was projected to the macaque surface via the human–macaque projection feature available in CARET, which relies on anchoring the registration of the two species’ surfaces with strongly homologous cortical areas, such as V1, M1, and MT. This projected ROI was then projected back to the individual macaque’s volume in both hemispheres via their own surface and used to extract the BOLD time courses for both the RSVP and detection events.
Eye Position Analysis.
To quantify the eye position during trials in both species, we plotted histograms of the horizontal and vertical components of each subject’s eye-position calculated in 40-ms bins. The components were plotted as the horizontal and vertical displacement toward the presented stream. The resulting eye-position distributions were used to calculate the mean and SD of the mean horizontal and vertical eye-position for each subject in the single-stream experiments. In addition, the fixation breaks in human subjects were tallied post hoc in a semiautomated fashion from the stored eye-traces [after automated artifact removal implemented in MATLAB (Mathworks)] by counting the number of times saccades greater than 1° were made away from the fixation point toward the target stream.
Discussion
We compared BOLD-fMRI responses of the attention and visual systems of eight humans and two macaques using identical tasks, and found three consistent differences between species. First, although dorsal frontoparietal regions were activated in both species, in monkeys there were fewer independent activation foci in both the parietal and prefrontal cortex. Second, both species demonstrate contralateral bias in visual and dorsal frontoparietal regions, but the bias is much weaker in the human frontoparietal cortex. Finally, we found no evidence of an area in macaques located in the temporoparietal region having the functional properties of human TPJ (as measured by our task), despite robust and consistent modulation of activity of the TPJ in humans with the same task. All results were highly consistent within species and highly divergent between species. They likely do not reflect a verbalization strategy in humans, as left hemisphere language areas were not activated (SI Discussion and Fig. S2). The results also cannot be attributed to differences in performance, training, or reward structure (Fig. S7), and therefore likely reflect species differences that have evolved in the 25 million years since the most recent common ancestor (18).
Fig. S7.

Group average activations and deactivations evoked by the receipt of a reward during the fixation (intertrial) interval in the one-stream paradigm for both species in both hemispheres. Threshold at P < 0.05 multiple comparisons corrected for both species (z > 4.9 for humans and z > 4.7 for macaques). Note that major focus of activity in both species is in the ventral somatomotor cortex, likely representing sensations and movement related to licking and swallowing. Greater extent of activation in macaques versus humans likely represents a combination of differences in power in the two species and movement artifacts.
Expansion of the Dorsal Attention System in Humans.
These evolutionary changes result in fundamental differences in the architecture of the attention systems. Even in the dorsal attention system, which is broadly similar in the two species, a property as basic as the number of areas involved in a visual search task differs between species. Although the macaque cortical sheet is about 10× smaller in area than humans and about 1-mm thinner (19), the 8× finer fMRI sampling resolution in macaques (1.5-mm isotropic) compared with humans (3-mm isotropic) was sufficient to resolve foci from adjacent cortical areas, which are typically several millimeters in width and length (further discussed in SI Discussion). In addition, despite individual variation, and even with the small number of subjects, there was a remarkable degree of consistency within species. The main conclusions of this study are consistent with those of previous human imaging studies (20–23) and macaque anatomy and electrophysiology (9, 13, 24).
Two previous oculomotor studies comparing macaques and humans using BOLD-fMRI also found more individual foci of activity in humans than in macaques (25, 26). The sustained working memory task in Kagan et al. (25) is comparable to our covert attention and search task. That study, like ours, found a single parietal focus of activation in macaques versus multiple foci in humans. The macaque activation was in the anatomically and functionally defined LIP (13, 27), whereas the human activations were along the IPS on the superior parietal lobule (pIPS in our study) and in the ventral IPS (vIPS in our study), in keeping with other studies (2). The pIPS in our study has been previously labeled human LIP (20) based on topographic organization, but recent studies in humans and macaques have found that there may be more parietal areas along the IPS in humans than macaques (23), and that topographic organization in the macaque LIP may be more complex than previously thought (27), making it difficult to identify parietal area homologies in the two species.
In the macaque frontal cortex, we, in agreement with both Koyama et al. (26) and Kagan et al. (25), find two foci of activity: one in the anterior bank of the arcuate sulcus, corresponding to the FEF (28), and one in the posterior portion of the principal sulcus, corresponding to posterior area 46 (29). This finding is in contrast to the three foci of activity typically observed in the human frontal cortex (21–23). The most anterior of these three—the aIFS—is likely homologous to macaque area 46 (29). It is unclear the degree to which the two remaining foci of activity—which we labeled FEF and iPCS—are homologous to the macaque FEF. Both Koyama et al. (26) and Kagan et al. (25), along with multiple human fMRI studies (23), have found that these two areas are activated in attention, oculomotor, and spatial working memory tasks. However, usually only the superior of these two areas is labeled as the human FEF (2, 22, 23), despite this and other inconsistencies between the two species (30). The functional differences between the human FEF and iPCS also remain unclear. Amiez and Petrides described a premotor eye-field in humans ventral to the area we have labeled the FEF, but iPCS in our study was more inferior than their proposed premotor eye-fields, which in our task were not consistently activated in macaques (31). Jerde and Curtis recently found that the FEF (sPCS in their study) exhibited more sustained activity than iPCS during oculomotor, attention, and spatial working memory tasks (21); in the context of our results, this finding suggests that the iPCS has evolved as a prefrontal cortical area in humans, but is not present in macaques. Although the expansion of the functionally defined dorsal attention network in humans versus macaques will require confirmation by comparative connectional anatomy studies, the findings appear to reflect the evolution of new or enhanced attentional abilities—possibly as a result of different evolutionary pressures—further evidence of which is discussed below.
Differences in Contralateral Preference Reflect Separate Evolution of Human and Macaque Attention Systems.
Differences in the contralateral preference of the dorsal attention network provide further evidence of divergent evolution. These results corroborate previous human/macaque fMRI studies of the oculomotor system (25, 26). In the present study we show that the contralateral preference diverges between humans and macaques as one ascends the visual hierarchy into the attention system (22, 32). The divergence is most pronounced in those regions that have most expanded in humans compared with macaques over the course of evolution (33). These regions include the superior parietal and dorsolateral prefrontal cortex, perhaps indicating that selective pressures on the two species resulted in different organizational schemes (34).
The interspecies differences in contralateral preference may reflect changes in the magnocellular pathway that have been noted at multiple levels of visual processing (16). The evolution of the magnocellular pathway may underlie changes in the distribution and size of receptive fields (resulting from differences in lower-level visual input) and differences in the sharing of information between dorsal frontoparietal areas and other higher-level areas. Single-unit recording studies in the macaque find that neurons in frontoparietal attention areas have large receptive fields, and that ∼10–45% of cells have ipsilateral receptive fields (28, 35–38) as well as summation of signals from both hemifields (39, 40). In humans, both of these properties may have been extended. Studies of M (parasol) retinal ganglion cell dendritic fields and perceptive field sizes (thought to reflect M retinal ganglion cell receptive field sizes) have found both to be larger in humans than macaques (16, 17). Given that receptive field size tends to increase at each level of visual processing (41), it is possible that receptive field sizes in the frontoparietal cortex are also larger in humans versus macaques.
In humans the mechanisms for sharing signals between hemispheres and hemifields may have been elaborated in the service of brain lateralization (25), as well as improved flexibility in the use of information from both hemispheres in the control of attention (32). In macaques, selective pressures may have killed sharing of information between hemispheres in favor of faster processing (42). Increased interhemisphere information sharing in humans may underlie the global precedence when processing complex stimuli with both global and local features, whereas in monkeys local features have precedence (16, 43). The global precedence suggests that sharing of information between hemifields is automatic in humans.
The seeming contradiction between macaque single-unit studies showing a significant proportion of cells with ipsilateral fields and macaque BOLD-fMRI from this study and from Kagan et al. (25), showing strong contralateral preferences, may reflect an unequal distribution of receptive fields within frontoparietal areas representing the contralateral and ipsilateral hemifields. In the single-unit studies, many of the receptive fields classified as ipsilateral tend to be along the vertical meridian (37) (Fig. 3), meaning that most receptive field locations are centered in the contralateral hemifield (but see ref. 44). In our study the stimuli were located 4.8–6.8° away from the vertical meridian and likely stimulated few ipsilateral receptive fields in any of the frontoparietal areas. Studies using a combination of single-unit recording and BOLD-fMRI (or LFP recording) in these areas will be needed to better understand these differences.
TPJ: Uniquely Human?
There is some debate about how the TPJ is involved in the control of attention—whether it is involved in the shifting of attention (45) or in the evaluation of “oddball” stimuli (46)—but converging evidence from neglect studies implicate the TPJ in some aspect of attentional control (2, 3). The functional absence of the TPJ in macaques therefore represents a profound interspecies difference in the control of attention. The RSVP task used in this experiment robustly and consistently isolates the TPJ node of the ventral attention network in humans (6), and so the lack of analogous modulation in macaques is telling. The failure to produce deactivation was not because of a lack of power; robust deactivations were seen in the ventral motor cortex that were similar to the human subjects. Nor was it because of a potential difference in activity evoked by maintaining fixation; in humans the TPJ deactivations depend on attention and working memory load (47, 48) and it would be difficult to argue that the attention or working memory loads in the fixation and visual search task intervals were equivalent for macaques but not humans.
Additional support for this interspecies difference again comes from the phenomenon of global precedence in humans, which appears to require the right TPJ (49). The functional absence of the TPJ, combined with a dorsal attention system with smaller receptive fields and less interhemispheric communication, may explain the local precedence found in monkeys (16). These differences may be less surprising given how much more cortical surface area is devoted to the inferior parietal lobule at the junction of the parietal and temporal lobes in humans versus macaques, even after correcting for scale differences (33), but nevertheless indicate that the human attention systems differ substantially from macaques, and that the macaque model may be inadequate for some aspects of human vision and attention. There is evidence, however, that although the current task reveals species differences in the function of the temporoparietal junction, the underlying circuitry may have similar connectivity. Histological studies indicate that areas at or near the temporoparietal junction in macaques project to the ventro- and dorsolateral prefrontal cortex (particularly areas 7a and PFG), just as functional connectivity studies suggest that the human TPJ is connected to regions of the dorsolateral prefrontal cortex (2, 4). This temporoparietal-prefrontal cortex circuitry may be conserved in the two species, but used for different purposes. With a single synapse separating multimodal/associative temporoparietal cortex and prefrontal cortex, this circuit architecture may underlie the fast transfer of information from associative sensory areas to prefrontal working memory/task control centers. In macaques, this fast circuit could allow the animal to quickly navigate its arboreal environment (42). Neurons in area 7a, which is on the inferior parietal lobule near the temporoparietal junction and overlaps somewhat with the candidate homolog from Mantini et al. (12), play a role in the detection of new onset high-contrast stimuli outside of the focus of attention (50) as well as processing complex visual stimuli, such as optic flow patterns (51) and maze navigation (52). In humans, the ventral attention system also may be involved in navigating an environment of complex social cues rather than physical objects (53). In addition to their role in the control of attention, areas in or near the human TPJ are involved in the processing of faces (54), gaze direction (55), and in determining the intentions of others (56); these abilities are unique or enhanced in humans compared with chimpanzees and other nonhuman primates (53). Accordingly, the human TPJ is less sensitive to the types of sudden-onset, high-contrast, task-irrelevant stimuli that macaques may need to detect to escape predators or dodge obstacles, and more sensitive to the behavioral relevance of a stimulus (2), a characteristic that might be useful in social situations for picking out subtle changes in visual features, like eye-gaze direction. Differences in selective pressures may have caused this circuit to be adapted for different purposes in the two species.
SI Discussion
Differences in Spatial Resolution.
One potential confound is the difference in the spatial resolution of the BOLD-fMRI data in the two species, resulting in erroneous conclusions about the number of activitation foci in the two species. The cortical sheet is about 10× larger in humans versus macaques, so given the 8× difference in voxel size used in the two species (3-mm isotropic in humans vs. 1.5-mm isotropic in macaques), the resolution relative to brain size in macaques is about half of that in the humans. However, we do not believe that this confounds the comparison of numbers of activated areas in both species for several reasons.
First, as detailed in Discussion, our findings of two parietal and three frontal foci activated in humans versus one and two in macaques have been corroborated by a number of human and monkey studies (25, 21–23, 26). Second, despite the fact that the sampling resolution relative to the gray matter volume/surface is coarser in the monkeys than the humans, there is still ample resolution to separate foci within and outside of FEF. Per Felleman and van Essen's (59) definition of FEF available on the macaque F6 atlas surface, the surface area of FEF is 92 mm2 or ∼19 × 8.5 mm in its greatest superior-inferior and rostral-caudal extents. The resolution used in the macaques here is more than sufficient to resolve whether activity took place within or outside of this area; assuming a 1.5-mm cortical thickness (a conservative estimate) at 1.53 mm3, this means that the FEF contains 41 voxels, and is about 12.7 × 5.7 voxels in size. To demonstrate that two closely spaced activations could be resolved in the monkey data, we looked at the distance between the two frontal foci in the macaque. The average distance between the foci highlighted in orange in Fig. S4 for the four individuals was 7.78 mm with a 95% confidence interval of 1.86, leaving at least a four-voxel (6 mm) distance between the nodes. Even with the Gaussian full-width half-maximum two-voxel kernel used to smooth the data, the minimum four-voxel distance between these two foci demonstrates that there is more than adequate resolution to separate two closely spaced foci of activity.
Third, another perspective on sampling resolution is that the voxel sizes should roughly match that of the species cortical thickness, leading to reduced partial volume sampling across sulci or gyri. From this perspective, the sampling resolution is coarser in humans than in macaques. The human cortex is 1.5- to 3.5-mm thick, with a median of roughly 2.6 mm, and the macaque cortex is 1- to 3-mm thick, with a median of about 1.75 mm (19). Therefore, the sampling resolution is finer in the macaques (being near the thin end of the cortical thickness distribution) versus humans (being near the thick end of the distribution). Finally, the imaging resolutions used in this human–monkey comparison are comparable to those used in other similar studies (25, 26).
Interspecies Differences in Strategy?
We believe that the results detailed in this report are because of phylogenetic differences; however, it is important to consider the possibility that the two species used different strategies to perform the same task, which may confound the interspecies comparisons. One possibility is that the clip-art images used in this experiment have different meanings for the two species, which could result in a different pattern of activations. This could be a problem if we were examining areas involved in object identification, but the areas studied in these experiments in both species have been extensively characterized in their roles in the control of spatial attention (2, 9, 23, 24). Furthermore, it would be difficult to argue that contralateral bias in the dorsal attention network is affected by object identity, which has not been described previously.
In humans the TPJ has been characterized by experiments using everything from abstract shapes (2) to numbers and letters (6, 7) to auditory tones (60), and is believed to be part of a circuit involved in the detection of any behaviorally relevant event. Failure to activate or deactivate the TPJ in monkeys for the detection of or search for a clearly behaviorally relevant event, such as the presence of a target, is a clear sign of the functional differences of the monkey inferior parietal lobule.
Potential differences in strategy might also include the use of verbalization in humans in the memorization and search for the target, a strategy not available to macaques. However, if this was the case, in humans we would expect to see language areas activated in the different phases of the task (61). In Figs. S2 and S5, none of the Brodmann areas associated with Broca’s and Wernicke’s areas (areas 22, 39, 40, 44, and 45) are activated for either the search or detection phases of the trials. The only area potentially overlapping with a language area is the aIFS, which in some partitioning schemes covers the dorsal portion of area 44, but per Fedorenko et al. (62), the dorsal portion of Broca’s area likely belongs to a separate “domain-general” area that is not language-specific. Moreover, verbalization is not optimal or even possible at the ∼100-ms stimulus durations used in these experiments (63).
Another possible confounding factor is the significance of the liquid rewards delivered to the subjects. Although we endeavored to ensure that both species were thirsty for the rewards by restricting fluids before the experiments, any remaining differences in the significance of the rewards would only affect a comparison of the detection activations between the two species; the search activations/deactivations should not have been affected by the salience of the reward because these regressors did not include any reward events. Rewards were given for detection and for maintenance of fixation, and were included as separate regressors in the general linear model. Comparing the activity evoked by rewards given for the maintenance of fixation in the two species reveals the same pattern of activations, dominated by the ventral motor cortex and the opercular cortex inferior to the motor cortex (Fig. S7). Even if comparing the detection events between the two species was confounded by differences in the salience of the rewards, the lack of a ventral attention system in monkeys is still supported by the lack of deactivations evoked by the search for targets.
Why the Small Sample Size Is Likely Not a Confound.
Visual system properties have a higher degree of individual variability in humans versus macaques (16). Despite this, we have found properties that are consistent within all subjects of both species and that differ between the species. Moreover, the properties that we quantified in the attention systems of both species have been corroborated in numerous previous studies (25, 21–23, 26, 64). Therefore, we believe that our results are general enough to make a claim of phylogenetic differences. Moreover, much of our knowledge of interspecies differences is based on similar numbers of subjects, and these conclusions have largely been consistent across studies despite the small sample size of each study (25, 26).
Conclusions
The results of this study demonstrate that a task that clearly and consistently defines areas involved in attentional control in humans evokes a starkly different pattern of activations and deactivations in macaques. Given the similarity in task performance in the two species, these differences cannot be easily dismissed as confounded or artifactual. We have interpreted these findings in light of the Corbetta/Shulman model (2), but the observation that the task evokes patterns of activations and deactivations, both within and outside of human attention areas that differ markedly from the macaque, is independent of this model. These results suggest that the human and macaque attention systems have evolved in the service of the unique challenges facing each species, and in humans this has meant an elaboration of the attention control system to support new and unique functions that may underlie expanded social cognition abilities.
Although enough similarities exist to support continued use of macaques as a model system for humans, these fundamental differences in function demonstrate a need for a cautious application of findings from one species to the other (16). This study does not rule out the possibility of homologies not revealed by the task used here: other tasks may reveal shared functional features between the temporoparietal junction and dorsal attention areas in the two species. At a deeper level, these results demonstrate how differing selective pressures may adapt existing neural architectures, such as the TPJ, to perform novel functions. Understanding the evolutionary origin of these circuits will better constrain investigations of human cognitive systems, as well as provide insight into how exactly humans differ from other primates.
Materials and Methods
Two macaques were used in accordance with the Washington University Animal Studies Committee and the NIH Guide for the Care and Use of Laboratory Animals (57). Eight human subjects were recruited and provided written informed consent in accordance with the New York State Psychiatric Institute Institutional Review Board. Subjects of both species performed the same visual search task while BOLD images were acquired in a 3T scanner, with 1.5-mm isotropic voxels in the macaque and 3-mm isotropic voxels in the humans, both with a TR of 3,000 ms. The task required the subjects to maintain fixation while covertly attending to a 12-s RSVP stream of colorful images of objects presented in the periphery or at fixation in one location at a time, and to indicate with a hand response when they had detected a previously memorized target. Eye-tracking was used to ensure fixation, and both species were rewarded for fixation and correct detection with small drops of liquid. The BOLD images were corrected for motion and other artifacts through a series of automated image-processing programs, and were then analyzed with a general linear model that separated the sustained response to the RSVP stream from the transient response to target detections. The resulting z-statistic maps were projected to 3D representations of the subject’s own cortical surface and then to the species appropriate atlas surface (CARET, www.nitrc.org/projects/caret/). Group averaging was performed on the cortical surface to make group ROIs, and human ROIs were projected to the macaque atlas via the interspecies cortical surface deformation procedure outlined in (58). For more details, please see SI Materials and Methods.
Acknowledgments
We thank Justin Baker, Gordon Shulman, Avi Snyder, Mark Mcavoy, Jack Grinband, Tom Malone, David Borton, Marcel Fremont, Jason Vytlacil, Matt Reiter, Erin Reid, Larry Wald, Wim Vanduffel, David van Essen, and Donna Dierker for aiding this study and comments on the manuscript. This study was supported in part by the Levy Foundation (G.H.P.), the American Psychiatric Foundation (G.H.P.), National Institute of Mental Health (NIMH) Grants MH086466-04 and MH018870-25 (to G.H.P.), National Eye Institute Grant EY012135 (to L.H.S.), NIMH Grant MH102471 (to L.H.S.), and NIMH Grant MH096482 (to M.C.).
Footnotes
The authors declare no conflict of interest.
This article is a PNAS Direct Submission.
This article contains supporting information online at www.pnas.org/lookup/suppl/doi:10.1073/pnas.1420395112/-/DCSupplemental.
References
- 1.Posner MI. Orienting of attention. Q J Exp Psychol. 1980;32(1):3–25. doi: 10.1080/00335558008248231. [DOI] [PubMed] [Google Scholar]
- 2.Corbetta M, Patel G, Shulman GL. The reorienting system of the human brain: From environment to theory of mind. Neuron. 2008;58(3):306–324. doi: 10.1016/j.neuron.2008.04.017. [DOI] [PMC free article] [PubMed] [Google Scholar]
- 3.Bartolomeo P. Attention Disorders After Right Brain Damage. Springer; New York: 2014. [Google Scholar]
- 4.Margulies DS, Petrides M. Distinct parietal and temporal connectivity profiles of ventrolateral frontal areas involved in language production. J Neurosci. 2013;33(42):16846–16852. doi: 10.1523/JNEUROSCI.2259-13.2013. [DOI] [PMC free article] [PubMed] [Google Scholar]
- 5.Mars RB, et al. Connectivity-based subdivisions of the human right “temporoparietal junction area”: Evidence for different areas participating in different cortical networks. Cereb Cortex. 2012;22(8):1894–1903. doi: 10.1093/cercor/bhr268. [DOI] [PubMed] [Google Scholar]
- 6.Shulman GL, et al. Quantitative analysis of attention and detection signals during visual search. J Neurophysiol. 2003;90(5):3384–3397. doi: 10.1152/jn.00343.2003. [DOI] [PubMed] [Google Scholar]
- 7.Serences JT, et al. Coordination of voluntary and stimulus-driven attentional control in human cortex. Psychol Sci. 2005;16(2):114–122. doi: 10.1111/j.0956-7976.2005.00791.x. [DOI] [PubMed] [Google Scholar]
- 8.Lewis JW, van Essen DC. Corticocortical connections of visual, sensorimotor, and multimodal processing areas in the parietal lobe of the macaque monkey. J Comp Neurol. 2000;428(1):112–137. doi: 10.1002/1096-9861(20001204)428:1<112::aid-cne8>3.0.co;2-9. [DOI] [PubMed] [Google Scholar]
- 9.Squire RF, Noudoost B, Schafer RJ, Moore T. Prefrontal contributions to visual selective attention. Annu Rev Neurosci. 2013;36:451–466. doi: 10.1146/annurev-neuro-062111-150439. [DOI] [PubMed] [Google Scholar]
- 10.Dong WK, Chudler EH, Sugiyama K, Roberts VJ, Hayashi T. Somatosensory, multisensory, and task-related neurons in cortical area 7b (PF) of unanesthetized monkeys. J Neurophysiol. 1994;72(2):542–564. doi: 10.1152/jn.1994.72.2.542. [DOI] [PubMed] [Google Scholar]
- 11.Rizzolatti G, Sinigaglia C. The functional role of the parieto-frontal mirror circuit: Interpretations and misinterpretations. Nat Rev Neurosci. 2010;11(4):264–274. doi: 10.1038/nrn2805. [DOI] [PubMed] [Google Scholar]
- 12.Mantini D, Corbetta M, Romani GL, Orban GA, Vanduffel W. Evolutionarily novel functional networks in the human brain? J Neurosci. 2013;33(8):3259–3275. doi: 10.1523/JNEUROSCI.4392-12.2013. [DOI] [PMC free article] [PubMed] [Google Scholar]
- 13.Lewis JW, van Essen DC. Mapping of architectonic subdivisions in the macaque monkey, with emphasis on parieto-occipital cortex. J Comp Neurol. 2000;428(1):79–111. doi: 10.1002/1096-9861(20001204)428:1<79::aid-cne7>3.0.co;2-q. [DOI] [PubMed] [Google Scholar]
- 14.Mars RB, Sallet J, Neubert F-X, Rushworth MFS. Connectivity profiles reveal the relationship between brain areas for social cognition in human and monkey temporoparietal cortex. Proc Natl Acad Sci USA. 2013;110(26):10806–10811. doi: 10.1073/pnas.1302956110. [DOI] [PMC free article] [PubMed] [Google Scholar]
- 15.Patel GH, et al. Topographic organization of macaque area LIP. Proc Natl Acad Sci USA. 2010;107(10):4728–4733. doi: 10.1073/pnas.0908092107. [DOI] [PMC free article] [PubMed] [Google Scholar]
- 16.Preuss TM. 2003. in The Primate Visual System, eds Kaas JH, Collins CE (CRC Press, Boca Raton, FL), pp 231–259.
- 17.Dacey DM, Petersen MR. Dendritic field size and morphology of midget and parasol ganglion cells of the human retina. Proc Natl Acad Sci USA. 1992;89(20):9666–9670. doi: 10.1073/pnas.89.20.9666. [DOI] [PMC free article] [PubMed] [Google Scholar]
- 18.Stewart CB, Disotell TR. Primate evolution—In and out of Africa. Curr Biol. 1998;8(16):R582–R588. doi: 10.1016/s0960-9822(07)00367-3. [DOI] [PubMed] [Google Scholar]
- 19.Glasser MF, et al. Improved Cortical Myelin Maps in Humans, Chimpanzees, and Macaques Allow Identification of Putative Areal Homologies. Society for Neuroscience; New Orleans, LA: 2012. [Google Scholar]
- 20.Sereno MI, Pitzalis S, Martínez A. Mapping of contralateral space in retinotopic coordinates by a parietal cortical area in humans. Science. 2001;294(5545):1350–1354. doi: 10.1126/science.1063695. [DOI] [PubMed] [Google Scholar]
- 21.Jerde TA, Curtis CE. Maps of space in human frontoparietal cortex. J Physiol Paris. 2013;107(6):510–516. doi: 10.1016/j.jphysparis.2013.04.002. [DOI] [PMC free article] [PubMed] [Google Scholar]
- 22.Jack AI, et al. Changing human visual field organization from early visual to extra-occipital cortex. PLoS One. 2007;2(5):e452. doi: 10.1371/journal.pone.0000452. [DOI] [PMC free article] [PubMed] [Google Scholar]
- 23.Silver MA, Kastner S. Topographic maps in human frontal and parietal cortex. Trends Cogn Sci. 2009;13(11):488–495. doi: 10.1016/j.tics.2009.08.005. [DOI] [PMC free article] [PubMed] [Google Scholar]
- 24.Bisley JW, Goldberg ME. Attention, intention, and priority in the parietal lobe. Annu Rev Neurosci. 2010;33:1–21. doi: 10.1146/annurev-neuro-060909-152823. [DOI] [PMC free article] [PubMed] [Google Scholar]
- 25.Kagan I, Iyer A, Lindner A, Andersen RA. Space representation for eye movements is more contralateral in monkeys than in humans. Proc Natl Acad Sci USA. 2010;107(17):7933–7938. doi: 10.1073/pnas.1002825107. [DOI] [PMC free article] [PubMed] [Google Scholar]
- 26.Koyama M, et al. Functional magnetic resonance imaging of macaque monkeys performing visually guided saccade tasks: Comparison of cortical eye fields with humans. Neuron. 2004;41(5):795–807. doi: 10.1016/s0896-6273(04)00047-9. [DOI] [PubMed] [Google Scholar]
- 27.Patel GH, Kaplan DM, Snyder LH. Topographic organization in the brain: Searching for general principles. Trends Cogn Sci. 2014;18(7):351–363. doi: 10.1016/j.tics.2014.03.008. [DOI] [PMC free article] [PubMed] [Google Scholar]
- 28.Sommer MA, Wurtz RH. Composition and topographic organization of signals sent from the frontal eye field to the superior colliculus. J Neurophysiol. 2000;83(4):1979–2001. doi: 10.1152/jn.2000.83.4.1979. [DOI] [PubMed] [Google Scholar]
- 29.Petrides M. Lateral prefrontal cortex: Architectonic and functional organization. Philos Trans R Soc Lond B Biol Sci. 2005;360(1456):781–795. doi: 10.1098/rstb.2005.1631. [DOI] [PMC free article] [PubMed] [Google Scholar]
- 30.Tehovnik EJ, Sommer MA, Chou IH, Slocum WM, Schiller PH. Eye fields in the frontal lobes of primates. Brain Res Brain Res Rev. 2000;32(2-3):413–448. doi: 10.1016/s0165-0173(99)00092-2. [DOI] [PubMed] [Google Scholar]
- 31.Amiez C, Petrides M. Anatomical organization of the eye fields in the human and non-human primate frontal cortex. Prog Neurobiol. 2009;89(2):220–230. doi: 10.1016/j.pneurobio.2009.07.010. [DOI] [PubMed] [Google Scholar]
- 32.Szczepanski SM, Konen CS, Kastner S. Mechanisms of spatial attention control in frontal and parietal cortex. J Neurosci. 2010;30(1):148–160. doi: 10.1523/JNEUROSCI.3862-09.2010. [DOI] [PMC free article] [PubMed] [Google Scholar]
- 33.Orban GA, van Essen D, Vanduffel W. Comparative mapping of higher visual areas in monkeys and humans. Trends Cogn Sci. 2004;8(7):315–324. doi: 10.1016/j.tics.2004.05.009. [DOI] [PubMed] [Google Scholar]
- 34.Krubitzer L. In search of a unifying theory of complex brain evolution. Ann N Y Acad Sci. 2009;1156:44–67. doi: 10.1111/j.1749-6632.2009.04421.x. [DOI] [PMC free article] [PubMed] [Google Scholar]
- 35.Barash S, Bracewell RM, Fogassi L, Gnadt JW, Andersen RA. Saccade-related activity in the lateral intraparietal area. II. Spatial properties. J Neurophysiol. 1991;66(3):1109–1124. doi: 10.1152/jn.1991.66.3.1109. [DOI] [PubMed] [Google Scholar]
- 36.Funahashi S, Bruce CJ, Goldman-Rakic PS. Mnemonic coding of visual space in the monkey’s dorsolateral prefrontal cortex. J Neurophysiol. 1989;61(2):331–349. doi: 10.1152/jn.1989.61.2.331. [DOI] [PubMed] [Google Scholar]
- 37.Rainer G, Asaad WF, Miller EK. Memory fields of neurons in the primate prefrontal cortex. Proc Natl Acad Sci USA. 1998;95(25):15008–15013. doi: 10.1073/pnas.95.25.15008. [DOI] [PMC free article] [PubMed] [Google Scholar]
- 38.Everling S, Tinsley CJ, Gaffan D, Duncan J. Filtering of neural signals by focused attention in the monkey prefrontal cortex. Nat Neurosci. 2002;5(7):671–676. doi: 10.1038/nn874. [DOI] [PubMed] [Google Scholar]
- 39.Falkner AL, Krishna BS, Goldberg ME. Surround suppression sharpens the priority map in the lateral intraparietal area. J Neurosci. 2010;30(38):12787–12797. doi: 10.1523/JNEUROSCI.2327-10.2010. [DOI] [PMC free article] [PubMed] [Google Scholar]
- 40.Miller EK, Cohen JD. An integrative theory of prefrontal cortex function. Annu Rev Neurosci. 2001;24:167–202. doi: 10.1146/annurev.neuro.24.1.167. [DOI] [PubMed] [Google Scholar]
- 41.van Essen DC, Zeki SM. The topographic organization of rhesus monkey prestriate cortex. J Physiol. 1978;277:193–226. doi: 10.1113/jphysiol.1978.sp012269. [DOI] [PMC free article] [PubMed] [Google Scholar]
- 42.van Schaik CP, Isler K, Burkart JM. Explaining brain size variation: From social to cultural brain. Trends Cogn Sci. 2012;16(5):277–284. doi: 10.1016/j.tics.2012.04.004. [DOI] [PubMed] [Google Scholar]
- 43.Parron C, Fagot J. Comparison of grouping abilities in humans (Homo sapiens) and baboons (Papio papio) with the Ebbinghaus illusion. J Comp Psychol. 2007;121(4):405–411. doi: 10.1037/0735-7036.121.4.405. [DOI] [PubMed] [Google Scholar]
- 44.Platt ML, Glimcher PW. Response fields of intraparietal neurons quantified with multiple saccadic targets. Exp Brain Res. 1998;121(1):65–75. doi: 10.1007/s002210050438. [DOI] [PubMed] [Google Scholar]
- 45.Shulman GL, et al. Interaction of stimulus-driven reorienting and expectation in ventral and dorsal frontoparietal and basal ganglia-cortical networks. J Neurosci. 2009;29(14):4392–4407. doi: 10.1523/JNEUROSCI.5609-08.2009. [DOI] [PMC free article] [PubMed] [Google Scholar]
- 46.Han SW, Marois R. Functional fractionation of the stimulus-driven attention network. J Neurosci. 2014;34(20):6958–6969. doi: 10.1523/JNEUROSCI.4975-13.2014. [DOI] [PMC free article] [PubMed] [Google Scholar]
- 47.Shulman GL, Astafiev SV, McAvoy MP, d’Avossa G, Corbetta M. Right TPJ deactivation during visual search: functional significance and support for a filter hypothesis. Cereb Cortex. 2007;17(11):2625–2633. doi: 10.1093/cercor/bhl170. [DOI] [PubMed] [Google Scholar]
- 48.Todd JJ, Fougnie D, Marois R. Visual short-term memory load suppresses temporo-parietal junction activity and induces inattentional blindness. Psychol Sci. 2005;16(12):965–972. doi: 10.1111/j.1467-9280.2005.01645.x. [DOI] [PubMed] [Google Scholar]
- 49.Huberle E, Karnath H-O. The role of temporo-parietal junction (TPJ) in global Gestalt perception. Brain Struct Funct. 2012;217(3):735–746. doi: 10.1007/s00429-011-0369-y. [DOI] [PubMed] [Google Scholar]
- 50.Constantinidis C, Steinmetz MA. Neuronal responses in area 7a to multiple-stimulus displays: I. Neurons encode the location of the salient stimulus. Cereb Cortex. 2001;11(7):581–591. doi: 10.1093/cercor/11.7.581. [DOI] [PubMed] [Google Scholar]
- 51.Raffi M, Siegel RM. A functional architecture of optic flow in the inferior parietal lobule of the behaving monkey. PLoS One. 2007;2(2):e200. doi: 10.1371/journal.pone.0000200. [DOI] [PMC free article] [PubMed] [Google Scholar]
- 52.Crowe DA, Chafee MV, Averbeck BB, Georgopoulos AP. Neural activity in primate parietal area 7a related to spatial analysis of visual mazes. Cereb Cortex. 2004;14(1):23–34. doi: 10.1093/cercor/bhg088. [DOI] [PubMed] [Google Scholar]
- 53.Sherwood CC, Subiaul F, Zawidzki TW. A natural history of the human mind: Tracing evolutionary changes in brain and cognition. J Anat. 2008;212(4):426–454. doi: 10.1111/j.1469-7580.2008.00868.x. [DOI] [PMC free article] [PubMed] [Google Scholar]
- 54.Pinsk MA, et al. Neural representations of faces and body parts in macaque and human cortex: A comparative fMRI study. J Neurophysiol. 2009;101(5):2581–2600. doi: 10.1152/jn.91198.2008. [DOI] [PMC free article] [PubMed] [Google Scholar]
- 55.Pelphrey KA, Viola RJ, McCarthy G. When strangers pass: Processing of mutual and averted social gaze in the superior temporal sulcus. Psychol Sci. 2004;15(9):598–603. doi: 10.1111/j.0956-7976.2004.00726.x. [DOI] [PubMed] [Google Scholar]
- 56.Decety J, Lamm C. The role of the right temporoparietal junction in social interaction: How low-level computational processes contribute to meta-cognition. Neuroscientist. 2007;13(6):580–593. doi: 10.1177/1073858407304654. [DOI] [PubMed] [Google Scholar]
- 57. Committee on Care and Use of Laboratory Animals (1996) Guide for the Care and Use of Laboratory Animals (Natl Inst Health, Bethesda), DHHS Publ No (NIH) 85-23.
- 58.van Essen DC. Organization of visual areas in macaque and human cerebral cortex. The Visual Neurosciences 2004 , eds Chalupa LM, Werner JS (MIT Press, Cambridge, MA), pp 507–521. [Google Scholar]
- 59.Felleman DJ, van Essen DC. Distributed hierarchical processing in the primate cerebral cortex. Cerebral Cortex. 1991;1:1–47. doi: 10.1093/cercor/1.1.1-a. [DOI] [PubMed] [Google Scholar]
- 60.Linden DE, et al. The functional neuroanatomy of target detection: An fMRI study of visual and auditory oddball tasks. Cereb Cortex. 1999;9(8):815–823. doi: 10.1093/cercor/9.8.815. [DOI] [PubMed] [Google Scholar]
- 61.Petersen SE, Fox PT, Posner MI, Mintun M, Raichle ME. Positron emission tomographic studies of the cortical anatomy of single word processing. Nature. 1989;331(6157):585–589. doi: 10.1038/331585a0. [DOI] [PubMed] [Google Scholar]
- 62.Fedorenko E, Duncan J, Kanwisher N. Language-selective and domain-general regions lie side by side within Broca’s area. Curr Biol. 2012;22(21):2059–2062. doi: 10.1016/j.cub.2012.09.011. [DOI] [PMC free article] [PubMed] [Google Scholar]
- 63.Fraisse P. Motor and verbal reaction times to words and drawings. Psychon Sci. 1968;12(6):235–236. [Google Scholar]
- 64.Baker JT, Patel GH, Corbetta M, Snyder LH. Distribution of activity across the monkey cerebral cortical surface, thalamus and midbrain during rapid, visually guided saccades. Cereb Cortex. 2006;16(4):447–459. doi: 10.1093/cercor/bhi124. [DOI] [PubMed] [Google Scholar]
- 65.Brainard DH. The psychophysics toolbox. Spat Vis. 1997;10(4):433–436. [PubMed] [Google Scholar]
- 66.van Essen DC, Glasser MF, Dierker DL, Harwell J, Coalson T. Parcellations and hemispheric asymmetries of human cerebral cortex analyzed on surface-based atlases. Cereb Cortex. 2012;22(10):2241–2262. doi: 10.1093/cercor/bhr291. [DOI] [PMC free article] [PubMed] [Google Scholar]