Significance
Lipid metabolism is a growing area of biochemical research because understanding these pathways could lead to treatments for metabolic disorders such as obesity and type 2 diabetes. To study lipid metabolism, researchers need tools to identify and quantitate glycerides, the main component of animal fat. However, it can be difficult to tell one glyceride apart from another subtly different glyceride using current analytical methods such as mass spectrometry. Thus, we developed a method of discriminating glycerides using an array of cross-reactive proteins in conjunction with pattern recognition algorithms. By incorporating an olefin metathesis pretreatment step, we were able to distinguish glyceride regio- and stereoisomers and to predict these structural features. Finally, we achieved quantitation of glycerides in mixtures.
Keywords: array sensing, glyceride, chemometrics, serum albumin, differential sensing
Abstract
Glycerides are of interest to the areas of food science and medicine because they are the main component of fat. From a chemical sensing perspective, glycerides are challenging analytes because they are structurally similar to one another and lack diversity in terms of functional groups. Furthermore, because animal and plant fat consists of a number of stereo- and regioisomeric acylglycerols, their components remain challenging analytes for chromatographic and mass spectrometric determination, particularly the quantitation of species in mixtures. In this study, we demonstrated the use of an array of cross-reactive serum albumins and fluorescent indicators with chemometric analysis to differentiate a panel of mono-, di-, and triglycerides. Due to the difficulties in identifying the regio- and stereochemistry of the unsaturated glycerides, a sample pretreatment consisting of olefin cross-metathesis with an allyl fluorescein species was used before array analysis. Using this simple assay, we successfully discriminated 20 glycerides via principal component analysis and linear discriminant analysis (PCA and LDA, respectively), including stereo- and regioisomeric pairs. The resulting chemometric patterns were used as a training space for which the structural characteristics of unknown glycerides were identified. In addition, by using our array to perform a standard addition analysis on a mixture of triglycerides and using a method introduced herein, we demonstrated the ability to quantitate glyceride components in a mixture.
Glycerides are the primary component of animal fats and vegetable oils (1). They consist of one, two, or three fatty acids esterified on glycerol, and hence are referred to as mono-, di-, and triglycerides, respectively. The structural diversity of glycerides derives in part from their fatty acid alkyl groups, which can differ in carbon number (i.e., chain length), the degree of unsaturation, the position of olefins, and the configuration of the olefins (i.e., cis/trans). Furthermore, these fatty acid alkyl groups can be connected to the sn-1, -2, or -3 carbons on glycerol. Hence, a variety of regio- and stereoisomers can exist for glycerides, posing a challenge for mass spectrometry (2). Further, because the differences in chain length primarily result from the presence of greater or fewer methylene groups, NMR spectroscopy can be ambiguous (3).
The analysis of glycerides is primarily important to the food and nutrition industries for tasks such as authenticating edible oils (4), designing foods with certain physical properties (5), and studying how fats are digested and absorbed (6). In particular, classifying all of the various kinds of regio- and stereoisomers of glycerides is biologically important because lipases, enzymes that catalyze the hydrolysis of glycerides into fatty acids and glycerol, exhibit selectivity based on these features of the glyceride substrates. As examples, the position and configuration of olefins, the identity of fatty acid alkyl groups, as well as their position on glycerol (i.e., sn-1,3 versus sn-2), all contribute to differing biological activity (7, 8). Studying the selectivity of these lipases has applications in understanding diseases, including fat malabsorption disorders, hypercholesterolemia, atherosclerosis, and diabetes (9, 10). Research on metabolic disorders has shown that fatty acid accumulation can exert a toxic or a protective effect on a tissue, depending on the specific tissue type (e.g., liver, cardiac, or skeletal muscle) (11, 12) and health state (e.g., diabetic) (13, 14) as well as on the fatty acids (e.g., saturated or unsaturated) (15). Sequestration of fatty acids by esterification to glycerides is one pathway by which these effects are regulated (16). Thus, a deeper understanding of the distinct roles of the cellular storage of structurally different glycerides in normal and disease states is a desirable avenue of research (17). However, currently only limited information is available about the composition of glycerides in adipose and nonadipose tissue.
The most common method of glyceride identification is mass spectrometry (MS) (2, 18). However, as alluded to above, this approach has drawbacks. Because glycerides are neutral molecules, they must be ionized to be analyzed by MS. Saponification can be used to obtain the fatty acids, which are both volatile and charged, thereby facilitating MS analysis, but information about the glyceride structure is lost in this process (18). Electrospray ionization and atmospheric pressure chemical ionization are used to ionize glycerides directly; however, the ion yields are low compared with preionized lipids (19, 20). Furthermore, the ability of a glyceride to be ionized using these methods often varies. For example, ion abundance generally increases with increasing number of double bonds in the fatty acid alkyl chain and can also depend on fatty acid alkyl chain length (21). These significant variations in ion abundance mean that ionization methodologies must be developed and tailored to a specific application to satisfactorily detect each glyceride of interest (19). Finally, these variations render the quantification of glycerides, particularly in a complex mixture, quite challenging when using MS (22).
Regio- and stereoisomers further confound the discrimination of glycerides by MS, because isomers share the same mass. Other techniques such as chemical derivitization of the glycerides, ion fragmentation, and specialized HPLC must be coupled with MS to effect differentiation of isomeric species. For example, ozonolysis has been used to cleave the double bonds in unsaturated glycerides before ionization to deduce the positions of double bonds (23). Nonaqueous reverse-phase (NARP)-HPLC can resolve cis/trans isomers of triacylglycerols and double-bond positional isomers after treatment of the olefins with bromine (24). Silver ion chromatography has been used to separate triacylglycerol positional isomers under specifically developed solvent and column temperature conditions (25). Silver cationization as a postcolumn treatment in conjunction with NARP-HPLC and ion fragmentation has also been used for triglyceride positional isomer determination (26, 27) Thus, although these current approaches to glyceride isomer analysis have been successful, they are complicated, labor intensive, time-consuming, and at times inconsistent in their results (26).
Because glycerides are structurally very similar to one another, we believed that a differential sensing array-based approach would be most suitable for their classification. Our hypothesis was that if a cross-reactive array could be created that was responsive to the subtle structural differences inherent in glycerides, it could be used to pattern individual glycerides, identify structural features of unknown glycerides, and potentially quantitate glycerides in a mixture. Cross-reactive arrays have been successfully used in a number of sensing applications (28–33). Differential sensing mimics the mammalian senses of olfaction and gustation by detecting the pattern of response of an analyte to a collection of semiselective receptors (34, 35). In mammals, the characteristic pattern for a scent or taste is interpreted and stored by the brain (36). In the laboratory, chemometric routines such as principal component analysis (PCA) and linear discriminant analysis (LDA) are used to extract the relevant information from the array. Both PCA and LDA are multivariate methods that reduce the dimensionality of a data set. PCA does so by finding unbiased orthogonal axes that describe decreasing extents of variance in the data derived from different samples (classes) and repetitions of the samples (37). Any grouping of like samples represents intrinsic similarities between the sample datasets whereas separate classification represents differences in that variable space. LDA classifies samples by calculating discriminant functions that maximize the separation between predetermined classes and minimizes the separation within these classes (38, 39). Thus, LDA is a supervised method, meaning that the classes are provided as inputs into the algorithm. For this reason, a validation method called a leave-one-out cross-validation is used to test the predictive value of the model. Further, LDA can be used to predict the identity of unknowns by identifying which classes in the training set the unknowns most resemble.
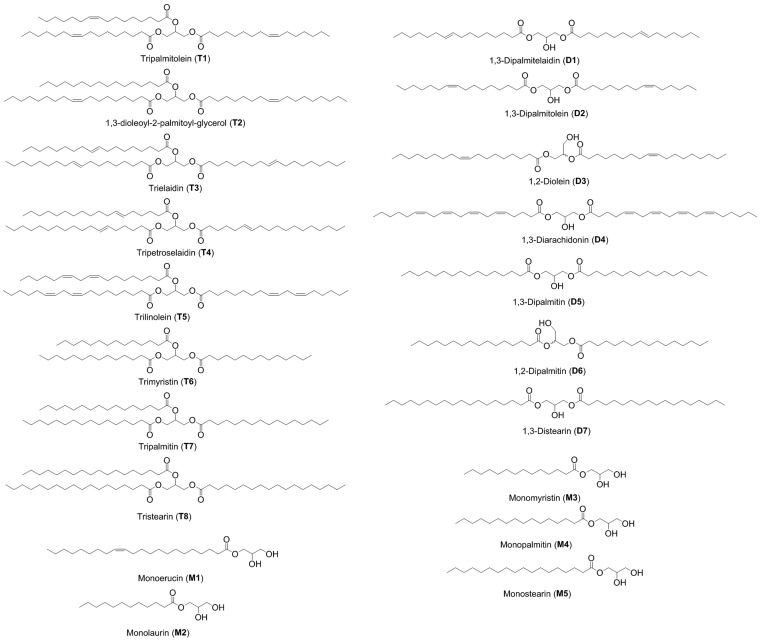
Therefore, the goal of this project was to develop an array of cross-reactive receptors that could discriminate glycerides. The glycerides selected are shown in Fig. 1. The panel includes commercially available mono-, di-, and triacylglycerols with fatty acid alkyl groups that are relevant to mammalian biology (40). Moreover, the panel consists of examples of each of the following stereo- and regioisomers: (i) cis/trans olefins (D1 and D2; T2 and T3), (ii) differing position of the olefin (T3 and T4), and (iii) differing position of the fatty acid alkyl groups on the glycerol (D5 and D6). Clearly, it would be extremely challenging to create highly selective receptors for each individual glyceride, and thus a differential sensing method seems the only reasonable approach to creating an optical sensing routine to identify and classify these structures.
Fig. 1.
Glyceride panel with structures and names.
Because glycerides are extremely hydrophobic analytes, we postulated that serum albumins (SAs) would be suitable cross-reactive receptors with which to test our hypothesis. SA is a common plasma protein that binds hydrophobic molecules to transport them through the hydrophilic environment of blood plasma (41). The protein binds a number of endogenous compounds: long-chain fatty acids (Ka = 106–107 M−1) (42), bile acids (Ka = 103–105 M−1) (43), and steroids (Ka = 103–105 M−1) (44–46), as well as many drugs, toxins, and fluorophores (41). Despite being composed of fatty acid alkyl groups, glycerides bind less tightly to SAs and in a different location than their fatty acid counterparts (47). The primary sequence of SAs differs between species, which thus exhibit differences in ligand binding (41). Previously, we have used arrays of SAs for the differentiation of other hydrophobic analytes including fatty acids (48), terpenes (49), and plasticizers (50). However, none of these previous studies involved differences between the analyte structures as subtle as glycerides do, nor had we challenged our methods to identify structural aspects of an unknown. Furthermore, we had never implemented a quantitation assay in a complex mixture. Because the binding of ligands to SAs is known to depend on subtle differences in their structure (41), we anticipated that success could be achieved but would be highly dependent upon the signaling modality and potentially analyte prederivitization.
Thus, herein we describe a method using SAs to fingerprint glycerides that classifies them as mono-, di-, or triglycerides. The glycerides were further classified based on fatty acid chain length, ester positions on glycerol, and olefin regio- and stereochemistry. For the unsaturated glycerides in the panel, differentiation based on olefin position and stereochemistry was achieved by the use of a pretreatment olefin metathesis. Using the protocols described herein, structural features of unknown glycerides could be identified. Furthermore, the quantitation of trilinolein in a mixture of triglycerides was achieved by application of the standard addition method using a net analyte signal technique (SANAS) presented herein.
Results and Discussion
Indicator Uptake Experiments with SA and Triglyceride.
The optical signaling approach we envisioned required that fluorophores bind to the SAs, and signal the addition of glycerides upon binding to the SAs. To identify appropriate fluorophores for the sensing ensemble, several candidates were screened for their fluorescence modulation both in the presence of bovine serum albumin (BSA) and triglycerides. The triglycerides were insoluble in water but dissolved in the presence of SA, presumably due to binding in the hydrophobic sites of the protein. Thus, indicator uptake experiments were undertaken in which a SA/triglyceride solution was titrated with a fluorescent indicator. The change in emission of the indicator in the presence of the triglyceride was compared with the indicator’s change in emission when it was added to SA alone. This protocol revealed which fluorophores bind the SAs and modulate in the presence of glycerides. The fluorophores screened included dansyl amide (DNSA), 2-anthracenecarboxylate (2-AC), 1-anilinonapthalene sulfonic acid (ANS), and a nitrobenzoxadiazole fatty acid (NBD-FA). The first three compounds were known previously to bind to SA (41). We synthesized NBD-FA by a literature procedure (SI Appendix) (51).
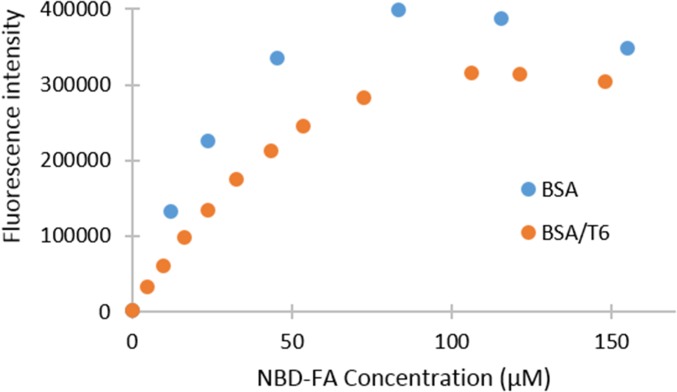
An example of these indicator uptake experiments is shown in Fig. 2 for NBD-FA, whereas the titrations for the other indicators can be found in SI Appendix, Figs. S2–S4). When NBD-FA was added to SA, its emission increased (“BSA” in Fig. 2); however, when trimyristin (T6) was present with the BSA, this increase in emission was attenuated (“BSA/T6” in Fig. 2), indicating that the binding of T6 to SA was inhibiting the binding of NBD-FA. It should be noted that the decrease in emission at concentrations above 100 μM NBD-FA was attributed to self-quenching as multiple NBD-FAs bind to the SA.
Fig. 2.
Addition of NBD-FA (0–155 µM) to BSA (100 µM) and to BSA (100 µM)/T6 (90 µM) in 10 mM phosphate buffer, pH 7.00, 0.02% NaN3; <0.3% THF; λex = 470 nm, λem = 540 nm.
DNSA and NBD-FA were inhibited in their binding to SA in the presence of triglycerides and therefore were suitable for use in the array. The other indicators, 2-AC and ANS, did not demonstrate significant inhibition in binding to SA in the presence of trimyristin. However, we chose to include ANS in the array as it is commonly used to probe the folding of SAs because it binds in the crevices between domains (41). We anticipated it would respond to other glycerides even if our initial tests with trimyristin did not reveal emission modulations.
First Iteration of the Well-Plate Array.
The cross-reactive array was constructed using 96-well plates. As a preliminary test of the array’s ability to differentiate the glycerides, an assortment of eight mono-, di-, and triglycerides from the total panel (Fig. 1) were selected. These glycerides were mixed with individual combinations of the three indicators (DNSA, NBD-FA, and ANS) and bovine and human serum albumin (six combinations: BSA/DNSA, human serum albumin (HSA)/DNSA, BSA/NBD-FA, HSA/NBD-FA, BSA/ANS, and HSA/ANS) in a 96-well plate with 8 replicates for each glyceride, and the emission of each well was recorded.
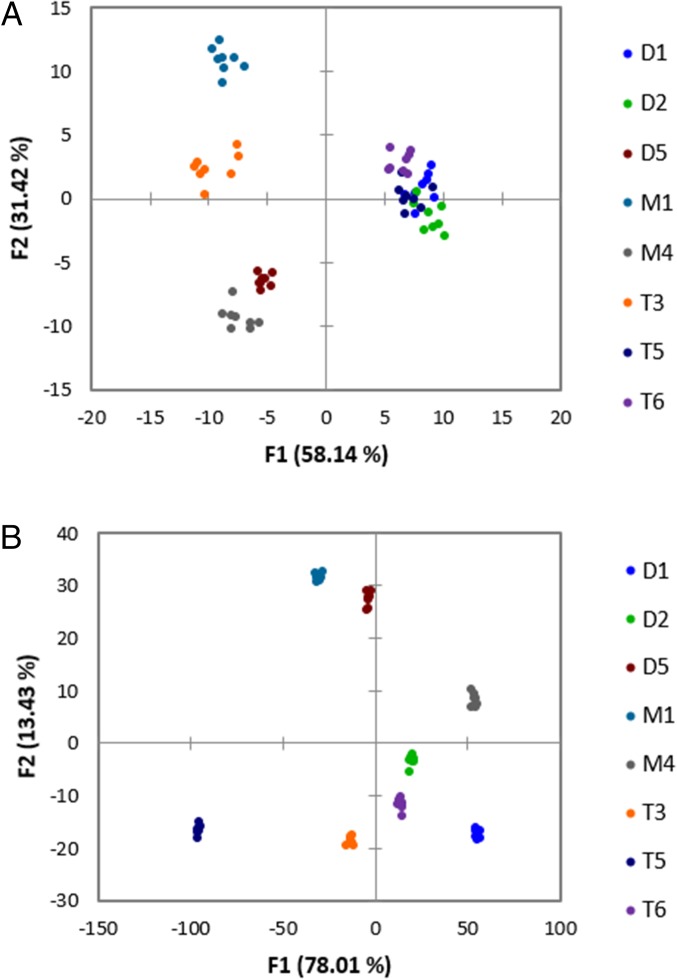
A LDA score plot of the fluorescence data collected from this array is shown in Fig. 3A, which has a 98% cross-validation analysis. Whereas the eight glycerides were differentiated by this array with high accuracy, there was significant visual overlap along the F1 and F2 axes of three of the glycerides. D1 and D2, which are cis/trans isomers of one another, were not well discriminated, and T5 was also poorly separated. The fact that our approach demonstrated overlap of unsaturated glycerides with only 8 of the 20 total targets in the panel caused us to reconsider the approach. Because differences between the unsaturated glycerides were the hardest to discriminate, we anticipated even further problems when attempting to classify the position, stereochemistry, and number of double bonds.
Fig. 3.
LDA plots of data collected from 96-well plates without olefin metathesis (A) and with olefin metathesis (B). (A) BSA and HSA (100 µM), glyceride (90 µM), DNSA (60 µM), ANS (60 µM), and NBD-FA (60 µM) in phosphate buffer with <2% (wt/vol) THF (see SI Appendix, Table S1 for read parameters) and (B) BSA and HSA (100 µM), glyceride (90 µM), DNSA (60 µM), ANS (60 µM), and NBD-FA (60 µM), metathesized glyceride (90 µM), AF (100 µM), and DNSA (60 µM) in phosphate buffer with <5% (vol/vol) THF (see SI Appendix, Table S4 for read parameters).
Olefin Metathesis of Glycerides.
One strategy to discriminate the differences in the olefins would be their derivitization. We contemplated the use of bromination and dihydroxylation, but ultimately chose olefin metathesis. Metathesis reactions of glycerides and fatty acids have been previously explored with the intent of using these compounds to make chemical products more sustainably (52, 53). Such a prior derivitization approach is similar in principle to the use of other olefin reactions, such as halogen addition (24) and silver cationization, which are able to resolve stereo- and regioisomers of glycerides when combined with NARP-HPLC–MS methods (26).
Olefin metathesis was chosen for several reasons. First, using a metathesis reaction results in products of differing length depending upon the positions of the olefins in the glycerides, thus potentially making the products from such glycerides unique. Second, olefin metathesis catalysts have differing reactivity toward cis and trans stereoisomers (54), thus leading to different extents of metathesis depending upon the stereochemistry of the starting fatty acid chains. Third, the reaction conditions are relatively mild, and the reaction mixture can be used directly in the SA array without any purification. This factor allows the cross-metathesis reactions of multiple glycerides to be performed in parallel in a polypropylene well plate for efficient workflow. Lastly, this reaction could be used to introduce an additional fluorophore for optical analysis. Our strategy therefore used fluorescein conjugated to an olefin, resulting in mixed olefin products.
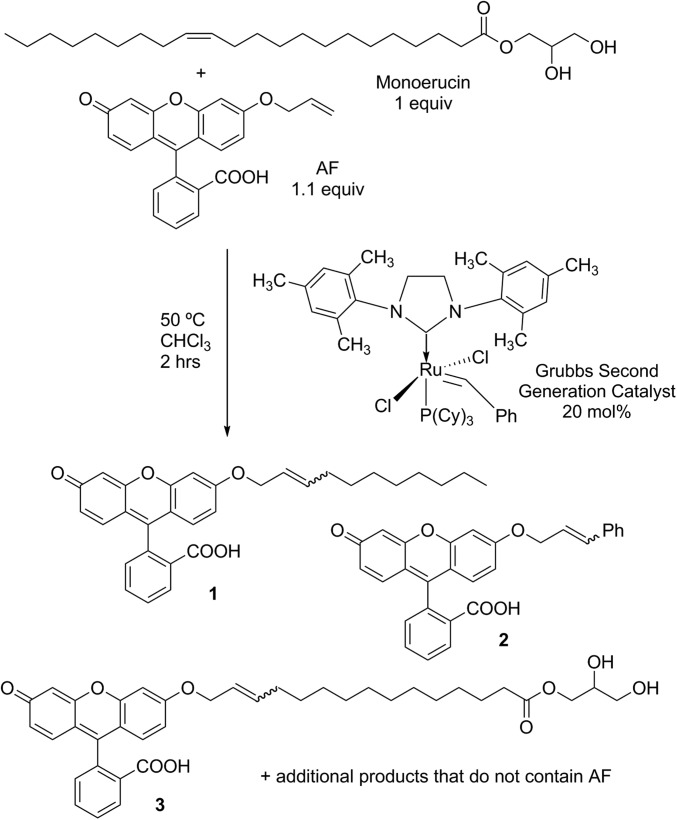
With these goals in mind, the allyl fluorescein derivative AF (Fig. 4) was synthesized according to a literature procedure (55, 56). As a model reaction, we screened several different reaction conditions for cross-metathesis between AF and monoerucin (M1) to optimize the reaction conditions (SI Appendix, Table S2). The conditions that were selected to be optimal for our purposes are shown in Fig. 4. LC-MS analysis of the reaction mixtures confirmed the conversion of AF to mixed glyceride and AF-containing compounds.
Fig. 4.
Olefin metathesis of monoerucin (M1).
Once the optimal conditions were identified, all of the unsaturated glycerides in the panel were subjected to the cross-metathesis reaction in parallel in the same manner in a well plate, and the reaction mixtures were analyzed by LC-MS to determine that AF was metathesizing with the glycerides and that the conversion was reproducible. In these experiments, the AF-glyceride products observed in the LC-MS analysis contained the alkyl portion of the glyceride, as in 1, and smaller amounts of products such as 3. SI Appendix, Table S3 summarizes the percent conversion of AF to the corresponding mixed product (1 type) for each unsaturated glyceride. The chromatogram for absorption at 280 nm was used to quantitate the conversion, and we assumed that the extinction coefficient at that wavelength for AF and AF-glyceride species did not differ significantly. In each reaction, some unreacted AF remained, and some of product 2, which results from the catalyst loading used, was also observed. Finally, it is highly likely that olefin combinations that did not involve AF (i.e., self-metathesis of the glyceride) are also generated in the reaction. However, these species were not observable using conventional LC-MS analysis. Although the conversion differed for each glyceride, all of the glycerides were found to metathesize with AF.
Exploring Förster Resonance Energy Transfer with DNSA and AF.
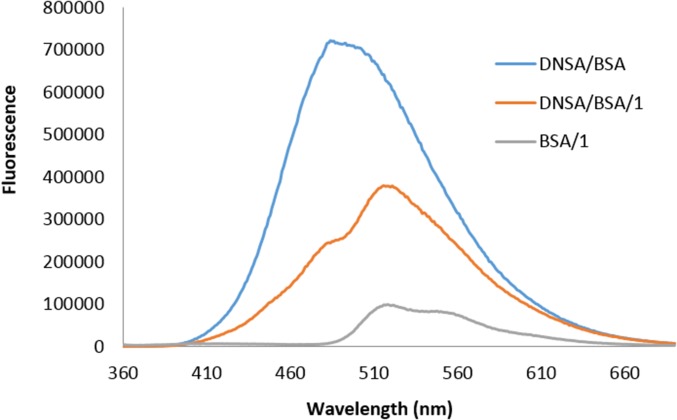
Dansyl and fluorescein moieties have been reported to act as a Förster resonance energy transfer (FRET) pair (57, 58), and therefore we investigated this property with the metathesized glycerides. FRET would be advantageous to the chemometric patterning because it would add an additional facet of cross-reactivity to the array. To test whether FRET occurred between DNSA and 1 in the presence of BSA, we measured the emission spectra of solutions of DNSA/BSA, 1/BSA, and DNSA/1/BSA by exciting at 350 nm (Fig. 5). These data support FRET because the DNSA/1/BSA sample exhibits emission at the λmax of 520 nm for fluorescein that was much higher in intensity than the 1/BSA sample. We also performed a titration in which DNSA was titrated into BSA/1 while exciting at 350 nm (for dansyl) and observed an increase in emission of fluorescein with a λmax at 520 nm (SI Appendix, Fig. S5), which supports FRET between DNSA and 1 when they are both bound to BSA. Hence, we added DNSA to the metathesized glycerides as a simple way to generate additional cross-reactivity.
Fig. 5.
Fluorescence spectra for DA/BSA (250 µM/100 µM), 1/BSA (90 µM/100 µM), and DA/1/BSA (250 µM/90 µM/100 µM) in 10 mM phosphate buffer, pH 7.00, 0.02% NaN3; λex = 350 nm.
Second Iteration of the Well-Plate Array.
Once we had established that the olefin metathesis reaction was successfully mixing AF with fragments of the unsaturated glycerides in our panel, we were ready to incorporate this reaction into the well-plate array with SA. To do so, we performed the metathesis reaction on the glycerides in a well plate in chloroform. However, because chloroform is immiscible with buffered SA solutions, after metathesis the chloroform was allowed to evaporate, and the residues were taken up in tetrahydrofuran (THF). The THF solutions of the glyceride metathesis reactions were then exposed to BSA and HSA, separately, in a 96-well plate. DNSA was added to one set of BSA and HSA plates, and buffer was added to another set of BSA and HSA plates. For the plates that contained DNSA, the emission of fluorescein, DNSA, and the FRET pair between the two fluorophores was measured. For the plates without DNSA, only the emission of the fluorescein was measured. We wanted to measure the fluorescein emission both in the absence and presence of DNSA to see if there was a significant difference in this signal and thus an additional variable in our array. The first iteration of the well-plate array was also performed exactly as described above for each glyceride. Both sets of fluorescence data were used in the pattern recognition algorithm for a total of 14 variables (Fig. 6).
Fig. 6.
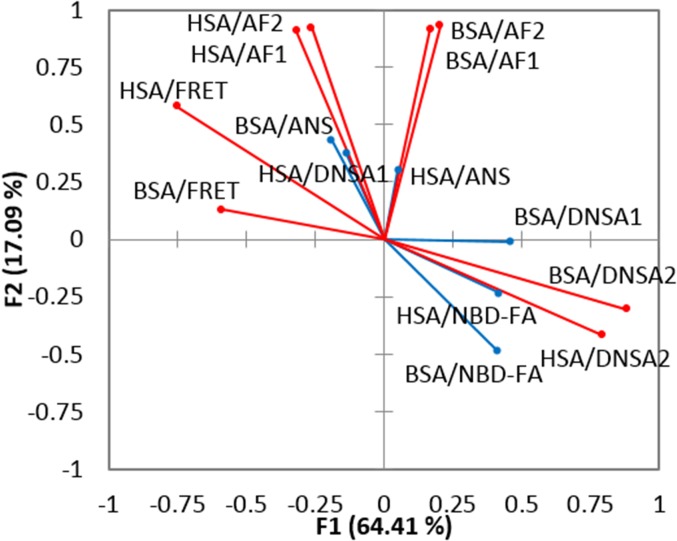
Loading plot corresponding to the LDA in Fig. 3B. DNSA1 refers to the nonmetathesis part of the assay, whereas DNSA2 refers to the measurement of the DNSA emission in the presence of the metathesized glycerides. AF1 refers to the fluorescein emission in the absence of any DNSA, whereas AF2 refers to the fluorescein emission in the presence of DNSA.
The LDA plot generated for eight glycerides is shown in Fig. 3B. The cross-validation was 100%. The clustering within replicates of the same glyceride in this plot (Fig. 3B) was much tighter than in the plot generated using only the first iteration of the well-plate array (Fig. 3A), and the separation between different glycerides was more marked. In particular, compared with Fig. 3A, the cis isomer D2 was discriminated from its trans isomer D1, and T5 no longer overlaps with D1 and D2.
From the factor-loading plot (Fig. 6), we concluded that the metathesis parameters contributed significantly to the discrimination. A factor-loading plot shows the contribution of each of the original input variables to each factor axis in the reduced variable space. The loading plot in Fig. 6 shows that the metathesis variables, which are marked in red, contribute significantly to F1 and F2. This result supports our hypothesis that the metathesis reaction would improve the differentiation of a panel of glycerides containing unsaturated species.
Array Reproducibility.
Next, we wanted to be sure that we could replicate the results of the array. In other words, we wanted to know if we would get essentially the same pattern for the glycerides each time we performed an independent repetition of the entire experiment, including repeating the metathesis reaction and starting from newly prepared stock solutions of all of the array components. Such a complete reproduction has rarely, if ever, been discussed in papers describing differential sensing routines. Hence, we performed an independent repetition of the array on those same eight glycerides two more times for a total of three data sets. The LDA plots for these repetitions can be found in SI Appendix, Fig. S6. The relative position of all eight glycerides was essentially the same for each plot, and we concluded that the array is reproducible.
To further test the consistency of the array, we used LDA as a predictive tool. Because LDA entails that the classes be given as inputs, one can take two sets of data, in our case the independent repetitions of the array on those eight glycerides, and assign one as a training set and the other as a prediction set. The training set teaches the algorithm which responses from the array correspond to which glyceride, and then the algorithm can assign the glyceride identity to the sets of array responses in the prediction set. Hence, we alternately treated each of the three repetitions as the training set or the prediction set. For 64 data points in each set (8 replicates of 8 glycerides), the average accuracy was 87% for the 6 combinations of the 3 independent replications (SI Appendix, Table S5).
Analysis of the Full Glyceride Panel.
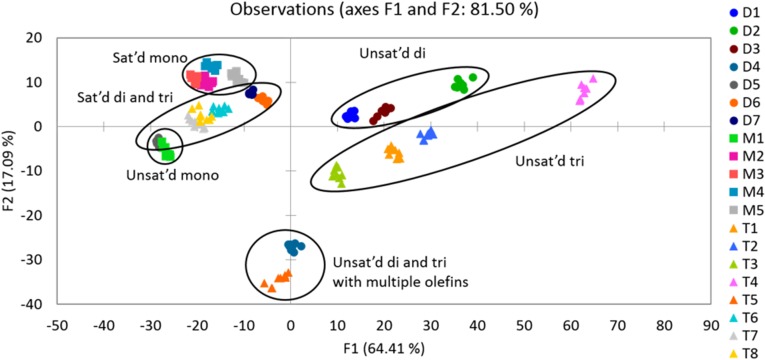
Finally, we performed the full 14-variable array on all 20 glycerides in the panel. A LDA plot was obtained with a cross-validation of 98% (Fig. 7). The only error in classification in the cross-validation was between one replicate of the saturated triglyceride T7, which was misclassified as another saturated triglyceride T8. In general, the unsaturated di- and triglycerides are on the right side of the plot, whereas the saturated glycerides are on the left side. Within the unsaturated glycerides, there is very clear separation between all of the mono-, di-, and triglycerides. The unsaturated monoglyceride M1 is associated more closely with the saturated glycerides on the left side of the plot. However, this result is reasonable because M1 metathesizes poorly (SI Appendix, Table S3). The two glycerides that consist of fatty acid alkyl groups with multiple double bonds (T5, D4) are found near one another at the bottom center of the plot.
Fig. 7.
LDA plot of data collected from 96-well plates. The array components consisted of BSA and HSA (100 µM), glyceride (90 µM), DNSA (60 µM), ANS (60 µM), NBD-FA (60 µM), metathesized glyceride (90 µM), AF (100 µM), and DNSA (60 µM) in phosphate buffer with <5% (vol/vol) THF (see SI Appendix, Table S4 for read parameters). Cross-validation: 98%.
Moreover, the stereo- and regioisomers of the unsaturated di- and triglycerides are successfully distinguished by the array. Within the unsaturated diglycerides, the cis/trans isomers D1 and D2 are discriminated from one another. Within the unsaturated triglycerides, the olefin positional isomers T3 (olefin between carbons 9 and 10) and T4 (olefin between carbons 6 and 7) are also clearly separated. Furthermore, T2 contains fatty acid alkyl groups that are stereoisomeric (cis) to the fatty acid alkyl groups in T3 (trans), and these species are also clearly differentiated from one another.
All of the saturated glycerides are also well discriminated, although the separation is less marked than between the unsaturated glycerides. This finding is unsurprising because the metathesis reaction does not occur with the saturated glycerides, and hence their discrimination would not be expected to be as significantly improved by the pretreatment step. Within the saturated mono-, di-, and triglycerides, the difference between the compounds is simply the number of carbons in the fatty acid alkyl chains; however, the panel does contain one regioisomer pair, D5 and D6. D5 is esterified at the sn-1 and sn-3 positions of glycerol, whereas D6 is esterified at the sn-1 and sn-2 positions of glycerol. The array is able to differentiate these regioisomers as well.
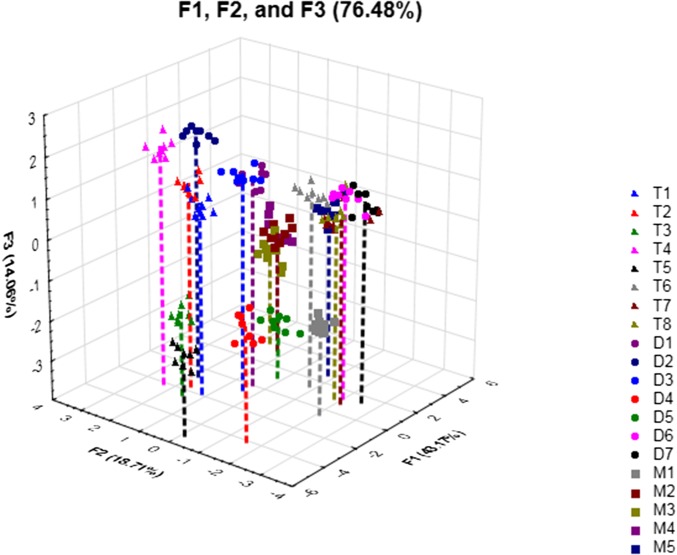
PCA (Fig. 8) also results in good discrimination of the glycerides and similar groupings of glycerides based on their structural features to the LDA plot. In PCA, the identities of the glycerides are not given as inputs, so the analysis only takes the variance in the variables (i.e., emission signals for each receptor) into account without knowing what the classes (i.e., identities of the glycerides) are supposed to be. It is apparent in the PCA that the SA-based receptors respond to the glycerides in a differential manner. In other words, the receptors behave differently from one another with each analyte. When receptors in an array behave similarly to one another, the PCA shows low dimensionality (i.e., most of the variance is described by one or two factor axes). For example, if the receptors all display their highest emission values in the presence of analyte 1 and the lowest emission values in the presence of analyte 2, the PCA would be able to describe the bulk of the variance in the data along a single factor axis. In our case, the first five factor axes (F1–F5) describe 90% of the variance in the data. The high dimensionality in the data is indicative of receptors that respond differently from one another to the analytes in the panel. High dimensionality in the data is indicative of a truly cross-reactive array of receptors (59).
Fig. 8.
PCA plot of data collected from 96-well plates. The array components consisted of BSA and HSA (100 µM), glyceride (90 µM), DNSA (60 µM), ANS (60 µM), NBD-FA (60 µM), metathesized glyceride (90 µM), AF (100 µM), and DNSA (60 µM) in phosphate buffer with <5% (vol/vol) THF (see SI Appendix, Table S4 for read parameters).
Prediction of Glyceride Structural Features.
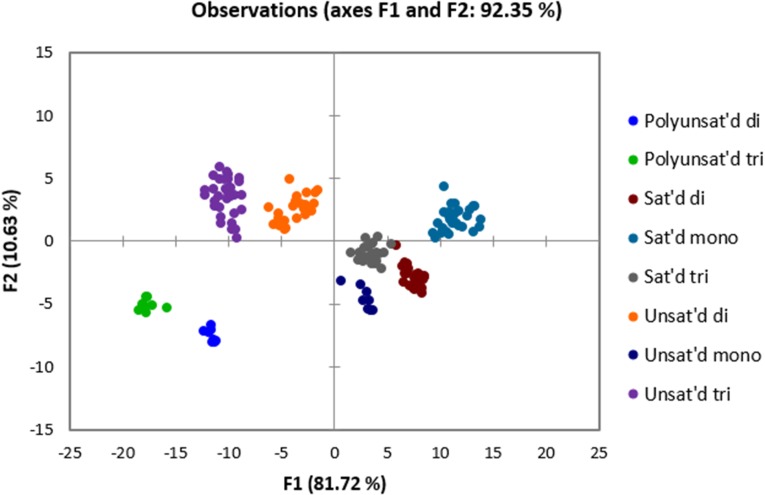
Because glycerides that share structural features are grouped in the LDA and PCA plots, we postulated that our array could be used to identify these features in unknown glycerides. As a way of testing this hypothesis, an independent reproduction of the array was performed on all 20 glycerides (LDA plot for this repetition is shown in SI Appendix, Fig. S7), and the predictive feature of LDA was used. The data set from one experiment was used as the training set, and the other data set was used as the prediction set. The analyte classes that were put into the LDA were structural features of the glycerides: unsaturated triglyceride, saturated triglyceride, polyunsaturated triglyceride, unsaturated diglyceride, saturated diglyceride, polyunsaturated diglyceride, unsaturated monoglyceride, and saturated monoglyceride (Fig. 9 and SI Appendix, Fig. S8).
Fig. 9.
LDA plot of training set of glycerides with analyte classes designated as structural features. The array components consisted of BSA and HSA (100 µM), glyceride (90 µM), DNSA (60 µM), ANS (60 µM), NBD-FA (60 µM), metathesized glyceride (90 µM), AF (100 µM), and DNSA (60 µM) in phosphate buffer with <5% (vol/vol) THF (see SI Appendix, Table S4 for read parameters). The fluorescence counts were expressed as a percentage of the total fluorescence for each receptor/variable. Cross-validation: 100%.
The LDA correctly assigned the glycerides in the training set to its structural feature class in an average of 89% of 160 cases. Because our array is primarily designed to target differences between unsaturated glycerides through the metathesis pretreatment, we postulated that separating the saturated and unsaturated glycerides from one another first would improve the accuracy of the predictions. The analyte classes were assigned more generally to either saturated, unsaturated, or polyunsaturated (SI Appendix, Fig. S9). The LDA correctly assigned the glycerides in the training set according to these classes in an average of 96% of 160 cases. Once it was known whether the glycerides were saturated or unsaturated, then whether they were mono-, di-, or triglycerides could be determined. The training and prediction sets were split into saturated and unsaturated. Within the unsaturated set, the analyte classes were triglyceride, diglyceride, monoglyceride, polyunsaturated diglyceride, and polyunsaturated triglyceride (SI Appendix, Fig. S10). With the saturated set, the analyte classes were triglyceride, diglyceride, and monoglyceride (SI Appendix, Fig. S11). For the unsaturated set, the glycerides were assigned correctly in an average of 95% of the 80 cases, whereas for the saturated set, the glycerides were assigned correctly in an average of 73% of the 80 cases. The lower accuracy of the prediction for the saturated glycerides is unsurprising because it is apparent in the LDA plot that the saturated glycerides are less clearly separated from one another compared with the unsaturated glycerides. However, overall, the array shows a good ability to predict the structural features of glycerides using LDA.
Quantitation of Trilinolein in Triglyceride Mixtures Using Standard Addition.
Introduction to standard addition and net analyte signal.
Because quantitation is one of the major challenges that MS analysis faces in regard to glyceride analysis, we sought to demonstrate the use of our assay for quantitation of a glyceride of interest within a mixture of other glycerides. Because the receptors in the array are semiselective in nature, the presence of glycerides other than the species of interest in the mixture will interfere with the signal elicited from the receptor by that species. Hence, we chose to use the “standard addition” method to minimize the influence of the other glycerides in the mixture on the quantitation of the glyceride of interest.
Standard addition is a classic calibration method that is used when matrix effects are present in a sample that interfere with the signal the compound of interest elicits, confounding accurate quantitation of that compound (60). Ordinarily, the experimentalist tries to remove interference from the sample whenever possible; however, when it is not facile to physically remove the interfering background matrix, standard addition can be used to minimize the matrix’s effect on the analysis. Standard addition is carried out by measuring the response of the mixture after successive additions of the pure analyte of interest. By plotting the response against the amount of the pure analyte in each addition, the concentration of the analyte of interest in the sample is obtained by a linear fit of the data. The x intercept of the line is the analyte concentration. This data analysis procedure is used when dealing with univariate data (i.e., one signal, y, describes the concentration, x, of the analyte); however, in the multivariate case (i.e., multiple signals, y1, y2,…yn, describe the concentration, x, of the analyte), the data analysis used to determine the analyte concentration is necessarily more complicated (61).
In the literature, there are numerous examples of multivariate standard addition procedures (62–67), usually dealing with spectral or electrochemical data obtained from complex sample mixtures. For our purposes, we chose to follow the mathematical procedure developed by Hemmateenejad and Yousefinejad, called SANAS, due to its simplicity and accuracy (68). The net analyte signal (NAS) is defined as the portion of the total signal that is directly related to the concentration of the analyte (69). For some total signal elicited from a mixture, some portion of the signal is due to the component of interest and the rest is due to the background and other components of the mixture. Lorber et al. have shown that the contribution to the signal due to the component of interest, the NAS, can be computed because it is orthogonal to the contribution to the signal of the background and other components (70). Linear algebra is used to determine this orthogonal part of the signal as a vector. In this way, the influence of the matrix as well as background noise can be removed.
In SANAS, the data are first subjected to dimensionality reduction, commonly by PCA or partial least-squares regression (PLS). As described earlier in this article, these algorithms transform the data into a space described by new orthogonal axes, called factor axes, that are linear combinations of the original variables (i.e., the signals y1, y2,…yn). These factor axes are chosen by the algorithm according to different criteria depending on the exact method used (e.g., PCA, LDA, or PLS), but in general these criteria lead to factor axes that are more information dense. The first factor axis (F1) contains the most relevant information about the data, F2 the second most, and so on up to FN, where n = number of original variables. With our data, we obtained better results using PLS rather than PCA. PLS relates a matrix X (the emission data from our array) to a property y (concentration of the additions) (37). PLS uses maximum covariance as its criterion for determining the new factor axes, unlike PCA, which uses maximum variance. The advantage of using covariance is that it includes both variance of X as well as correlation of X and y.
By rebuilding the data set from fewer factor axes than the total number (for example, from F1–F3, discarding F4–F10), irrelevant information like noise, background, or interferences can be removed from X. From the rebuilt data set (X′), the NAS for the analyte of interest is calculated by using a type of singular value decomposition method called rank annihilation (see ref. 60 for a detailed account of this series of computations). The output is a vector that describes the NAS. By plotting the Euclidean norm of this vector (i.e., its magnitude) against the concentrations of the additions, one obtains a plot that is equivalent to the one described for the univariate case described above. The x intercept of the linear fit has the same meaning as in the univariate case, that is, the concentration of the analyte of interest in the mixture.
Applying SANAS to mixtures of glycerides.
The first step in performing the quantitative analysis with our array was to generate mixtures of triglycerides with a known composition to study the accuracy of the method. Mixtures consisting of T1, T3, T5, T6, and T7 were carefully prepared (SI Appendix, Table S6). Weight/volume concentrations were used because the molecular weights differ for different glycerides. The mixture solution was aliquoted into vials and each aliquot was spiked with an increasing amount of pure T5 at a constant total volume for seven additions. The eight resultant solutions were then subjected to the array, and the fluorescence data were obtained as described previously. The final concentration of T5 from the mixture that was in the well plates of the array is shown in Table 1. This concentration is the one that we were measuring. The data from the array were normalized and then subjected to PLS analysis. The data were rebuilt from F1 only (mixtures A, B, C) or from F1 and F2 (mixture D) to obtain the closest estimates. In all cases, F1 described 90% or more of the covariance in the data sets.
Table 1.
Results for T5 concentration in triglyceride mixtures from SANAS
| Mixture | Total concentration of the mixture, mg/mL | Actual T5 concentration, mg/mL | Predicted concentration, mg/mL | R2 of SANAS plot |
| A | 0.04 | 0.0113 | 0.0338 | 0.7403 |
| B | 0.04 | 0.0158 | 0.0160 | 0.9517 |
| C | 0.01 | 0.0053 | 0.0056 | 0.9519 |
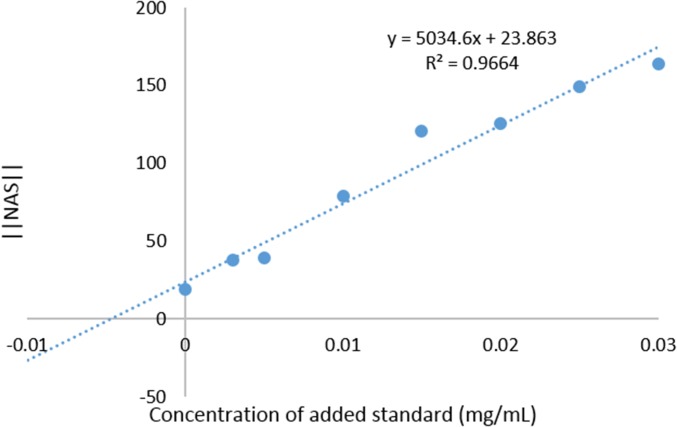
| D | 0.01 | 0.0042 | 0.0047 | 0.9664 |
From the rebuilt data matrix, the net analyte signal (‖NAS‖) was calculated and plotted against the additions to give SANAS plots (Fig. 10 and SI Appendix, Figs. S12–S14). From these plots, the concentration of T5 in the mixture was determined by finding the x intercept of the linear fit (Table 1). Good estimates of the concentration of T5 in the mixtures were obtained for mixtures B, C, and D; however, a larger overestimation of the concentration of T5 in mixture A was obtained. We attribute this error to poor linearity in the response of the sensors to the additions of T5 that is evidenced by the lower correlation coefficient for the linear fit in the SANAS plot for mixture A (Table 1). Some of the nonlinearity was likely due to random experimental errors in solution and plate preparation. However, some deviations from linearity of the responses to the additions to all of the mixtures are inherent to the experimental method. The fluorescence signal collected from each well of the plate is mediated by the SA, fluorophore, and glycerides in the solution and is an indirect measurement of the T5 content. Hence, we expect that nonlinearity in the response results from both the saturation behavior of ligand binding to SA as well as binding competition from glycerides in the mixture that are not T5. Nevertheless, for mixtures B, C, and D the array response showed a good linear dependence on the additions of T5. The SANAS method was able to provide quite accurate values for the T5 content without the necessity for removing or otherwise separating out the other triglycerides in the mixture.
Fig. 10.
SANAS plot generated from the standard addition of mixture D.
Conclusions
In this work, we report an array of cross-reactive SAs and fluorescent indicators to discriminate a panel of structurally similar glycerides. An olefin cross-metathesis reaction with an AF species was used to pretreat the samples before array analysis to distinguish unsaturated glycerides. Using this assay, we successfully discriminated 20 mono-, di-, and triglycerides, including stereo- and regioisomeric pairs. These isomer types included cis/trans stereoisomers, double-bond positional regioisomers, and positional regioisomers on the glycerol core. Using LDA, we were able to predict structural characteristics of the glycerides. Finally, we demonstrated the use of multivariate standard addition with a cross-reactive array of chemosensors. We used our array to perform a standard addition of trilinolein to a mixture of triglycerides. By applying the established SANAS method, we were able to quantitate the trilinolein in the mixture.
Materials and Methods
General.
The arrays were prepared in Costar 96-well plates (#3915). The plates were analyzed using a Biotek Synergy 2 Multimode Microplate Reader or a Biotek Cytation 3 Microplate Reader. LDA, PCA, and data normalization were done using XLSTAT 2011. The SANAS code was run on MATLAB 2014.
Glyceride Array (Part 1).
Concentrated stock solutions of each glyceride were prepared in THF (concentrations on the order of millimolar). Stock solutions of human and BSA were prepared in 10 mM phosphate buffer (pH 7.0, 0.02% NaN3) at a concentration of 500–700 μM. SA–glyceride solutions were prepared from these stocks at concentrations of 150 μM SA and 135 μM glyceride [3% (vol/vol) THF, 97% (vol/vol) 10 mM phosphate buffer, pH 7.0, 0.02% NaN3]. Concentrated stock solutions of DNSA and NBD-FA were prepared in DMSO. A concentrated stock solution of ANS was prepared in 10 mM NaOH (aq). Then, solutions of each of the three indicators at a concentration of 180 μM in 10 mM phosphate buffer, pH 7.0, 0.02% NaN3 were prepared.
The plates were made by placing 200 μL of each SA–glyceride solution and 100 μL of the 180 μM indicator solution in each well [final concentrations: 100 μM SA, 90 μM glyceride, 60 μM indicator, 2% (vol/vol) THF]. Each plate contained a column of indicator alone and a column of indicator and SA as controls. Eight replicates were performed for each glyceride/SA/indicator combination and for the controls.
The parameters for the reading of the well plates can be found in SI Appendix, Table S1. The fluorescence data were normalized by first subtracting the emission of the control (indicator alone) from each data point, and then the data set was rescaled from 0 to 100.
Well-Plate Metathesis Reaction.
Concentrated stock solutions of each glyceride were prepared in chloroform (concentrations were on the order of millimolar). Solutions of AF and Grubbs Second Generation Catalyst (G2) were also prepared in chloroform. These solutions were applied to a deep-well polypropylene plate such that each well contained 2 mM glyceride, 2.2 mM AF, and 0.4 mM G2 in a total volume of 1 mL of chloroform. Two controls were also included that contained only AF and G2. The plate was placed in an oven and heated at 50 °C for 2 h. Then the plate was removed and left in the fume hood to finish evaporating the chloroform overnight at ambient temperature and pressure. The next day, the dry material that remained in each well was taken up in 1 mL of THF with thorough mixing via a glass pipette to completely dissolve all of the material in the THF.
Glyceride Array with Metathesized Glycerides (Part 2).
The solutions from the metathesis reaction in 1 mL of THF were used directly. Solutions of human and BSA were prepared in 10 mM phosphate buffer (pH 7.0, 0.02% NaN3) at a concentration of 550 μM. SA–glyceride solutions were prepared from these stocks at concentrations of 150 μM SA, 135 μM glyceride, 149 μM AF, and 27 μM G2 [6.8% (vol/vol) THF, 93.2% (vol/vol) 10 mM phosphate buffer, pH 7.0, 0.02% NaN3]. A concentrated stock solution of DNSA was prepared in DMSO. Then a solution of DNSA at a concentration of 180 μM in 10 mM phosphate buffer, pH 7.0, 0.02% NaN3 was prepared.
The plates were made by placing 200 μL of each SA–glyceride solution and 100 μL of buffer or of the 180 μM dansyl solution in each well [final concentrations: 100 μM SA, 90 μM glyceride, 99 μM AF, 60 μM DNSA, 4.5% (vol/vol) THF]. Each plate contained a column of indicator alone and a column of indicator and SA as controls. Eight replicates were performed for each glyceride–SA combination with either DNSA/AF or only AF and for the controls.
The parameters for the reading of the well plates can be found in SI Appendix, Table S3. The fluorescence data were normalized by first subtracting the emission of the control (indicator alone) from each data point, and then the data set was rescaled from 0 to 100.
Supplementary Material
Acknowledgments
The authors would like to thank Drs. Bahram Hemmateenejad and Saeed Yousefinejad for sharing their code. The authors are grateful to the National Science Foundation for support of this research through Grant CHE-1212971 and also to the Welch Regents Chair to E.V.A. (F-0046).
Footnotes
The authors declare no conflict of interest.
This article is a PNAS Direct Submission.
This article contains supporting information online at www.pnas.org/lookup/suppl/doi:10.1073/pnas.1508848112/-/DCSupplemental.
References
- 1.Voet D, Voet JG, Pratt CW. Fundamentals of Biochemistry. 3rd Ed Wiley & Sons; New York: 2008. [Google Scholar]
- 2.Andrikopoulos NK. Chromatographic and spectroscopic methods in the analysis of triacylglycerol species and regiospecific isomers of oils and fats. Crit Rev Food Sci Nutr. 2002;42(5):473–505. doi: 10.1080/20024091054229. [DOI] [PubMed] [Google Scholar]
- 3.Alemany LB. Using simple 13C NMR linewidth and relaxation measurements to make detailed chemical shift assignments in triacylglycerols and related compounds. Chem Phys Lipids. 2002;120(1-2):33–44. doi: 10.1016/s0009-3084(02)00100-7. [DOI] [PubMed] [Google Scholar]
- 4.Jee M, editor. Oils and Fats Authentication. CRC Press; Boca Raton, FL: 2002. [Google Scholar]
- 5.Larsson K. Physical properties- structural and physical characteristics. In: Gunstone FD, Hawood JL, Padley FB, editors. The Lipid Handbook. Chapman and Hall; London: 1986. pp. 321–384. [Google Scholar]
- 6.Small DM. The effects of glyceride structure on absorption and metabolism. Annu Rev Nutr. 1991;11:413–434. doi: 10.1146/annurev.nu.11.070191.002213. [DOI] [PubMed] [Google Scholar]
- 7.Kovac A, Scheib H, Pleiss J, Schmid RD, Paltauf F. Molecular basis of lipase stereoselectivity. Eur J Lipid Sci Technol. 2000;102(1):61–77. [Google Scholar]
- 8.Warwel S, Borgdorf R, Brühl L. Substrate selectivity of lipases in the esterification of oleic acid, linoleic acid, linolenic acid and their all-trans-isomers and in the transesterification of cis/trans-isomers of linoleic acid methyl ester. Biotechnol Lett. 1999;21(5):431–436. [Google Scholar]
- 9.Kritchevsky D. Fatty acids, triglyceride structure, and lipid metabolism. J Nutr Biochem. 1995;6(4):172–178. [Google Scholar]
- 10.Raclot T, Holm C, Langin D. Fatty acid specificity of hormone-sensitive lipase. Implication in the selective hydrolysis of triacylglycerols. J Lipid Res. 2001;42(12):2049–2057. [PubMed] [Google Scholar]
- 11.Lass A, Zimmermann R, Oberer M, Zechner R. Lipolysis - a highly regulated multi-enzyme complex mediates the catabolism of cellular fat stores. Prog Lipid Res. 2011;50(1):14–27. doi: 10.1016/j.plipres.2010.10.004. [DOI] [PMC free article] [PubMed] [Google Scholar]
- 12.Greenberg AS, et al. The role of lipid droplets in metabolic disease in rodents and humans. J Clin Invest. 2011;121(6):2102–2110. doi: 10.1172/JCI46069. [DOI] [PMC free article] [PubMed] [Google Scholar]
- 13.Lopaschuk GD, Ussher JR, Folmes CDL, Jaswal JS, Stanley WC. Myocardial fatty acid metabolism in health and disease. Physiol Rev. 2010;90(1):207–258. doi: 10.1152/physrev.00015.2009. [DOI] [PubMed] [Google Scholar]
- 14.Tocchetti CG, et al. GSH or palmitate preserves mitochondrial energetic/redox balance, preventing mechanical dysfunction in metabolically challenged myocytes/hearts from type 2 diabetic mice. Diabetes. 2012;61(12):3094–3105. doi: 10.2337/db12-0072. [DOI] [PMC free article] [PubMed] [Google Scholar]
- 15.Listenberger LL, et al. Triglyceride accumulation protects against fatty acid-induced lipotoxicity. Proc Natl Acad Sci USA. 2003;100(6):3077–3082. doi: 10.1073/pnas.0630588100. [DOI] [PMC free article] [PubMed] [Google Scholar]
- 16.Walther TC, Farese RV., Jr Lipid droplets and cellular lipid metabolism. Annu Rev Biochem. 2012;81:687–714. doi: 10.1146/annurev-biochem-061009-102430. [DOI] [PMC free article] [PubMed] [Google Scholar]
- 17.Aon MA, Bhatt N, Cortassa SC. Mitochondrial and cellular mechanisms for managing lipid excess. Front Physiol. 2014;5:282. doi: 10.3389/fphys.2014.00282. [DOI] [PMC free article] [PubMed] [Google Scholar]
- 18.Aluyor EO, Ozigagu CE, Oboh OI, Aluyor P. Chromatographic analysis of vegetable oils: A review. Sci Res Essays. 2009;4(4):191–197. [Google Scholar]
- 19.Murphy RC, Leiker TJ, Barkley RM. Glycerolipid and cholesterol ester analyses in biological samples by mass spectrometry. Biochim Biophys Acta. 2011;1811(11):776–783. doi: 10.1016/j.bbalip.2011.06.019. [DOI] [PMC free article] [PubMed] [Google Scholar]
- 20.Murphy RC, Fiedler J, Hevko J. Analysis of nonvolatile lipids by mass spectrometry. Chem Rev. 2001;101(2):479–526. doi: 10.1021/cr9900883. [DOI] [PubMed] [Google Scholar]
- 21.Li X, Evans JJ. Examining the collision-induced decomposition spectra of ammoniated triglycerides as a function of fatty acid chain length and degree of unsaturation. I. The OXO/YOY series. Rapid Commun Mass Spectrom. 2005;19(18):2528–2538. doi: 10.1002/rcm.2087. [DOI] [PubMed] [Google Scholar]
- 22.Murphy RC, Gaskell SJ. New applications of mass spectrometry in lipid analysis. J Biol Chem. 2011;286(29):25427–25433. doi: 10.1074/jbc.R111.233478. [DOI] [PMC free article] [PubMed] [Google Scholar]
- 23.Thomas MC, et al. Elucidation of double bond position in unsaturated lipids by ozone electrospray ionization mass spectrometry. Anal Chem. 2007;79(13):5013–5022. doi: 10.1021/ac0702185. [DOI] [PMC free article] [PubMed] [Google Scholar]
- 24.Podlaha O, Töregård B. Some new observations on the equivalent carbon numbers of triglycerides and relationship between changes in equivalent carbon number and molecular structure. J Chromatogr A. 1989;482(1):215–226. [Google Scholar]
- 25.Adlof R. Analysis of triacylglycerol and fatty acid isomers by low-temperature silver-ion high performance liquid chromatography with acetonitrile in hexane as solvent: limitations of the methodology. J Chromatogr A. 2007;1148(2):256–259. doi: 10.1016/j.chroma.2007.03.070. [DOI] [PubMed] [Google Scholar]
- 26.Lévêque NL, Héron S, Tchapla A. Regioisomer characterization of triacylglycerols by non-aqueous reversed-phase liquid chromatography/electrospray ionization mass spectrometry using silver nitrate as a postcolumn reagent. J Mass Spectrom. 2010;45(3):284–296. doi: 10.1002/jms.1713. [DOI] [PubMed] [Google Scholar]
- 27.Dobson G, Christie WW, Nikolova-Damyanova B. Silver ion chromatography of lipids and fatty acids. J Chromatogr B Biomed Appl. 1995;671(1-2):197–222. doi: 10.1016/0378-4347(95)00157-e. [DOI] [PubMed] [Google Scholar]
- 28.Collins BE, Wright AT, Anslyn EV. Creative chemical sensor systems. Top Curr Chem. 2007;277:181–218. [Google Scholar]
- 29.Stitzel SE, Aernecke MJ, Walt DR. Artificial noses. Annu Rev Biomed Eng. 2011;13:1–25. doi: 10.1146/annurev-bioeng-071910-124633. [DOI] [PubMed] [Google Scholar]
- 30.De M, et al. Sensing of proteins in human serum using conjugates of nanoparticles and green fluorescent protein. Nat Chem. 2009;1(6):461–465. doi: 10.1038/nchem.334. [DOI] [PMC free article] [PubMed] [Google Scholar]
- 31.Zhou H, Baldini L, Hong J, Wilson AJ, Hamilton AD. Pattern recognition of proteins based on an array of functionalized porphyrins. J Am Chem Soc. 2006;128(7):2421–2425. doi: 10.1021/ja056833c. [DOI] [PubMed] [Google Scholar]
- 32.Diehl KL, Anslyn EV. Array sensing using optical methods for detection of chemical and biological hazards. Chem Soc Rev. 2013;42(22):8596–8611. doi: 10.1039/c3cs60136f. [DOI] [PubMed] [Google Scholar]
- 33.Zhang Y, Askim JR, Zhong W, Orlean P, Suslick KS. Identification of pathogenic fungi with an optoelectronic nose. Analyst (Lond) 2014;139(8):1922–1928. doi: 10.1039/c3an02112b. [DOI] [PMC free article] [PubMed] [Google Scholar]
- 34.Doty RL. Handbook of Olfaction and Gustation. 2nd Ed Marcel Dekker; New York: 2003. [Google Scholar]
- 35.Axel R. Scents and sensibility: A molecular logic of olfactory perception (Nobel lecture) Angew Chem Int Ed Engl. 2005;44(38):6110–6127. doi: 10.1002/anie.200501726. [DOI] [PubMed] [Google Scholar]
- 36.Malnic B, Hirono J, Sato T, Buck LB. Combinatorial receptor codes for odors. Cell. 1999;96(5):713–723. doi: 10.1016/s0092-8674(00)80581-4. [DOI] [PubMed] [Google Scholar]
- 37.Varmuza K, Filzmoser P. Introduction to Multivariate Statistical Analysis in Chemometrics. CRC Press; Boca Raton, FL: 2009. [Google Scholar]
- 38.Jurs PC, Bakken GA, McClelland HE. Computational methods for the analysis of chemical sensor array data from volatile analytes. Chem Rev. 2000;100(7):2649–2678. doi: 10.1021/cr9800964. [DOI] [PubMed] [Google Scholar]
- 39.Klecka WR. Discriminant Analysis. Sage Publications; Beverly Hills, CA: 1980. [Google Scholar]
- 40.Gunstone FD. The Chemistry of Oils and Fats: Sources, Compositions, Properties, and Uses. CRC Press; Boca Raton, FL: 2004. [Google Scholar]
- 41.Peters T. All About Albumin: Biochemistry, Genetics, and Medical Applications. Academic; San Diego: 1996. [Google Scholar]
- 42.Richieri GV, Anel A, Kleinfeld AM. Interactions of long-chain fatty acids and albumin: Determination of free fatty acid levels using the fluorescent probe ADIFAB. Biochemistry. 1993;32(29):7574–7580. doi: 10.1021/bi00080a032. [DOI] [PubMed] [Google Scholar]
- 43.Roda A, Cappelleri G, Aldini R, Roda E, Barbara L. Quantitative aspects of the interaction of bile acids with human serum albumin. J Lipid Res. 1982;23(3):490–495. [PubMed] [Google Scholar]
- 44.Yates FE, Urquhart J. Control of plasma concentrations of adrenocortical hormones. Physiol Rev. 1962;42:359–433. doi: 10.1152/physrev.1962.42.3.359. [DOI] [PubMed] [Google Scholar]
- 45.Ramsey BL, Westphal U. Steroid-protein interactions. 40. The effect of fatty acids on progesterone binding to human serum albumin. Biochim Biophys Acta. 1978;529(1):115–122. doi: 10.1016/0005-2760(78)90109-1. [DOI] [PubMed] [Google Scholar]
- 46.Pearlman WH, Crépy O. Steroid-protein interaction with particular reference to testosterone binding by human serum. J Biol Chem. 1967;242(2):182–189. [PubMed] [Google Scholar]
- 47.Thumser AEA, Buckland AG, Wilton DC. Monoacylglycerol binding to human serum albumin: Evidence that monooleoylglycerol binds at the dansylsarcosine site. J Lipid Res. 1998;39(5):1033–1038. [PubMed] [Google Scholar]
- 48.Kubarych CJ, Adams MM, Anslyn EV. Serum albumins as differential receptors for the discrimination of fatty acids and oils. Org Lett. 2010;12(21):4780–4783. doi: 10.1021/ol101906g. [DOI] [PubMed] [Google Scholar]
- 49.Adams MM, Anslyn EV. Differential sensing using proteins: Exploiting the cross-reactivity of serum albumin to pattern individual terpenes and terpenes in perfume. J Am Chem Soc. 2009;131(47):17068–17069. doi: 10.1021/ja908319m. [DOI] [PubMed] [Google Scholar]
- 50.Ivy MA, Gallagher LT, Ellington AD, Anslyn EV. Exploration of plasticizer and plastic explosive detection and differentiation with serum albumin cross-reactive arrays. Chem Sci. 2012;3(6):1773–1779. [Google Scholar]
- 51.Petry S, et al. Sensitive assay for hormone-sensitive lipase using NBD-labeled monoacylglycerol to detect low activities in rat adipocytes. J Lipid Res. 2005;46(3):603–614. doi: 10.1194/jlr.D400021-JLR200. [DOI] [PubMed] [Google Scholar]
- 52.Mol JC. Application of olefin metathesis in oleochemistry: An example of green chemistry. Green Chem. 2002;4(1):5–13. [Google Scholar]
- 53.Biermann U, Meier MAR, Butte W, Metzger JO. Cross-metathesis of unsaturated triglycerides with methyl acrylate: Synthesis of a dimeric metathesis product. Eur J Lipid Sci Technol. 2011;113(1):39–45. [Google Scholar]
- 54.Kirkland TA, Lynn DM, Grubbs RH. Ring-closing metathesis in methanol and water. J Org Chem. 1998;63(26):9904–9909. [Google Scholar]
- 55.Hurd CD, Schmerling L. Alkenyl derivatives of fluorescein. J Am Chem Soc. 1937;59(1):112–117. [Google Scholar]
- 56.Corrie JET, Trentham DR. Synthesis of photoactivatable fluorescein derivatives bearing side chains with varying properties. J Chem Soc, Perkin Trans 1. 1995;16:1993–2000. [Google Scholar]
- 57.Fairclough RH, Cantor CR. The use of singlet-singlet energy transfer to study macromolecular assemblies. Methods Enzymol. 1978;48:347–379. doi: 10.1016/s0076-6879(78)48019-x. [DOI] [PubMed] [Google Scholar]
- 58.Ouadahi K, Sbargoud K, Allard E, Larpent C. FRET-mediated pH-responsive dual fluorescent nanoparticles prepared via click chemistry. Nanoscale. 2012;4(3):727–732. doi: 10.1039/c2nr11413e. [DOI] [PubMed] [Google Scholar]
- 59.Stewart S, Ivy MA, Anslyn EV. The use of principal component analysis and discriminant analysis in differential sensing routines. Chem Soc Rev. 2014;43(1):70–84. doi: 10.1039/c3cs60183h. [DOI] [PubMed] [Google Scholar]
- 60.Skoog DA, Holler JF, Crouch SR. Principles of Instrumental Analysis. 6th Ed Thomson Brooks/Cole; Belmont, CA: 2007. [Google Scholar]
- 61.Saxberg BEH, Kowalski BR. Generalized standard addition method. Anal Chem. 1979;51(7):1031–1038. [Google Scholar]
- 62.Herrero A, Cruz Ortiz M, Arcos J, López-Palacios J, Sarabia L. Multiple standard addition with latent variables (MSALV): Application to the determination of copper in wine by using differential-pulse anodic stripping voltammetry. Anal Chim Acta. 1994;293(3):277–293. [Google Scholar]
- 63.Sena MM, Trevisan MG, Poppi RJ. Combining standard addition method and second-order advantage for direct determination of salicylate in undiluted human plasma by spectrofluorimetry. Talanta. 2006;68(5):1707–1712. doi: 10.1016/j.talanta.2005.08.024. [DOI] [PubMed] [Google Scholar]
- 64.Lozano VA, Ibañez GA, Olivieri AC. A novel second-order standard addition analytical method based on data processing with multidimensional partial least-squares and residual bilinearization. Anal Chim Acta. 2009;651(2):165–172. doi: 10.1016/j.aca.2009.08.027. [DOI] [PubMed] [Google Scholar]
- 65.Yousefinejad S, Hemmateenejad B. Simultaneous spectrophotometric determination of paracetamol and para-aminophenol in pharmaceutical dosage forms using two novel multivariate standard addition methods based on net analyte signal and rank annihilation factor analysis. Drug Test Anal. 2012;4(6):507–514. doi: 10.1002/dta.271. [DOI] [PubMed] [Google Scholar]
- 66.Mohseni N, Bahram M, Olivieri AC. Second-order advantage obtained from standard addition first-order instrumental data and multivariate curve resolution-alternating least squares. Calculation of the feasible bands of results. Spectrochim Acta A Mol Biomol Spectrosc. 2014;122:721–730. doi: 10.1016/j.saa.2013.11.073. [DOI] [PubMed] [Google Scholar]
- 67.Karimi MA, Mazloum Ardakani M, Behjatmanesh Ardakani R, Mashhadizadeh MH, Zadeh NZ. Application of H-point standard addition method and multivariate calibration methods to the simultaneous kinetic-potentiometric determination of hydrogen peroxide and peracetic acid. Anal Bioanal Electrochem. 2009;1(August):142–158. [Google Scholar]
- 68.Hemmateenejad B, Yousefinejad S. Multivariate standard addition method solved by net analyte signal calculation and rank annihilation factor analysis. Anal Bioanal Chem. 2009;394(7):1965–1975. doi: 10.1007/s00216-009-2870-1. [DOI] [PubMed] [Google Scholar]
- 69.Lorber A, Faber K, Kowalski BR. Net analyte signal calculation in multivariate calibration. Anal Chem. 1997;69(8):1620–1626. [Google Scholar]
- 70.Lorber A. Error propagation and figures of merit for quantification by solving matrix equations. Anal Chem. 1986;58(6):1167–1172. [Google Scholar]
Associated Data
This section collects any data citations, data availability statements, or supplementary materials included in this article.


