Abstract
Background:
Metabolic fingerprinting is a rapid and noninvasive analysis, representing a powerful approach for the characterization of phenotypes and the distinction of specific metabolic states due to environmental alterations. It has become a valuable analytical approach for the characterization of phenotypes and is the rapidly evolving field of the comprehensive measurement of ideally all endogenous metabolites in bio-samples. Silybin has displayed bright prospects in the prevention and therapy of liver injury, and we had conducted a preliminary exploration on the molecular mechanism of the hepatoprotective effects of silybin. Because the knowledge on the metabolic responses of an acute liver damage rat to the silybin is still scarce, metabolic fingerprinting can provide relevant information on the intrinsic metabolic adjustments.
Materials and Methods:
Here, the physiological and metabolic changes in the acute liver damage rat were investigated by performing a metabolic analysis. The phenotypic response was assessed by liquid chromatography/mass spectrometry (LC/MS) combined with pattern recognition approaches such as principal components analysis and partial least squares projection to supervised latent structures and discriminant analysis. Multivariate analysis of the data showed trends in scores plots that were related to the concentration of the silybin.
Results:
Results indicate 10 ions (7 upregulated and 3 downregulated) as differentiating metabolites. Key observations include perturbations of metabolic pathways linked to glutathione metabolism, tryptophan metabolism, cysteine and methionine metabolism, etc., Overall, this investigation illustrates the power of the LC/MS combined with the pattern recognition methods that can engender new insights into silybin affecting on metabolism pathways of an acute liver damage rat.
Conclusion:
The present study demonstrates that the combination of metabolic fingerprinting with appropriate chemometric analysis is a valuable approach for studying cellular responses to silybin drug and can provide additional insight into the mechanisms.
Keywords: Biomarkers, liquid chromatography/mass spectrometry, mechanism, metabolites, metabolomics, silybin
INTRODUCTION
Metabolomics is an emerging medium to high-throughput technology that can automatically identify, quantify and characterize hundreds to thousands of low molecular weight biochemicals simultaneously, using targeted or global analytical approaches.[1] The objective of metabolomics is the detection and identification of endogenous and exogenous metabolites to define the genotype or phenotype of a biological system. This approach can be the measurement of extracellular metabolites that are secreted and/or excreted from cells into their growth media.[2] This overall strategy is called metabolic fingerprinting. Metabolic fingerprinting is a high-throughput analytical technique which mostly uses spectroscopic methods for the classification of samples on the basis of their origin or biological relevance.[3] Metabolism is either directly or indirectly involved with every aspect of cell function, and metabolomics is thus believed to be a reflection of the phenotype of body. With hundreds of metabolites that are more closely related to the phenotype, metabolic fingerprinting can help us in understanding a detailed analysis of complex reaction networks and uncovering new drug targets.[4]
Silybin [Figure 1] is the main component of silymarin and is a polyphenolic bioactive natural product found in the milk thistle plant Silybum marianum. Silybin possesses many health-promoting benefits, such as treating liver diseases, and shows hepato-protectivity and contributes directly to the therapeutic effect.[5] The information about silybin's metabolomics characteristic, which is very important for new drug discovery, has not been found. Among the various techniques conventionally used for cancer metabolic profiling, ultra-performance liquid chromatography/mass spectrometry (LC/MS) has been proven to be a robust metabolomic tool and is widely applied in metabolite identification and quantification based on its high sensitivity, peak resolution and reproducibility.[6,7,8,9,10,11,12] LC coupled to mass spectrometry is the most commonly used analytical approach to obtain comprehensive metabolite profiles of biological samples.[13] LC-MS is a sensitive analytical instrument that presents the best chromatographic resolution in metabolite analysis. In addition, LC/MS is a powerful tool for global, sensitive and highly reproducible biochemical analysis and is very rapid due to the automated high-throughput analysis of biological samples and minimal sample preparation requirements.[14]
Figure 1.
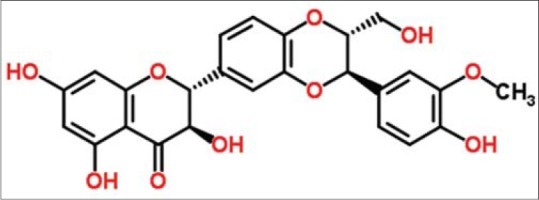
Chemical structure of silybin
Metabolomics analysis has many potential applications and advantages compared to currently used methods in the postgenomics era. It represents the final downstream product of cell function and as such may be a closer reflection of phenotype than the genome, transcriptome or proteome.[15] Changes in metabolism are quickly detected through changes in their metabolic fingerprint profile.[16,17,18] With the use of appropriate methodologies, metabolomics appears to be a useful tool to investigate the metabolic function of acute liver damage in rat and to assess changes in response to exposed to the silybin. Furthermore, the focus of the study was not only to evaluate the changes of the urine metabolite pools. In order to contribute to an understanding of the mechanism of this drug against the acute liver damage rat, in this study we investigate the changes in urine metabolites of acute liver damage in rat to silybin drug.
MATERIALS AND METHODS
Chemicals and reagents
Acetonitrile was purchased from Merck (Darmstadt, Germany); methanol high-performance liquid chromatography (HPLC grade) was purchased from Fisher Scientific Corporation (Loughborough, UK); water was produced by a Milli-Q Ultra-pure water system (Millipore, Billerica, USA); formic acid was obtained from Honeywell Company (Morristown, New Jersey, USA); leucine enkephalin was purchased from Sigma-Aldrich (St. Louis, MO, USA). Olive oil (Oliver grade) was supplied by the branch office of Shanghai of OlisOlive Oil Bloc (Catalonia, Spain). All other reagents were HPLC grade. Silybin was obtained from Yuanhengshengma Biotechnology Co., Ltd. (Beijing, China).
Animals
Male Wistar rats (weighting 240 ± 20 g) were supplied by GLP Center of Heilongjiang University of Chinese Medicine (Harbin, China). The room temperature was regulated at 24°C ± 2°C with 40% ±5% humidity. A 12-h light/dark cycle was set, free access to standard diet and water. The animals were allowed to acclimatize for 5 days prior to dosing and putted in the metabolism cages during the urine collection periods specified below. After acclimatization, animals were randomly divided into three groups with eight rats in each: The control; model; and silybin groups. The rats in the control group were administrated with olive oil solution in the whole procedure for 5 consecutive days. Rats were orally administrated with 25% CCl4 (1 ml/kg body weight) olive oil solution at 4th day to induce liver injury model for 5 consecutive days, and until day 8. Simultaneously, silybin treatment group was administrated with 25% CCl4 (1 ml/kg body weight) olive oil solution for 5 consecutive days, and then the rats were administrated drug (0.5 mg/mL) olive oil solution with an oral accurate volume of each animal (1 mL/100 g body weight). Rats were housed individually for urine collection. Urine was collected daily from metabolism cages at ambient temperature throughout the whole procedure and centrifuged at 13,000 rpm at 4°C for 5 min, and the supernatants were stored frozen at − 20°C until metabolomic analysis. The experimental procedures were approved by the Animal Care and Ethics Committee at Heilongjiang University of Chinese Medicine (approval number: HUCM2013-7023). All efforts were made to ameliorate suffering of animals.
Metabolomic profiling platform
Ultra-performance liquid chromatography
All samples were analyzed using an LC system (Waters Corp., Milford, USA), equipped with BEH C18 chromatography column with 0.18-μm stationary phase. The column temperature was maintained at 40°C, and then gradient mobile phase was composed of the phase A (water with 0.1% formic acid) and phase B (acetonitrile containing 0.1% formic acid). The gradient for the urine sample was as follows: 0–6 min, 1–55% B; 6–10 min, 55–50% B; 10–10.5 min, 50–1% B; 10.5–11 min, 1% B; 11–11.5 min, 1–99% B; 11.5–13 min, 99% B. The injection volume was 3 μL and the flow rate of the LC system was 0.5 mL/min. All samples were maintained at 4°C during the analysis. All the urine samples were mixed to get a quality control (QC) sample for method validation. A QC sample was injected every ten samples during the analytical run to further monitor the system stability. It was critical to acquire the QC data for assessing the changes in the analytical results and the reliability of the metabolite fingerprint.
Accurate mass spectrometry
Mass spectrometry system was operated using the ESI + and ESI − mode and the mass range was set at 100–1000 m/z in the full scan mode. Mass spectrometry was performed by using an accurate mass time-of-flight mass spectrometry system (Waters Corp., Milford, USA) equipped with an electrospray ionization source that operates in positive ionization mode (ESI+) and negative ionization mode (ESI−). The optimal capillary voltage was set at 3200 V, and cone voltage at 30 V. The desolvation temperature was set at 300°C, and source temperature at 100°C. Desolvation gas flow rate was set at 400 L/h, and cone gas flow was maintained at 60 L/h. Leucine enkaphalin was used as the reference compound for accurate mass measurement. Data were collected at a rate of 1 MS spectrum per second with a scan time of 0.4 s, an inter-scan delay of 0.1 s, and a lock spray frequency of 10 s.
Metabolite identification
The chemical structures of the candidate metabolites were determined as follows: First, the MassFragment™ application manager (Waters Corp., Milford, USA) was searched by mass weight and a list of candidates was obtained; then tandem mass analysis was carried out, and according to the possible fragment mechanisms, items without characteristic mass fragment information were removed from the list, with the most probable metabolic indicators survived; finally, by comparing the retention times and mass spectra to the commercial standards, part of the related metabolites were structurally confirmed. The accurate mass and structure information of candidate metabolites were also matched with those of metabolites obtained from HMDB (www.hmdb.ca) and METLIN (metlin.scripps.edu/) databases.
Data processing and statistical analysis
Multivariate analysis was performed to determine the origin of variation between samples. This was then extended by the use of univariate analysis to determine whether the concentrations of individual metabolites differed for the metabolic fingerprint. The multivariate statistical analyses were performed with EZinfo software (Waters Corp., Milford, USA), which was facilitated by reducing the dimensionality of the dataset while retaining as much information as possible. EZinfo software was programmed using in-house routines and was then used to perform unsupervised principal components analysis (PCA) and partial least squares projection to supervised latent structures and discriminant analysis (PLS-DA) on LC-MS spectral datasets from the fingerprinting of samples. PCA is one of the oldest and most widely used multivariate techniques; it is employed to reduce the dimensionality of spectroscopic data whilst maintaining the majority of its variance, and is often used as an initial step prior to cluster or discriminant analysis. The purpose of PLS-DA was to calculate models of the different groups, and to identify the response variables that contribute most strongly to the model. The combining S-and VIP-plots from the OPLS analysis were carried out to select distinct variables as potential markers.
Pathway analysis
Metabolomic pathway analysis was performed with metabolomics pathway analysis (MetPA) based on potential metabolite biomarkers. MetPA is a user-friendly, web-based tool (www.metaboanalyst.ca) for pathway analysis and visualization of metabolomic data within the biological context of metabolic pathways. For the pathway analysis algorithms, hypergeometric test was used for over representation analysis, and relative-betweeness Centrality was used for pathway topology analysis. SPSS 17.0 using the Wilcoxon Mann–Whitney Test for Windows was used for the statistical analysis (SPSS, Inc., Chicago, IL).
RESULTS AND DISCUSSION
Method development and validation
For the method validation study, 1 mL of urine the samples from each rat were pooled to get a QC specimen, and preparation of the QC specimen was the same as the samples. A number of consecutive injections of the QC sample were made to obtain a stable QTOF/MS system. QC specimens were analyzed every ten specimens throughout the whole analysis procedure. According to the optimized conditions of urine analysis, principal component analysis of QC samples from liver injury rats was shown in Figure S1, QC samples were gathered together to determine during the data collection, demonstrating that the system had excellent stability during the analysis procedure.
Figure S1.
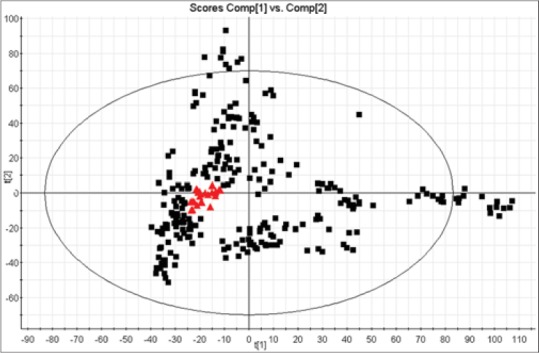
Principal component analysis of quality control (QC) urine samples carried out with liquid chromatography/mass spectrometry. Black box present urine samples, and samples in red box present QCs
Typical fingerprinting spectra of urine samples
Experimental strategies to study compounds present in a biological system have expanded greatly in recent years. Metabolomics can detect and identify endogenous and secreted metabolites. Visual comparison of each group at 8th day, typical fingerprinting spectra are shown in Figure 2. The acquired metabolomic data were used to perform LC/MS, which involves discovering principal components that account for the majority of the differences in the data. Recently, PCA is frequently used as a multivariate analysis in metabolomics studies to separate or determine the classes of known samples. For global profiling, unsupervised PCA was performed to separate the groups. Due to the low concentrations of metabolites secreted into the growth medium relative to the high levels of normal medium components, it is difficult to detect metabolic changes by simple visual inspections of the data. Therefore, PCA scores plot showed clear separation between the control groups and model group in both positive [Figure 3a] and negative ion modes [Figure 4a]. Figures 3a and 4a show that separate clusters from the urine samples are revealed, which indicates metabolic differences in terms of the level and compositional changes of metabolites secreted, irrespective of drug level exposure. It successfully demonstrated that each data class presents distinct metabolite profiles, with samples from the same data class clustering very close to each other.
Figure 2.
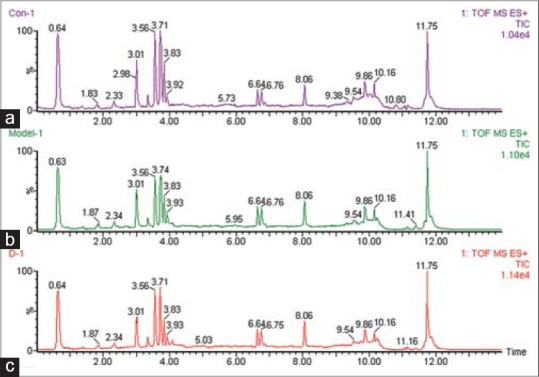
Typical fingerprinting spectra of urine samples at 8th day. (a) control group; (b) Acute liver damage rat group; (C) The silybin group
Figure 3.
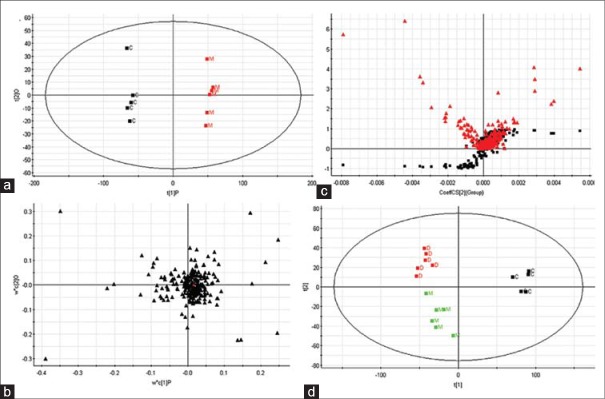
Analysis of the metabolic fingerprinting profiles obtained from the acute liver damage rat group analysed by liquid chromatography/mass spectrometry system in positive ionization mode at 8th day. Principal components analysis (PCA) model results in positive mode (a). Loading plot of OPLS-discriminant analysis in positive mode (b). Panel (c) illustrates the combination of S-and VIP-score plots constructed from the supervised OPLS analysis. (d) PCA scores plot of silybin affecting on acute liver damage rat group (ESI + mode)
Figure 4.
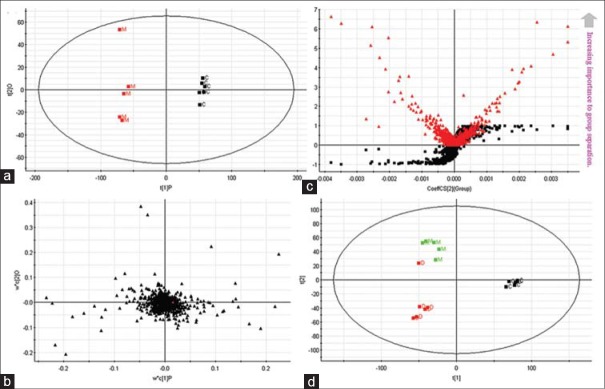
Establishment of the metabolic fingerprinting profiles of urine samples based on mass fragment profiles analysed by liquid chromatography/mass spectrometry system in negative ionization mode at 8th day. Principal components analysis (PCA) model results in negative mode (a). Loading plot of OPLS-discriminant analysis in negative mode (b). Panel (c) illustrates the combination of S-and VIP-score plots constructed from the supervised OPLS analysis (ESI − mode). (d) PCA scores plot of silybin affecting on acute liver damage rat group (ESI − mode)
Discriminatory metabolites
We applied PLS to visualize samples in an attempt to distinguish them among classes, which revealed a very clear separation. From the corresponding the loading plots, the ions furthest away from the origin may be therefore regarded as the differentiating metabolites [Figures 3b and 4b]. Combining the S-and VIP-plots from the OPLS analysis [Figures 3c and 4c], LC-MS provided the retention time, precise molecular mass and MS/MS data for the metabolites. For OPLS-DA modeling, to identify which variables account for such a significant separation, VIP statistics was initially used to pre-select variables. As shown in Table 1, according to the criterion for VIP statistics (VIP >5), among the low-molecular-weight endogenous metabolites, a total of 10 variables as displayed in Table 1 were obtained which contributed most toward discriminating the metabolic profiles between the two classes. Intriguingly, 7 of the metabolites detected were found to be up-regulated in cancer tissues while 3 were down-regulated. Identification and statistical analysis revealed significant elevation of kynurenine, propionylcarnitine, palmitoylcarnitine, uridine, glutathione, 4,8-dimethylnonanoylcarnitine, stearoylcarnitine while revealing significant reduction of L-(+)-Cysteine, adenosine, and tryptophan. According to the identity check based on raw data and the features of peaks, the target masses of candidate metabolites identified in the profiling process were searched over a narrow ± 5 ppm mass window in the HMDB and METLIN databases. We report that PCA scores plots from metabolic fingerprintings reveal excellent separation between the control group, model group, and rats exposed to the silybin group. Trends according to individual PCA scores plots from fingerprinting also reveal that metabolic relationships between drug and spectra are more significant.
Table 1.
Differential metabolites derived from LC/MS chromatograms

Metabolic pathway analysis
The detailed analysis of the most relevant pathways of MPH was performed by MetPA's tool that is a mass translator into pathways. MetPA assigned a total of feature compounds in 11 pathways, which were identified together are important for the host response to silybin [Figure 5a and Table S1]. The main metabolic pathways included glutathione metabolism, thiamine metabolism, taurine and hypotaurine metabolism, aminoacyl-tRNA biosynthesis, pantothenate and CoA biosynthesis, cysteine and methionine metabolism, glycine, serine and threonine metabolism, fatty acid metabolism, tryptophan metabolism, pyrimidine metabolism, and purine metabolism, etc., of the predominant metabolism pathways of glutathione metabolism [Figure 5b], tryptophan metabolism [Figure 5c], cysteine and methionine metabolism [Figure 5d] have been constructed based on KEGG pathway database. These metabolic pathways of importance, used to explain the metabolic pathway, were found to be disturbed in the animal model. Our preliminary experiments clearly show that metabolic fingerprinting profiling is capable of detecting responses to silybin drug and is certainly a more sensitive method than traditional techniques used for insighting into the mechanisms.
Figure 5.
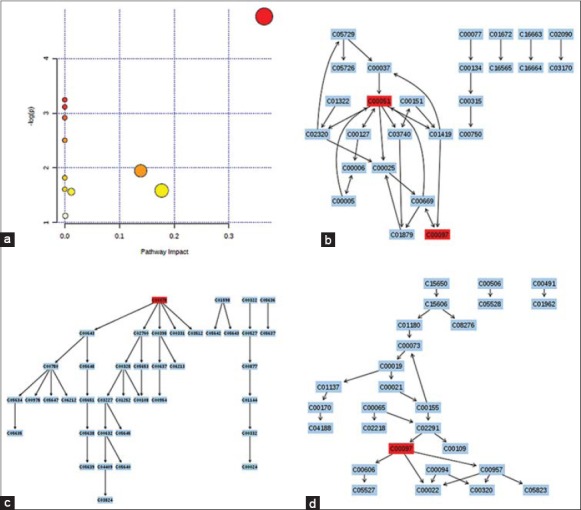
Construction of the altered metabolism pathways in acute liver damage rats using metabolomics pathway analysis (a). The map was generated using the reference map by KEGG [Table S1]. CO represents entry number of compound. (c) Glutathione metabolism; (c) tryptophan metabolism; (d) cysteine and methionine metabolism
Table S1.
Result from ingenuity pathway analysis with MetPA

Metabolite set enrichment analysis
We systemically integrated phenotyping with metabolite expression, and metabolomics, thereby identifying a distinguishing metabolic fingerprinting of model rats. Following MetPA analysis, which was aimed to identify the relative contribution of individual metabolites from the high-dimensional metabolomics data, we performed metabolite set enrichment analysis (MSEA) to establish which pathways are affected. In liver, the best metabolites to understand the phenotypic response of rats exposed to the silybin were in glutathione metabolism, oxidation of branched-chain fatty acids, protein biosynthesis, tryptophan metabolism, taurine and hypotaurine metabolism etc., [Figure 6], and these insights help us to better understand the mechanisms underlying of this drug.
Figure 6.
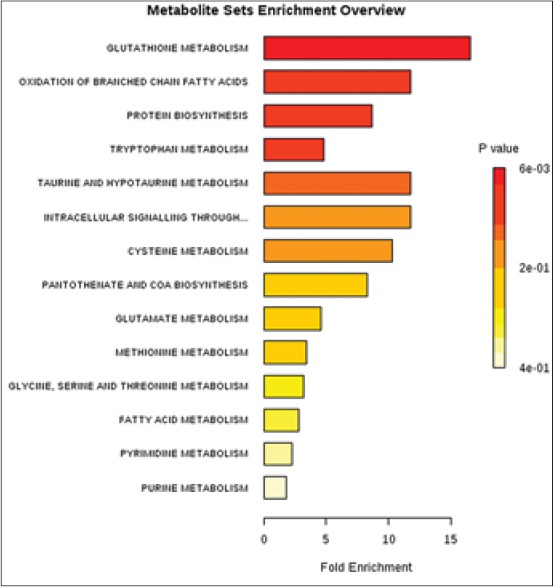
Summary plot for metabolite set enrichment analysis where metabolite sets are ranked according to Holm P value with hatched lines showing the cut-off of Holm P value
Silybin is a well-known highly effective drug used routinely for the treatment of liver injury. Yet despite there being observed efficacy against liver injury, the prospective mechanism of action of this drug against liver injury has not been fully studied. Thus, investigation of the changes of urine metabolites caused by silybin on acute liver damage in rat could increase understanding of the mode of action of the drug. To elucidate the underlying mechanisms of silybin action on acute liver damage in rat, a total of 10 metabolites that were differentially regulated were detected [Table 1]. Seven metabolites were significantly increased, three metabolites decreased relative to control. Based on the findings of this study, it would appear that many different metabolic pathways are disrupted as a result of silybin action on acute liver damage in rat, most notably glutathione metabolism, tryptophan metabolism, cysteine, and methionine metabolism, etc., The metabolic fingerprinting analysis is supported on the basis that cells can secrete metabolites to the extracellular medium during growth and/or in response to environmental changes.[19] Furthermore, cells may activate a variety of efflux transporters that work like metabolic relief valves or defensive support to survive an antagonistic environment.[20]
In our study, LC-MS-based urine metabolomics coupled with pattern recognition approach and network analysis provide a powerful approach to clearly elucidate the underlying mechanisms of silybin action on acute liver damage in rat. PCA model derived from LC/MS metabolic fingerprinting showed satisfactory and adequate separations between control group and acute liver damage group. Interestingly, 10 distinct metabolites were identified in acute liver damage rat compared to controls, and suggest a disrupted the glutathione metabolism, thiamine metabolism, taurine and hypotaurine metabolism, aminoacyl-tRNA biosynthesis, pantothenate and CoA biosynthesis, cysteine and methionine metabolism, glycine, serine and threonine metabolism, fatty acid metabolism, tryptophan metabolism, pyrimidine metabolism, and purine metabolism, etc., Differential metabolites identified from the metabolomic analysis would be helpful for the prevention and treatment, the occurrence and development of therapy of liver injury. More importantly, 11 metabolism pathways were found that the most altered functional pathway associated with silybin. Since the PCA scores plot obtained from the acute liver damage in rat also shows a very similar trend to that from the fingerprint, it is clearly demonstrated that the changes of metabolites are well correlated to those of intracellular components in terms of response to silybin. Nevertheless, metabolic fingerprintings are just a shallow representation of the metabolic state and the full understanding of the underlying mechanisms, require further inspection of key metabolites (e.g., metabolites that are important nodes in the metabolic network) or the combination with other experimental strategies (e.g., gene expression and proteomics).
CONCLUSIONS
Metabolomics is the study of metabolic changes in biological systems and provides characteristic small molecule fingerprints related to the mechanisms of silybin action. In this study, we focused on small-molecule metabolites to investigate the characteristics of therapy development of liver injury. To our knowledge, this is a report on urine metabolomics analysis of silybin affecting on metabolism pathways of acute liver damage in rat, using high-throughput LC/MS combined with pattern recognition approach. The objective of this study was to provide valuable data with which to support the prospective new use of silybin as a topically applied drug for the treatment of liver injury. Our study shows that the spectral datasets obtained from an acute liver damage rat, in combination with multivariate statistical methods, do contain valuable information pertinent to the against liver injury effect. In the future, high-throughput LC/MS metabolomics combined with pattern recognition approach analysis are keys to elucidate the developing physiological mechanism of drug and will play an important role in the field of drug research.
ACKNOWLEDGMENTS
This work was supported by grants from the Key Program of Natural Science Foundation of State (Grant No. 81302905).
Footnotes
Source of Support: This work was supported by grants from the Key Program of Natural Science Foundation of State (Grant No. 81302905)
Conflict of Interest: None declared.
REFERENCES
- 1.Wang X, Yang B, Sun H, Zhang A. Pattern recognition approaches and computational systems tools for ultra performance liquid chromatography-mass spectrometry-based comprehensive metabolomic profiling and pathways analysis of biological data sets. Anal Chem. 2012;84:428–39. doi: 10.1021/ac202828r. [DOI] [PubMed] [Google Scholar]
- 2.Wang X, Zhang A, Wang P, Sun H, Wu G, Sun W, et al. Metabolomics coupled with proteomics advancing drug discovery toward more agile development of targeted combination therapies. Mol Cell Proteomics. 2013;12:1226–38. doi: 10.1074/mcp.M112.021683. [DOI] [PMC free article] [PubMed] [Google Scholar]
- 3.Wang X, Zhang A, Han Y, Wang P, Sun H, Song G, et al. Urine metabolomics analysis for biomarker discovery and detection of jaundice syndrome in patients with liver disease. Mol Cell Proteomics. 2012;11:370–80. doi: 10.1074/mcp.M111.016006. [DOI] [PMC free article] [PubMed] [Google Scholar]
- 4.Zhang A, Sun H, Han Y, Yuan Y, Wang P, Song G, et al. Exploratory urinary metabolic biomarkers and pathways using UPLC-Q-TOF-HDMS coupled with pattern recognition approach. Analyst. 2012;137:4200–8. doi: 10.1039/c2an35780a. [DOI] [PubMed] [Google Scholar]
- 5.Zhang S, Yang Y, Liang Z, Duan W, Yang J, Yan J, et al. Silybin-mediated inhibition of Notch signaling exerts antitumor activity in human hepatocellular carcinoma cells. PLoS One. 2013;8:e83699. doi: 10.1371/journal.pone.0083699. [DOI] [PMC free article] [PubMed] [Google Scholar]
- 6.Sun H, Zhang AH, Zou DX, Sun WJ, Wu XH, Wang XJ. Metabolomics coupled with pattern recognition and pathway analysis on potential biomarkers in liver injury and hepatoprotective effects of yinchenhao. Appl Biochem Biotechnol. 2014;173:857–69. doi: 10.1007/s12010-014-0903-5. [DOI] [PubMed] [Google Scholar]
- 7.Zhang AH, Qiu S, Xu HY, Sun H, Wang XJ. Metabolomics in diabetes. Clin Chim Acta. 2014;429:106–10. doi: 10.1016/j.cca.2013.11.037. [DOI] [PubMed] [Google Scholar]
- 8.Zhang AH, Sun H, Yan GL, Yuan Y, Han Y, Wang XJ. Metabolomics study of type 2 diabetes using ultra-performance LC-ESI/quadrupole-TOF high-definition MS coupled with pattern recognition methods. J Physiol Biochem. 2014;70:117–28. doi: 10.1007/s13105-013-0286-z. [DOI] [PubMed] [Google Scholar]
- 9.Zhang AH, Sun H, Han Y, Yan GL, Yuan Y, Song GC, et al. Ultraperformance liquid chromatography-mass spectrometry based comprehensive metabolomics combined with pattern recognition and network analysis methods for characterization of metabolites and metabolic pathways from biological data sets. Anal Chem. 2013;85:7606–12. doi: 10.1021/ac401793d. [DOI] [PubMed] [Google Scholar]
- 10.Zhang AH, Wang P, Sun H, Yan GL, Han Y, Wang XJ. High throughput ultra-performance liquid chromatography-mass spectrometry characterization of metabolites guided by a bioinformatics program. Mol Biosyst. 2013;9:2259–65. doi: 10.1039/c3mb70171a. [DOI] [PubMed] [Google Scholar]
- 11.Zhang AH, Sun H, Wang XJ. Recent advances in metabolomics in neurological disease, and future perspectives. Anal Bioanal Chem. 2013;405:8143–50. doi: 10.1007/s00216-013-7061-4. [DOI] [PubMed] [Google Scholar]
- 12.Zhang AH, Sun H, Qiu S, Wang XJ. Metabolomics in noninvasive breast cancer. Clin Chim Acta. 2013;424:3–7. doi: 10.1016/j.cca.2013.05.003. [DOI] [PubMed] [Google Scholar]
- 13.Zhang A, Sun H, Wang X. Urinary metabolic profiling of rat models revealed protective function of scoparone against alcohol induced hepatotoxicity. Sci Rep. 2014;4:6768. doi: 10.1038/srep06768. [DOI] [PMC free article] [PubMed] [Google Scholar]
- 14.Zhang A, Zhou X, Zhao H, Guan Y, Zhou S, Yan GL, et al. Rapidly improved determination of metabolites from biological data sets using the high-efficient TransOmics tool. Mol Biosyst. 2014;10:2160–5. doi: 10.1039/c4mb00222a. [DOI] [PubMed] [Google Scholar]
- 15.Zhang A, Yan G, Han Y, Wang X. Metabolomics approaches and applications in prostate cancer research. Appl Biochem Biotechnol. 2014;174:6–12. doi: 10.1007/s12010-014-0955-6. [DOI] [PubMed] [Google Scholar]
- 16.Sun H, Zhang S, Zhang A, Yan G, Wu X, Han Y, et al. Metabolomic analysis of diet-induced type 2 diabetes using UPLC/MS integrated with pattern recognition approach. PLoS One. 2014;9:e93384. doi: 10.1371/journal.pone.0093384. [DOI] [PMC free article] [PubMed] [Google Scholar]
- 17.Zhang A, Sun H, Yan G, Wang P, Han Y, Wang X. Metabolomics in diagnosis and biomarker discovery of colorectal cancer. Cancer Lett. 2014;345:17–20. doi: 10.1016/j.canlet.2013.11.011. [DOI] [PubMed] [Google Scholar]
- 18.Zhang A, Sun H, Wang P, Han Y, Wang X. Modern analytical techniques in metabolomics analysis. Analyst. 2012;137:293–300. doi: 10.1039/c1an15605e. [DOI] [PubMed] [Google Scholar]
- 19.Wang X, Lv H, Zhang A, Sun W, Liu L, Wang P, et al. Metabolite profiling and pathway analysis of acute hepatitis rats by UPLC-ESI MS combined with pattern recognition methods. Liver Int. 2014;34:759–70. doi: 10.1111/liv.12301. [DOI] [PubMed] [Google Scholar]
- 20.Zhang A, Sun H, Han Y, Yan G, Wang X. Urinary metabolic biomarker and pathway study of hepatitis B virus infected patients based on UPLC-MS system. PLoS One. 2013;8:e64381. doi: 10.1371/journal.pone.0064381. [DOI] [PMC free article] [PubMed] [Google Scholar]


