Abstract
Background:
Liquid-liquid extraction of Lonicera japonica and Artemisia annua (JQ) plays a significant role in manufacturing Reduning injection. Many process parameters may influence liquid-liquid extraction and cause fluctuations in product quality.
Objective:
To develop a near-infrared (NIR) spectroscopy method for on-line monitoring of liquid-liquid extraction of JQ.
Materials and Methods:
Eleven batches of JQ extraction solution were obtained, ten for building quantitative models and one for assessing the predictive accuracy of established models. Neochlorogenic acid (NCA), chlorogenic acid (CA), cryptochlorogenic acid (CCA), isochlorogenic acid B (ICAB), isochlorogenic acid A (ICAA), isochlorogenic acid C (ICAC) and soluble solid content (SSC) were selected as quality control indicators, and measured by reference methods. NIR spectra were collected in transmittance mode. After selecting the spectral sub-ranges, optimizing the spectral pretreatment and neglecting outliers, partial least squares regression models were built to predict the content of indicators. The model performance was evaluated by the coefficients of determination (R2), the root mean square errors of prediction (RMSEP) and the relative standard error of prediction (RSEP).
Results:
For NCA, CA, CCA, ICAB, ICAA, ICAC and SSC, R2 was 0.9674, 0.9704, 0.9641, 0.9514, 0.9436, 0.9640, 0.9809, RMSEP was 0.0280, 0.2913, 0.0710, 0.0590, 0.0815, 0.1506, 1.167, and RSEP was 2.32%, 4.14%, 3.86%, 5.65%, 7.29%, 6.95% and 4.18%, respectively.
Conclusion:
This study demonstrated that NIR spectroscopy could provide good predictive ability in monitoring of the content of quality control indicators in liquid-liquid extraction of JQ.
Keywords: liquid-liquid extraction, near-infrared spectroscopy, on-line monitoring, partial least squares
INTRODUCTION
Lonicera japonica (Jinyinhua in Chinese) and Artemisia annua (Qinghao in Chinese) are two fundamental herbs in Reduning injection, which has long been used for the treatment of upper respiratory tract infections in China. Previous studies have shown that primary bioactive compounds of Jinyinhua are caffeoylquinic acids,[1] including neochlorogenic acid (NCA), chlorogenic acid (CA), cryptochlorogenic acid (CCA), isochlorogenic acid B (ICAB), isochlorogenic acid A (ICAA) and isochlorogenic acid C (ICAC), which possess anti-inflammatory properties.[2] The primary compounds of Qinghao are artemisinin and essential oil,[3] which show antimalarial and antibacterial activities.[4]
liquid-liquid extraction separates one or several substances present in a liquid phase by the addition of another liquid phase in which these substances transferred preferentially.[5] It is a widely used purification technique in manufacturing traditional Chinese medicine (TCM), with its ability to remove impurities such as proteins and polysaccharides because of their low solubility in organic solvent phase.[6] Nevertheless, many process parameters may influence extraction process, such as temperature, initial density of starting material, volume of solvent, flow rate of solvent and pH of the solution. These factors can have a large impact on the downstream unit operations as well as on the final drug quality.
It is reported that the national adverse drug reaction monitoring database collected 12,000 adverse drug events about Chinese herbal injection in 2013. The safety evaluation of Chinese herbal injection has been concerned dramatically, and batch-to-batch variations are a major issue on safety. It is necessary to adopt effective analytical techniques for timely assessment of critical quality attributes in Chinese herbal injection.[7] Various methods have been applied for quality control, such as ultraviolet spectroscopy, high-performance liquid chromatography (HPLC), liquid chromatography-mass spectrometry (LC-MS), gas chromatography (GC) and GC-MS.[8,9,10] All these conventional methods are time-consuming and reagent-consuming. However, the near-infrared (NIR) spectroscopy technique has proven its effectiveness in different fields, such as agriculture,[11] food,[12,13] oil,[14] chemical[15] and pharmaceutical industries[16,17] relying on its speed, accuracy, low cost and non-destructive characteristic toward the analyzed sample.[18] There are many comprehensive reviews demonstrating the successful use of NIR spectroscopy for quantitative and qualitative analysis in TCM research.[19,20,21,22] Therefore, NIR technique is applied to study liquid-liquid extraction of JQ in this research.
Neochlorogenic acid, CA, CCA, ICAB, ICAA and ICAC are the principal bioactive components in Reduning injection[23] and have relatively high concentration in the JQ extraction solution. The soluble solid content (SSC) is the percentage of the total content of substances dissolved in the solution and indicates the purification ability of liquid-liquid extraction. Therefore, NCA, CA, CCA, ICAB, ICAA, ICAC and SSC were selected as quality control indicators in liquid-liquid extraction of JQ. Partial least squares (PLS) algorithm was applied to construct quantitative models to predict the content of above indicators. The prediction accuracy of the established models was evaluated by statistical parameters.
MATERIALS AND METHODS
Materials
Reference substance of CA was purchased from National Institutes for Food and Drug Control (Beijing, China). Reference substances of NCA, CCA, ICAB, ICAA and ICAC were purchased from Chengdu Must Bio-technology Co., LTD. HPLC grade methanol was obtained from Tedia Company (Fairfield, USA). Deionized water was obtained from a Mill-Q water purifier system (Millipore, Bedford, MA, USA). All the other reagents utilized in the article were of analytical grade.
Liquid-liquid extraction process
The process flow diagram of liquid-liquid extraction of JQ is shown in Figure 1. The countercurrent extraction column was made of glass pipe and packed with stainless-steel Raschig rings.[24] Twelve separate columns comprised a group and their pipelines converged into a main pipeline down to a storage tank. Firstly, the pH value of starting materials was adjusted to 2.0 through adding hydrochloric acid. Then starting materials were divided into twelve parts evenly, and each pumped into the extraction column. Next, water-saturated ethyl acetate used as extraction solvent was continuously pumped into the column from the bottom. The extraction solution began to flow out from the column after adding ethyl acetate for 2 h. The extraction usually lasted for 10–12 h, which depended on the volume of starting materials. A sampling valve was installed into the main pipeline to collect extraction solution. NIR transmission probes were immersed into the solution to collect spectra.
Figure 1.
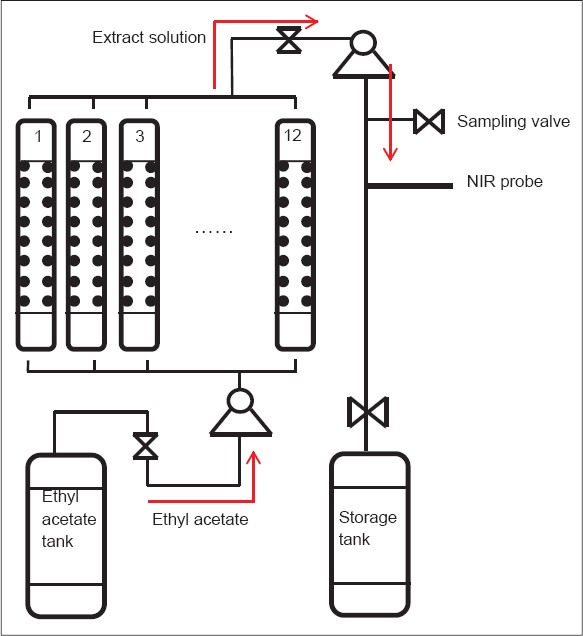
The process flow diagram of liquid-liquid extraction of JQ
Sample collection
The sample was collected with a volume of 80 mL at 20 min interval at the same time the sampling time was recoded. The number of samples may vary among batches because the volume of starting materials was different. Spectra were automatically collected every 20 s. According to the recorded sampling time, the corresponding spectrum was selected from the continuous spectra. Eleven batches of samples were collected in total, ten batches (250 samples) as a calibration set for model development and one (27 samples) as a prediction set for model evaluation. Each sample was marked as batch number-sampling order, e. g, 140110-1, meaning the first sample collected from batch 140110.
Reference assays
A new ultra-high performance liquid chromatography (UPLC) method was developed to measure the content of NCA, CA, CCA, ICAB, ICAA and ICAC. The chromatographic analysis was performed on an Agilent 1290 UPLC system (Agilent Technologies, USA), which was comprised of a quaternary bump, an online vacuum degasser, an auto-sampler, a thermostatic column compartment and a diode-array detector. The chromatographic separations were undertaken on an Agilent ZORBAX SB-C18 column (100 mm × 3.0 mm, 1.8 μm). Solvent A [methanol] and solvent B (aqueous phosphoric acid solution [0.1%, v/v]) were used as mobile phase for the gradient elution [Table 1]. The detection wavelength was set at 324 nm. The flow rate was 0.4 mL/min and the injection volume was 2 μL. The column temperature was maintained at 30°C.
Table 1.
Gradient elution schedule

The extraction solution was centrifuged at 10,000 rpm for 10 min and then diluted to 50 mL with methanol:water (50:50, v/v). The supernatant fluid was passed through a 0.22 μm syringe filter, and 2 μL filtrate was injected into the UPLC system.
The SSC was determined by drying 5 mL centrifuged solution at 105°C to a constant weight. The results are expressed in weight mg/mL.
Spectral collection
A Luminar 3060 acousto-optic tunable filter-NIR spectrometer (Brimrose Co., USA) with an InGaAs detector was used to collect NIR spectra in transmittance mode. Two fiber optic probes with 2 mm optical path length were connected to the spectrometer by an optical fiber. The spectral range was from 1,100 nm to 2,300 nm. Each spectrum was the average of 200 scans with a wavelength increment of 2 nm.
Spectral preprocessing
Spectral preprocessing is the mathematical correction of spectra that reduce, eliminate or standardize the effect of variable physical properties or instrumental effects.[25] A variety of preprocessing methods were used to separate the useful information from noise, such as multiplicative signal correction (MSC), standard normal variate, first derivative, the second derivative and Savitzk-Golay smoothing. The optimum method was selected based on the lowest root mean square errors of calibration (RMSEC) and root mean square errors of cross-validation (RMSECV).[26]
Model building
A PLS model was constructed by spectral data matrix X and the reference content matrix Y. Model was validated by cross-validation with the leave-one-out method. The leaving-one-out method is leaving one sample out, using the rest of the samples in the calibration set to predict the sample being left out.[27]
RESULTS
Method validation for ultra-high performance liquid chromatography
The UPLC chromatograms of mixed standards [Figure 2a] and sample solution [Figure 2b] were baseline separated. The calibration curves were created by plotting the concentration (x, μg/mL) versus the peak area (y) of each analyte. The linear regression equations and the coefficients of determination (R2) were as follows: Y = 14.48x + 0.214 (R2 = 0.9999), for NCA; y = 14.108x − 5.757 (R2 = 0.9999), for CA; y = 12.657x − 0.331 (R2 = 0.9999), for CCA; y = 14.394x − 0.909 (R2 = 0.9999), for ICAB; y = 16.956x − 3.364 (R2 = 0.9999), for ICAA; y = 16.066x − 8.299 (R2 = 0.9999), for ICAC. Good linearity was achieved in the investigated ranges. The linear ranges were 4.28–17.12, 36.72–146.88, 7.75–31.01, 7.28–29.13, 8.39–33.57 and 15.66–62.64 μg/mL for NCA, CA, CCA, ICAB, ICAA and ICAC, respectively.
Figure 2.
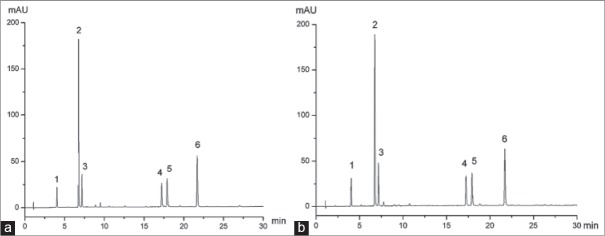
The ultra-high performance liquid chromatography chromatograms of mixed standards (a) and sample solution (b). (1: Neochlorogenic acid; 2: Chlorogenic acid; 3: Cryptochlorogenic acid; 4: Isochlorogenic acid B; 5: Isochlorogenic acid A; 6: Isochlorogenic acid C)
The repeatability of the method was determined by analyzing six independently prepared solution of sample 140110–11. The relative standard derivation (RSD) values of the concentration for six analytes were found to be within 0.94–1.08%.
The stability was tested at room temperature by analyzing the same solution (140110–11) at 0, 2, 4, 8, 16 and 24 h, respectively. The RSD values of the peak areas for six analytes were all <1.11%, indicating sample solution was stable within 24 h.
The percent recovery was detected by adding known amounts of the corresponding analytes to previously analyzed sample 140110–11 and reanalyzing the sample. The percent recovery was between 97.32% and 103.40%, with RSD values <1.73% for six analytes, indicating the analytical method used for quantitative determination was acceptable.
Dynamic curves during liquid-liquid extraction of JQ
The dynamic curves for NCA, CA, CCA, ICAB, ICAA, ICAC and SSC of batch 140110 during liquid-liquid extraction of JQ are shown in Figure 3. These indicators had similar changing trends, and their concentration constantly decreased with the passage of time. It is easy to notice that CA and ICAC decreased dramatically, but NCA, CCA, ICAB and ICAA declined slowly. Their content tended to be stable in the 600th min. SSC dropped from 23 mg/mL to 4.4 mg/mL, indicating the effective ingredients were transferred into the ethyl acetate solution from the starting material.
Figure 3.
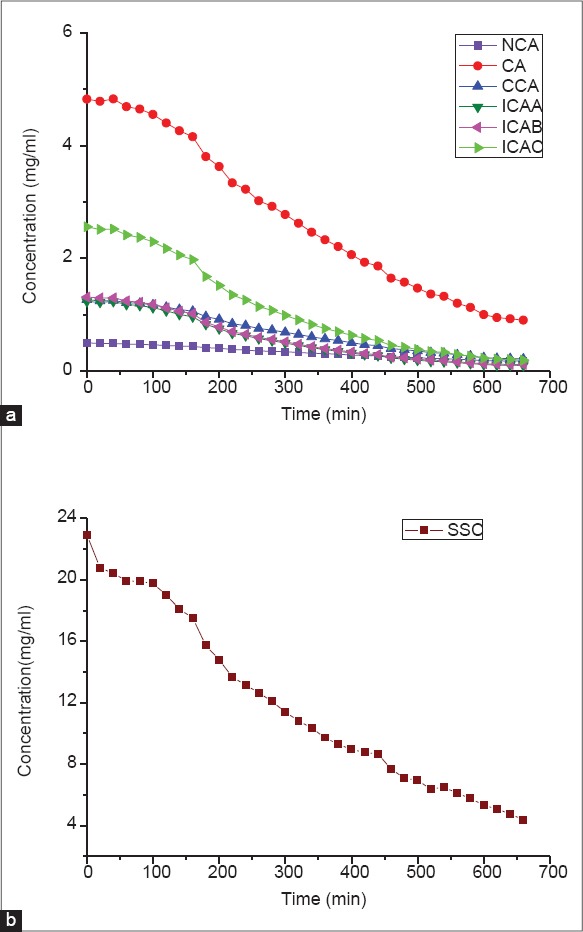
Time evolution curves of phenolic acids (a) and soluble solid content (b) of batch 140110 during liquid-liquid extraction of JQ
Selecting spectral sub-range
In general, peak assignment to specific chemical groups with accuracy is difficult since NIR spectra are combinations of stretching and deformation vibration of hydrogen bonds,[28] but the bands of interest for analytes could be identified in NIR spectroscopy. The collected original spectra are depicted in Figure 4. The absorbance values at 1950–2300 nm were higher than 1.5, belonging to saturated absorbance, so this region was not recommended for building NIR models.[29] The basic functional groups of caffeoylquinic acids are carbonyl, hydroxyl and carboxyl groups. The band around 1167 nm is caused by the C-H stretching 2nd overtone of CH3 and -CH2- groups, and those around 1391 nm and 1413 nm are caused by the 2C-H stretching and C-H deformation vibration of CH3 and -CH2- groups, respectively.[30] Besides, the peak at 1720 nm is attributed to the asymmetric overtone of the C-H bond.[31] Furthermore, the peak at 1900 nm is assigned to the 2nd overtone of the CO bond.[32] After comparing the combinations of different wavelength ranges, it was found that 1178–1918 nm was optimum with the lowest RMSECV and RMSEC. The same mother nucleus structure of caffeoylquinic acids (NCA, CA, CCA, ICAB, ICAA and ICAC) made their NIR absorption peaks close, so their spectral sub-ranges were identical.
Figure 4.
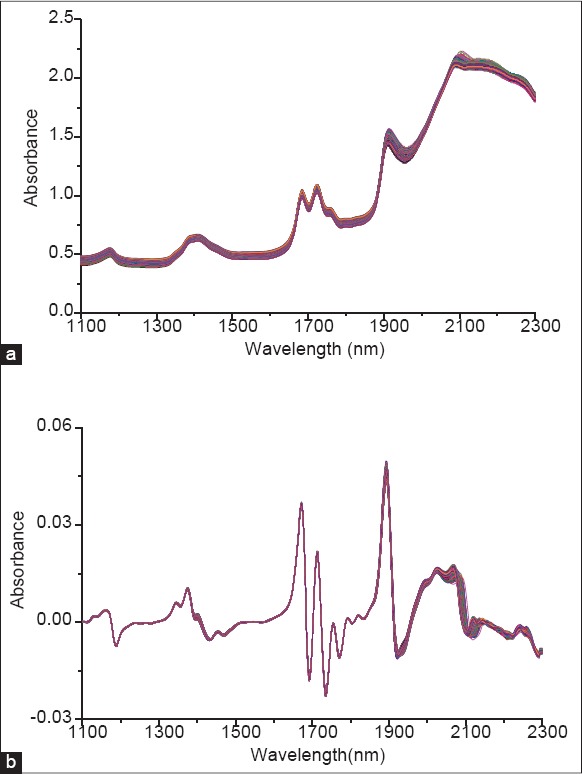
Original near-infrared spectra collected in the liquid-liquid extraction of JQ
Establishing calibration models
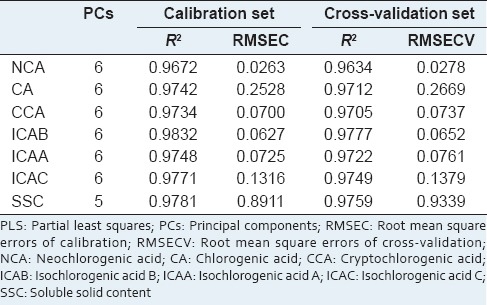
By comparing various spectral pretreatments, the MSC combined with first derivative and Savitzky-Golay smoothing revealed low RMSRC and RMSECV for NCA, CA, CCA, ICAB, ICAA, ICAC and SSC. Before building calibration models, spectral data sets were analyzed through principal component analysis (PCA). The matrix X is decomposed into a few new variables, called principal components (PCs), with the aim to maximize the explained variance in the matrix X.[33,34] Taking NCA as example, X variance was explained by PC1 83% and PC2 8%, matrix Y was explained by PC1 54% and PC2 18%, and six PCs were selected for building the model. Outliers are detected based on the leverage level and the residual of X variance. Taking ICAB as representative, observation 57 had a large residual and a relative small leverage level, indicating it was an outlying observation [Figure 5] and should be removed from the calibration model. After PCA and detecting outliers, the PLS models for NCA, CA, CCA, ICAB, ICAA, ICAC and SSC were established, and the model quality parameters were listed in Table 2.
Figure 5.
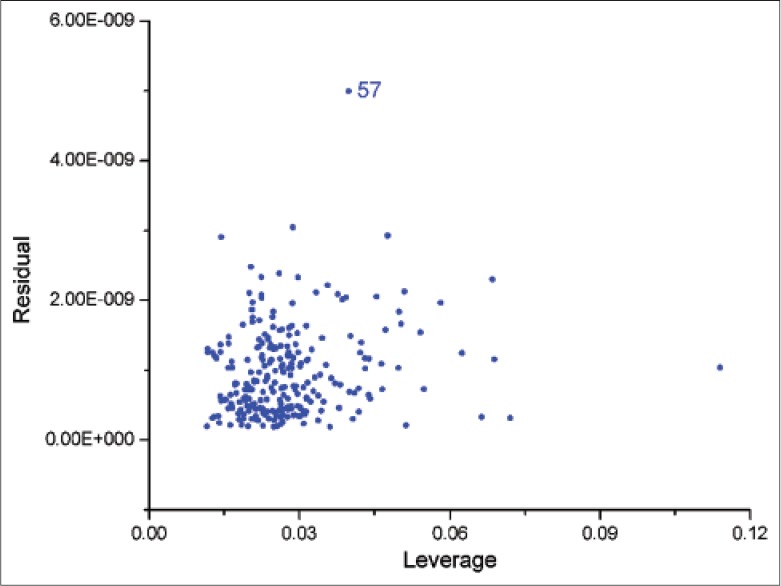
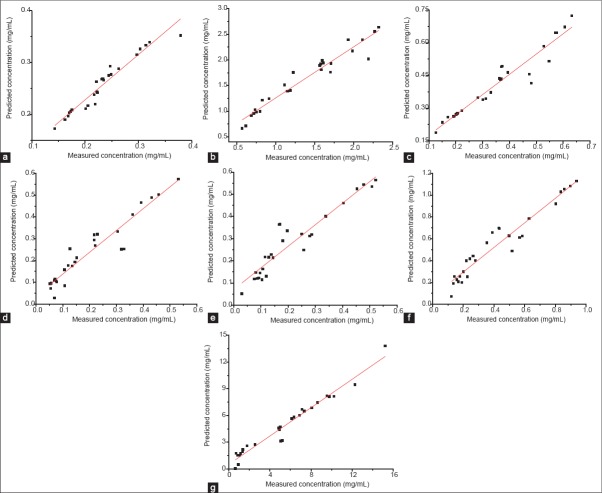
Partial least squares prediction regression equations of neochlorogenic acid (a), chlorogenic acid (b), cryptochlorogenic acid (c), isochlorogenic acid B (d), isochlorogenic acid A (e), isochlorogenic acid C (f) and soluble solid content (g) of batch 140120, scanned by on-line near-infrared and measured by reference assays
Table 2.
Statistics of the optimal PLS models for liquid-liquid extraction of JQ
On-line quantitative monitoring
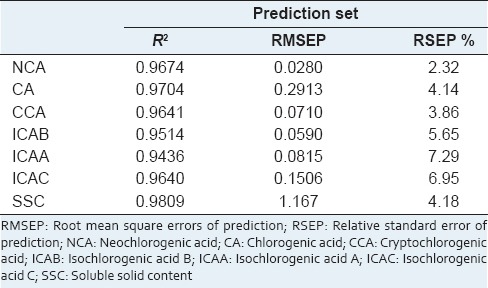
The predictive ability of established PLS models was evaluated on batch 140120. The measured values were compared with the predicted values. The root mean square errors of prediction (RMSEP) and relative standard error of prediction (RSEP) were used to assess the predictive ability [Table 3].
Table 3.
Statistics of the prediction set of the quantitative models
DISCUSSION
As shown in Table 2, the R2 of calibration and cross-validation sets was higher than 0.96 and RMSECV was close to RMSEC. NCA model had the minimum RMSEC and RMSECV, whereas SSC model had the maximum RMSEC and RMSECV. It could be caused by the low content of NCA between 0.10 mg/ml and 0.53 mg/ml, and the high content of SSC ranged from 2.18 mg/ml to 20.76 mg/ml.
In this study, when RSEP is lower than 8%, the predictive accuracy is acceptable for quality control requirements. As seen in Table 3, all the RSEP satisfied the standard, indicating all the models were suitable for industrial application. The RSEP values were sorted in ascending order as follows: NCA, CCA, CA, SSC, ICAB, ICAC and ICAA. Obviously, NCA model with an RSEP value of 2.32% displayed the best predictive ability, although its content was lower than 0.6 mg/ml in the extract solution. However, ICAA model with an RSEP value of 7.29% showed maximum predictive errors, although its high content ranged from 0.1 mg/ml to 1.5 mg/ml. The possible reason is the NIR absorption peaks are more representative of NCA than ICAA, although they have similar chemical structures. The predictive accuracy may be not only associated with the content of analyte, but also depend on the linkage between the chemical structure and the characteristic absorption. And the similar chemical structures probably cause multicollinearity,[35] which brings about the decline of predictive ability.
Figure 6 shows the concentration (content) regression trends predicted by on-line NIR and measured by reference assays. It has to be mentioned that the curves of NCA, CA, CCA and SSC showed good linear relationship and small deviations between measured values and predicted values. However, the curves of ICAB, ICAA and ICAC showed high predictive errors, which were consistent with the high RSEP values in Table 3. Overall, the predictive ability of NCA, CA, CCA models were slightly better than that of ICAB, ICAA and ICAC models.
Figure 6.
Partial least squares prediction regression equations of neochlorogenic acid (a), chlorogenic acid (b), cryptochlorogenic acid (c), isochlorogenic acid B (d), isochlorogenic acid A (e), isochlorogenic acid C (f) and soluble solid content (g) of batch 140120, scanned by in-line near-infrared and measured by reference assays
CONCLUSION
A NIR spectroscopy method was developed to monitor liquid-liquid extraction of JQ by predicting the content of NCA, CA, CCA, ICAB, ICAA, ICAC and SSC. The low RMSEP, RSEP and high R2 confirmed the established models had good predictive performance in real-time quality control. Based on this study, NIR spectroscopy could be extended to be applied in liquid-liquid extraction of TCM, ensuring rapid monitoring of batch production process and minimizing the batch-to-batch fluctuations.
ACKNOWLEDGMENTS
We gratefully acknowledge financial support provided by the National Science and Technology Major Project “Key New Drug Creation and Manufacturing Program” (Grant nos. 2013ZX09402203).
Footnotes
Source of Support: We gratefully acknowledge financial support provided by the National Science and Technology Major Project “Key New Drug Creation and Manufacturing Program” (Grant nos.2013ZX09402203).
Conflict of Interest: None declared.
REFERENCES
- 1.Shang X, Pan H, Li M, Miao X, Ding H. Lonicera japonica Thunb.: Ethnopharmacology, phytochemistry and pharmacology of an important traditional Chinese medicine. J Ethnopharmacol. 2011;138:1–21. doi: 10.1016/j.jep.2011.08.016. [DOI] [PMC free article] [PubMed] [Google Scholar]
- 2.Tae J, Han SW, Yoo JY, Kim JA, Kang OH, Baek OS, et al. Anti-inflammatory effect of Lonicera japonica in proteinase-activated receptor 2-mediated paw edema. Clin Chim Acta. 2003;330:165–71. doi: 10.1016/s0009-8981(03)00017-2. [DOI] [PubMed] [Google Scholar]
- 3.Bilia AR, Santomauro F, Sacco C, Bergonzi MC, Donato R. Essential oil of Artemisia annua L.: An extraordinary component with numerous antimicrobial properties. Evid Based Complement Alternat Med 2014. 2014 doi: 10.1155/2014/159819. 159819. [DOI] [PMC free article] [PubMed] [Google Scholar]
- 4.Poiata A, Tuchilus C, Ivanescu B, Ionescu A, Lazar MI. Antibacterial activity of some Artemisia species extract. Rev Med Chir Soc Med Nat Iasi. 2009;113:911–4. [PubMed] [Google Scholar]
- 5.Khooshechin S, Safdari J, Moosavian MA, Mallah MH. Prediction of pressure drop in liquid – Liquid pulsed packed extraction countercurrent columns. Int J Heat Fluid Flow. 2013;44:684–91. [Google Scholar]
- 6.Gong X, Wang S, Qu H. Comparison of two separation technologies applied in the manufacture of botanical injections: Second ethanol precipitation and solvent extraction. Ind Eng Chem Res. 2011;50:7542–8. [Google Scholar]
- 7.Rathore AS, Bhambure R, Ghare V. Process analytical technology (PAT) for biopharmaceutical products. Anal Bioanal Chem. 2010;398:137–54. doi: 10.1007/s00216-010-3781-x. [DOI] [PubMed] [Google Scholar]
- 8.Yang H, Liu L, Gao W, Liu K, Qi LW, Li P. Direct and comprehensive analysis of ginsenosides and diterpene alkaloids in Shenfu injection by combinatory liquid chromatography-mass spectrometric techniques. J Pharm Biomed Anal. 2014;92:13–21. doi: 10.1016/j.jpba.2013.12.041. [DOI] [PubMed] [Google Scholar]
- 9.Liu X, Wu Z, Yang K, Ding H, Wu Y. Quantitative analysis combined with chromatographic fingerprint for comprehensive evaluation of Danhong injection using HPLC-DAD. J Pharm Biomed Anal. 2013;76:70–4. doi: 10.1016/j.jpba.2012.12.013. [DOI] [PubMed] [Google Scholar]
- 10.Nùñez-Vergara LJ, Squella JA, Sturm JC, Baez H, Camargo C. Simultaneous determination of melatonin and pyridoxine in tablets by gas chromatography-mass spectrometry. J Pharm Biomed Anal. 2001;26:929–38. doi: 10.1016/s0731-7085(01)00447-2. [DOI] [PubMed] [Google Scholar]
- 11.Yang W, Sun H, Zheng LH, Zhang Y, Li MZ. Grey analysis of NIR spectra and prediction of nitrogen content in jujube leaves. Guang Pu Xue Yu Guang Pu Fen Xi. 2013;33:3083–7. [PubMed] [Google Scholar]
- 12.Barnaba FE, Bellincontro A, Mencarelli F. Portable NIR-AOTF spectroscopy combined with winery FTIR spectroscopy for an easy, rapid, in-field monitoring of Sangiovese grape quality. J Sci Food Agric. 2014;94:1071–7. doi: 10.1002/jsfa.6391. [DOI] [PubMed] [Google Scholar]
- 13.Parpinello GP, Nunziatini G, Rombolà AD, Gottardi F, Versari A. Relationship between sensory and NIR spectroscopy in consumer preference of table grape (Cv Italia) Postharvest Biol Technol. 2013;83:47–53. [Google Scholar]
- 14.Lutz OM, Bonn GK, Rode BM, Huck CW. Reproducible quantification of ethanol in gasoline via a customized mobile near-infrared spectrometer. Anal Chim Acta. 2014;15(826):61–8. doi: 10.1016/j.aca.2014.04.002. [DOI] [PubMed] [Google Scholar]
- 15.Shinzawa H, Kanematsu W, Noda I. Rheo-opticalnear-infrared (NIR) spectroscopy study of low-density polyethylene (Ldpe) in conjunction with projection two-dimensional (2d) correlation analysis. Vib Spectrosc. 2014;70:53–7. [Google Scholar]
- 16.Rosas JG, de Waard H, De Beer T, Vervaet C, Remon JP, Hinrichs WL, et al. NIR spectroscopy for the in-line monitoring of a multicomponent formulation during the entire freeze-drying process. J Pharm Biomed Anal. 2014;97:39–46. doi: 10.1016/j.jpba.2014.04.010. [DOI] [PubMed] [Google Scholar]
- 17.Rigoni L, Venti S, Bevilacqua M, Bucci R, Magrì AD, Magrì AL, et al. Quantification of the enantiomeric excess of two apis by means of near infrared spectroscopy and chemometrics. Chemometr Intell Lab Syst. 2014;133:149–56. [Google Scholar]
- 18.Kauppinen A, Toiviainen M, Korhonen O, Aaltonen J, Järvinen K, Paaso J, et al. In-line multipoint near-infrared spectroscopy for moisture content quantification during freeze-drying. Anal Chem. 2013;85:2377–84. doi: 10.1021/ac303403p. [DOI] [PubMed] [Google Scholar]
- 19.Jin Y, Ding H, Liu X, Wan X, Luan L, Wu Y. Investigation of an on-line detection method combining near infrared spectroscopy with local partial least squares regression for the elution process of sodium aescinate. Spectrochim Acta A Mol Biomol Spectrosc. 2013;109:68–78. doi: 10.1016/j.saa.2013.02.014. [DOI] [PubMed] [Google Scholar]
- 20.Xu B, Wu Z, Lin Z, Sui C, Shi X, Qiao Y. NIR analysis for batch process of ethanol precipitation coupled with a new calibration model updating strategy. Anal Chim Acta. 2012;720:22–8. doi: 10.1016/j.aca.2012.01.022. [DOI] [PubMed] [Google Scholar]
- 21.Wu Z, Xu B, Du M, Sui C, Shi X, Qiao Y. Validation of a NIR quantification method for the determination of chlorogenic acid in Lonicera japonica solution in ethanol precipitation process. J Pharm Biomed Anal. 2012;62:1–6. doi: 10.1016/j.jpba.2011.12.005. [DOI] [PubMed] [Google Scholar]
- 22.Jin Y, Wu Z, Liu X, Wu Y. Near infrared spectroscopy in combination with chemometrics as a process analytical technology (PAT) tool for on-line quantitative monitoring of alcohol precipitation. J Pharm Biomed Anal. 2013;77:32–9. doi: 10.1016/j.jpba.2013.01.012. [DOI] [PubMed] [Google Scholar]
- 23.Chang YX, Liu J, Bai Y, Li J, Liu EW, He J, et al. The activity-integrated method for quality assessment of reduning injection by on-line DPPH-CE-DAD. PLoS One. 2014;9:e106254. doi: 10.1371/journal.pone.0106254. [DOI] [PMC free article] [PubMed] [Google Scholar]
- 24.Xiong H, Gong X, Qu H. Monitoring batch-to-batch reproducibility of liquid-liquid extraction process using in-line near-infrared spectroscopy combined with multivariate analysis. J Pharm Biomed Anal. 2012;70:178–87. doi: 10.1016/j.jpba.2012.06.028. [DOI] [PubMed] [Google Scholar]
- 25.Alvarenga L, Ferreira D, Altekruse D, Menezes JC, Lochmann D. Tablet identification using near-infrared spectroscopy (NIRS) for pharmaceutical quality control. J Pharm Biomed Anal. 2008;48:62–9. doi: 10.1016/j.jpba.2008.05.007. [DOI] [PubMed] [Google Scholar]
- 26.Järvinen K, Hoehe W, Järvinen M, Poutiainen S, Juuti M, Borchert S. In-line monitoring of the drug content of powder mixtures and tablets by near-infrared spectroscopy during the continuous direct compression tableting process. Eur J Pharm Sci. 2013;48:680–8. doi: 10.1016/j.ejps.2012.12.032. [DOI] [PubMed] [Google Scholar]
- 27.Dong Q, Zang H, Liu A, Yang G, Sun C, Sui L, et al. Determination of molecular weight of hyaluronic acid by near-infrared spectroscopy. J Pharm Biomed Anal. 2010;53:274–8. doi: 10.1016/j.jpba.2010.05.031. [DOI] [PubMed] [Google Scholar]
- 28.Zou X, Zhao J, Mao H, Shi J, Yin X, Li Y. Genetic algorithm interval partial least squares regression combined successive projections algorithm for variable selection in near-infrared quantitative analysis of pigment in cucumber leaves. Appl Spectrosc. 2010;64:786–94. doi: 10.1366/000370210791666246. [DOI] [PubMed] [Google Scholar]
- 29.Jin Y, Yang K, Wu Y, Liu X, Chen Y. Application of particle swarm optimization based least square support vector machine in quantitative analysis of extraction solution of safflower using near-infrared spectroscopy. Chin J Anal Chem. 2012;40:925–31. [Google Scholar]
- 30.Schaefer C, Lecomte C, Clicq D, Merschaert A, Norrant E, Fotiadu F. on-line near infrared spectroscopy as a Process Analytical Technology (PAT) tool to control an industrial seeded API crystallization. J Pharm Biomed Anal. 2013;83:194–201. doi: 10.1016/j.jpba.2013.05.015. [DOI] [PubMed] [Google Scholar]
- 31.Li J, Jiang Y, Fan Q, Chen Y, Wu R. Simultaneous determination of the impurity and radial tensile strength of reduced glutathione tablets by a high selective NIR-PLS method. Spectrochim Acta A Mol Biomol Spectrosc. 2014;125:278–84. doi: 10.1016/j.saa.2014.01.097. [DOI] [PubMed] [Google Scholar]
- 32.Li W, Cheng Z, Wang Y, Qu H. A study on the use of near-infrared spectroscopy for the rapid quantification of major compounds in Tanreqing injection. Spectrochim Acta A Mol Biomol Spectrosc. 2013;101:1–7. doi: 10.1016/j.saa.2012.09.044. [DOI] [PubMed] [Google Scholar]
- 33.Carey RN, Wold S, Westgard JO. Principal component analysis: An alternative to “referee” methods in method comparison studies. Anal Chem. 1975;47:1824–9. doi: 10.1021/ac60361a037. [DOI] [PubMed] [Google Scholar]
- 34.Luna AS, da Silva AP, Pinho JS, Ferré J, Boqué R. Rapid characterization of transgenic and non-transgenic soybean oils by chemometric methods using NIR spectroscopy. Spectrochim Acta A Mol Biomol Spectrosc. 2013;100:115–9. doi: 10.1016/j.saa.2012.02.085. [DOI] [PubMed] [Google Scholar]
- 35.Slinker BK, Glantz SA. Multiple regression for physiological data analysis: The problem of multicollinearity. Am J Physiol. 1985;249:R1–12. doi: 10.1152/ajpregu.1985.249.1.R1. [DOI] [PubMed] [Google Scholar]


