

Abstract
2-deoxyglucose (2-DG), an analog of glucose, is widely used to interfere with the glycolysis in tumor cells and studied as a therapeutic approach in clinical trials. To evaluate the pharmacokinetics of 2-DG, we describe the development and validation of a sensitive HPLC fluorescent method for the quantitation of 2-DG in plasma. Plasma samples were deproteinized with methanol and the supernatant was dried at 45°C. The residues were dissolved in methanolic sodium acetate/boric acid solution. 2-DG and other monosaccharides were derivatized to 2-aminobenzoic acid derivatives in a single step in the presence of sodium cyanoborohydride at 80°C for 45min. The analytes were separated on a YMC ODS C18 reversed-phase column using gradient elution. The excitation and emission wavelengths were set at 360 and 425nm. The 2-DG calibration curves were linear over the range of 0.63 to 300μg/mL with the limit of detection of 0.5μg/mL. The assay provided satisfactory intra-day and inter-day precision with RSD less than 9.8% and the accuracy ranged from 86.8% to 110.0%. The HPLC method is reproducible and suitable for the quantitation of 2-DG in plasma. The method was successfully applied to characterize the pharmacokinetics profile of 2-DG in patients with advanced solid tumors.
Keywords: 2-Deoxyglucose, HPLC, Fluorescence derivatization, Pharmacokinetics
Introduction
The dependence of tumor cells on glycolysis has provided a basis for functional imaging of tumors by positron emission tomography using an analog of 2-deoxyglucose (2-DG) (Cremerius et al., 1999; Scott et al., 1994). More recently, therapeutic doses of 2-DG has been studied as a potentially useful agent for cancer therapy by our group and others (DiPaola et al., 2008; Hsu et al., 2008; Mohanti et al., 1996; Singh et al., 2005; Stein et al., 2010). In vitro and animal studies of 2-DG demonstrate anti-tumor activity against a variety of tumors (Aft et al., 2002; Kern et al., 1987; Liu et al., 2001; Maher et al., 2004; Maschek et al., 2004; Zhang et al., 2006; Zhu et al., 2005). 2-DG is currently being explored as an agent to enhance the therapeutic effect (Aft et al., 2003; Maschek et al., 2004; Mohanti et al., 1996; Simons et al., 2007). The biochemical basis of antitumor action of 2-DG is believed to be the high dependence of malignant cells on glycolysis. 2-DG is rapidly taken up and retained by tumor cells and blocks glucose metabolic pathways.
There are several reports in the literature for quantitation of 2-DG including gas chromatography (GC) (Blough et al., 1979), high-performance anion exchange chromatography- pulsed amperometric detection (HPAEC-PAD) (Casabuono et al., 2005; Hanko et al., 2000), HPLC (Hughes, 1985), and radioisotopic detection (Furler et al., 1988). The conventional HPLC-ultraviolet (HPLC-UV) detection method for quantitative analysis of monosaccharides is limited due to the lack of chromophores on the sugar molecules, resulting in poor sensitivity and specificity at ultraviolet absorption detection. Thus, HPLC-UV method is not the method of choice when the analytes are to be quantitated in submicrogram quantities in biologics. Therefore, highly sensitive and reproducible pre-column and post-column fluorescence derivatization methods were developed for the quantitation of mono and oligosaccharides in biologics (Anumula, 1994; Kakita et al., 2002; Umegae et al., 1990). For 2-DG quantitation in biological samples, Umegae et al. reported a method for post column fluorescent derivatization by reaction with meso-1, 2-bis (4-methoxyphenyl)ethylene-diamine in an alkaline medium after separation on a strong anion exchange column (Umegae et al., 1990). Other methods for analyzing the presence of 3H-2-DG in rat muscle using ion exchange chromatography has been reported (Wallis et al., 2002); however, the method is only useful for radiolabeled 2-DG. Thus far, no pre-column derivatization HPLC method has been developed for quantitative analysis of 2-DG in plasma. The aim of this study was to develop and validate a simple HPLC method for the measurement of 2-DG in plasma and we describe here a validated pre-column derivatization HPLC method for the quantitation of 2-DG in human plasma for clinical pharmacokinetic evaluation.
Experimental
Materials
2-deoxy-D-glucose, D- (+)-glucose, D- (+)-glucosamine hydrochloride, D- (+)-mannose, D- (−)-arabinose, fructose, anthranilic acid (2-aminobenzoic acid), sodium cyanoborohydride (NaBH3CN), sodium acetate trihydrate, 1-butylamine, tetrahydrofuran were purchased from Sigma-Aldrich Co. (St Louis, Missouri, USA). Boric acid and HPLC grade solvents were purchased from Fisher Scientific Inc. (Fair Lawn, New Jersey, USA).
Preparation of stock and working standard solutions
The stock 2-DG solution (1mg/mL) was prepared in MilliQ deionized water. The calibration standards in control plasma were prepared from stock 2-DG solution by serial dilution at concentrations ranging from 300 to 0.5μg/mL. D- (+)-glucosamine hydrochloride (100μg/mL in water) was used as internal standard (IS). The standards and the internal standard solutions and the patient plasma samples were stored in polypropylene tubes at −80°C and thawed on the day of analysis.
Sample preparation and fluorescent labeling
Each of the plasma standards and patient plasma samples (100 μL) were transferred to1.5 mL polypropylene microfuge tubes and spiked with 10 μL IS solution. To each sample 500 μL of methanol was added and vortexed for 30 sec. The samples were centrifuged at 13000×g for 10min at 4°C. The resulting supernatant was transferred to 1.5 mL microfuge tubes and air-dried at 45 °C. The monosaccharides in the plasma including 2-DG were derivatized. Briefly a methanolic 4% sodium acetate trihydrate and 2% boric acid was prepared as derivative reaction solution. The standard and the sample residues were dissolved in 100 μL of derivative reaction solution and derivatized to reductive amino-fluorescent derivatives, using 100 μL derivative reagent (3% anthranilic acid and 2% sodium cyanoborohydride in derivatization reaction solution). The tubes were tightly closed and heated at 80°C for 45 min. The samples were cooled and centrifuged at 13,000×g for 5 min. To reduce over-loading of the column with derivative reagent, and to achieve better chromatographic separation, the samples were diluted (10 times) with mobile phase A. Throughout the study 25 μL of the sample was analyzed using HPLC fluorescent detector.
Chromatographic conditions
Quantitation of 2-DG was performed using high performance liquid chromatographic system (Hitachi, Tokyo, Japan) equipped with an L-7100 pump, L-7200 autosampler, and L-7480 fluorescence detector with excitation and emission wavelengths set at 360nm and 425 nm respectively. The separations were performed using YMC ODS (AQ) reversed-phase column (150×4.6 mm, 5micron), with C18 guard column (Waters Corp., Milford, MA, USA). The samples were analyzed following LC conditions: mobile phase A: 0.2% 1-butylamine, 0.5% phosphoric acid, and 1% tetrahydrofuran (inhibited) in water; mobile phase B: equal parts of mobile phase A and acetonitrile. The flow rate was 1.0mL/min with gradient elution (Table 1), and the retention times of 2-DG and internal standard were 18.9min and 8.9min, respectively. Standard curves were constructed by plotting the peak height ratio of 2-DG to internal standard against 2-DG concentrations with weighting factor 1/x.
Table 1.
Mobile phase gradient for 2-DG analysis. Mobile phase A: 0.2% 1-butylamine, 0.5% phosphoric acid, and 1% tetrahydrofuran (inhibited) in water; Mobile phase B: Equal parts of mobile phase A and acetonitrile.
| Time (min) | Mobile phase A (%) | Mobile phase B (%) |
|---|---|---|
| 0 | 95 | 5 |
| 7 | 95 | 5 |
| 28 | 87 | 13 |
| 30 | 0 | 100 |
| 40 | 0 | 100 |
| 50 | 95 | 5 |
| 60 | 95 | 5 |
Method validation
The chromatographic run for each sample was about 60 min and this limited the number of samples to be analyzed for each day. Therefore, it was essential to determine the stability of the fluorescent derivative of 2-DG and internal standard at room temperature. Calibration standards (25 μg/mL, 50 μg/mL) were derivatized following the procedure, an aliquot was taken and analyzed immediately and the samples were tightly closed and left on the bench top. After 48 and 72 hours a similar aliquot was taken and analyzed to determine the stability of the fluorescent derivatives of 2-DG and glucosamine (IS).
For method validation, three concentrations of 2-DG were prepared in the control plasma and replicate samples were prepared on the same day for intraday and continuous days for interday accuracy and precision following FDA guidelines (Shah et al., 1992). The measured concentrations were calculated using the standard calibration curve. The precision of the assay was calculated at each concentration and expressed as the relative standard deviation (% coefficient of variation). The accuracy of the quality control (0.625, 2.5, 10 and 50μg/mL) samples were compared between the measured value and nominal concentration of analyte in the plasma. The acceptance criteria for lowest limit of detection was S/N>3. The recovery of 2-DG and IS in plasma was also measured at different concentrations with comparison in water. The short term and long term stability of 2-DG in plasma was performed at three concentrations as per the FDA guidelines subjecting the samples at room temperature (~23°C) for 4hr and −80°C for 1 month followed by quantitation of 2-DG using the analytical method. The three cycles freeze-thaw stability was also tested at room temperature over bench top, not protected from light using control plasma spiked with known amount of 2, 20 and 200 μg/mL of 2-DG. The analyte was considered to be stable in plasma when 85%~ 115% of the initial concentration was found.
Pharmacokinetic study of 2-DG
The validated method was applied to an Institutional Review Board approved Phase I clinical protocol to analyze the 2-DG in plasma samples of patients with advanced solid tumors and hormone refractory prostate cancer. 11 patients were enrolled in this trial. 2-DG was administered daily for 2 weeks of an every 3 weeks cycle and was escalated from 30 to 60 mg/kg. Blood samples were collected in heparinized tubes at predose and at 1, 2, 3, 4, 5, 6, and at 24 hours following 2-DG administration on day 1 of cycle 1, and on day 1 of cycle 2. The samples were collected on ice and centrifuged within 30 min of collection at 1000×g for 10 min at 4°C, and the resulting plasma was separated and stored at −80°C until analysis. In this study, model-independent Non-compartmental analysis (WinNonlin, version 2.1, Pharsight Corp.) was used to estimate the following pharmacokinetic parameters: area under the concentration versus time curve (AUC0–24), elimination half-life (t1/2), total body clearance (CL/F).
Statistical analysis and interpretation
The analytical data are presented as means ± standard deviation. Statistical analysis was performed using Student’s t test, and significance was assigned for p<0.05.
Results and Discussion
Derivatization reaction and chromatographic specificity
In the recent years, several fluorescent tags have been introduced for the analysis of mono and oligosaccharides in biospecimens using pre and post column derivatization followed by HPLC analysis (Hase, 1995). 2-aminobenzoic acid derivatization provides a tool for the analysis of monosaccharides and oligosaccharides with enhanced fluorescence sensitivity (Anumula, 2006). The advantages of pre-column derivatization are the removal of sample matrix, modification of the sample, and the selective enrichment of the derivatives. Figure 1 shows the simplistic fluorescence tagging of 2-DG with 2-amino benzoic acid in the presence of sodium cyanoborohydride. Since fluorescent tagging was crucial for the 2-DG analyses, to optimize derivatization reaction, control plasma samples were spiked with fixed concentration of 2-DG (10μg/mL) and IS (glucosamine) and varied concentrations of 2-amino-benzoic acid and NaBH3CN were added and derivatized according to the method. Under the experimental conditions 2-DG and IS peak heights reached a plateau at 30mg/mL 2-amino-benzoic acid, and 20mg/mL NaBH3CN (data not shown), which was similar to the derivatization condition reported by Anumula (Anumula, 1994). We also optimized the time required for the maximum derivatization. Control plasma spiked with fixed concentration of 2-DG (10 μg/mL) and IS (1 μg/mL) was derivatized at 80°C for 30, 45 and 60 min, the samples were analyzed by HPLC. There was no significant increase of peak height ratio after 30 min and the results showed the reaction was completed in 30 min.
Figure 1.
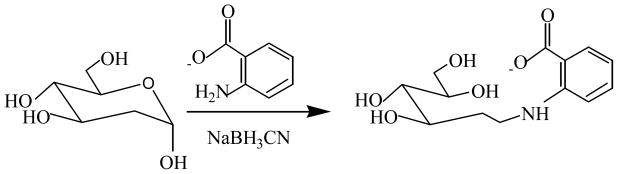
Reductive amination derivatization reaction of 2-deoxyglucose in the presence of sodium cyanoborohydride and 2-aminobenzoic acid
As shown in Figure 2 (D), the chromatographic separation of 2-DG (peak 2) and other monosaccharides had acceptable resolution between D-glucose and fructose (peak 4), mannose (peak 3), arabinose (peak 5) and glucosamine (peak 1) spiked in 10μL control plasma to avoid the huge D-glucose peak overlap in plasma. The retention time of mannose (peak 3) and D-glucose was 20.5min and 22.0min, which were also observed in the control plasma or patient plasma sample. Under chromatographic conditions D-glucose and D-fructose eluted with the same retention time (22 min). However, no interfering peaks at the retention time of 2-DG (18.9 min), and IS (8.9 min) were observed in the control plasma, and in predose patients plasma collected before 2-DG dosing. Figure 2 shows the typical chromatograms of control blank plasma sample (A), control plasma spiked with 2-DG (B), and a patient plasma sample at 3hr after oral 2-DG dose (C).
Figure 2.
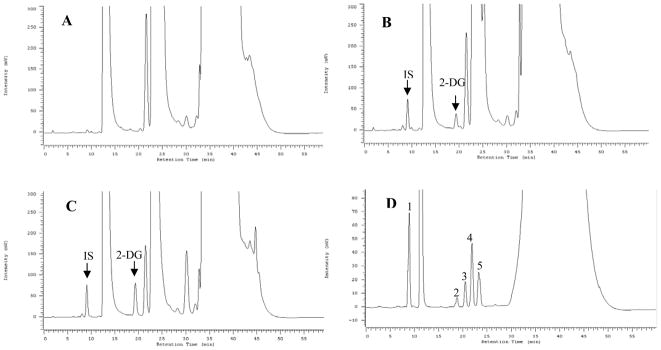
Representative chromatograms of human blank plasma (A), 2-DG (10μg/mL) spiked in blank plasma (B), and a patient plasma sample at 3hr after oral administration of 2-DG (C), different monosaccharide isolation in plasma (D), (1, glucoasamine; 2, 2-DG; 3, mannose; 4, glucose & fructose, 5, arabinose)
Stability of 2-DG
The stability of 2-DG in plasma was investigated under various conditions throughout the validation process and results are shown in Table 2. The criterion of stability was set as percentage within the range of 85% to 110%. The experiments revealed that 2-DG was stable when the plasma samples are stored at −80°C for 1 month, at room temperature for 4hr and after 3 cycles of freeze-thawing at experiment condition.
Table 2.
Stability of 2-DG during sample storage and preparation. (n=4, Mean±SD)
| 2-DG conc. (μg/mL) | Three Freeze- thaw cycles | 30 days, −80°C | 23°C, 4 hr |
|---|---|---|---|
| 200 | 192.6±11.8 | 204.4±11.8 | 198.9±4.0 |
| 20 | 19.0±1.4 | 20.7±2.6 | 19.1±1.0 |
| 2 | 1.82±0.2 | 1.9±0.2 | 2.3±0.2 |
This method was developed for the pharmacokinetic evaluation of 2-DG in patient plasma. The separation of 2-DG from the endogenous sugars and other fluorescent components in the plasma, and the reagents used for the derivatization reaction was crucial, therefore each sample was run for 60 min for the chromatographic separation of 2-DG and the internal standard. Further, we evaluated the stability of aminobenzoic derivatives of 2-DG and IS, by comparing the concentration of 2-DG (25, 50μg/mL) at 48hr, and 72hr post derivatization. The average calculated amount at 48hr and 72 hr was 25.61 and 23.91μg/mL, 50.95 and 49.03μg/mL respectively. It was found that the fluorescent labeled 2-DG and IS were stable at least for 72 hrs at room temperature.
Recovery of 2-DG and IS
The recovery of 2-DG and IS in control plasma at the different concentrations was compared to the same concentration in water (Table 3). The absolute recoveries of 2-DG and IS in plasma were in the range of 74.2% ~ 82.9%. The recovery of 2-DG and internal standard in plasma was only 75% that of 2-DG in water. This difference in the recovery of 2-DG and IS in the plasma could be due to the matrix effect. In order to identify the possible cause of the recovery loss, the matrix post-extraction supernatant (after deprotein) was spiked and derivatized with known concentration of 2-DG and IS. The results showed that no significant difference in the recovery between plasma and the matrix post-extraction of 2-DG and IS, compared with water standards. It can be deduced that the methanol soluble components in the post extraction supernatant could reduce the derivatization reaction to some extend in comparison with water. However, the percent recovery of 2-DG and IS in control plasma at the tested concentration ranges was consistent. When the calibration curve of control plasma was used for the calculation, it would not impact the results. For improving the recovery of 2-DG, small volume of plasma should be used in analysis to avoid the large matrix effect.
Table 3.
Recovery of 2-DG and internal standard in plasma relative to in water (n=3)
| 2-DG conc. nominal (μg/mL) | Recovery (%) Mean ± SD
|
|
|---|---|---|
| 2-DG | IS | |
| 1.0 | 82.9±0.3 | 74.2±0.2 |
| 5.0 | 74.8±0.4 | 74.2±1.3 |
| 50.0 | 78.0±1.5 | 77.2±0.6 |
Linearity, accuracy and precision
Accuracy and precision of HPLC-FL assay were determined by spiking three different concentrations of 2-DG in blank plasma. The HPLC-FL assay showed good linearity ranging from 0.500μg/mL to 300μg/mL (R2=0.9982±0.002, n=4). The intraday and interday precision and accuracy are listed in Table 4. The intraday and interday precision was less than 9.8 % and the accuracy ranged from 86.8% to 110.0%. The 2-DG assay described here was precise and accurate and could be used for the quantitative analysis in human plasma.
Table 4.
Precision and accuracy of 2-DG HPLC assay in plasma (within-run n=3; between-run n=4)
| 2-DG conc. (μg/ml) norminal | Measured (μg/mL) Mean ± SD |
Precision (% R.S.D) | Accuracy (% norminal) | |||
|---|---|---|---|---|---|---|
|
| ||||||
| Intraday | Interday | Intraday | Interday | Intraday | Interday | |
| 0.63 | 0.68±0.03 | 0.69±0.07 | 3.9 | 9.8 | 108.1 | 110.0 |
| 2.5 | 2.2±0.2 | 2.5±0.1 | 9.8 | 3.3 | 86.8 | 98.9 |
| 10.0 | 9.7±0.3 | 9.5±0.2 | 2.8 | 1.9 | 96.9 | 95.1 |
| 50.0 | 49.6±1.0 | 49.9±1.7 | 2.0 | 3.4 | 99.3 | 99.8 |
Quantitation and detection limit
Under the assay conditions the limit of quantitation was 0.63μg/mL and the limit of detection for 2-DG was 0.5μg/mL in plasma. In the assay, to decrease the column loading with excessive derivative reagents and to decrease the baseline interference due to high amount of endogenous glucose in plasma, it was necessary to dilute the samples 10 times before injection into the HPLC system. When the dilution factor was accounted for, the detection limit for 2-DG was about 50ng/mL.
Application of the method
This analytical method was applied to describe the plasma PK of 2-DG in patients with solid malignant tumors treated with 2-DG (Stein et al.). The mean plasma concentration-time plot in different dose levels was shown in Figure 3. Tmax was about 1hr which indicated the quick absorption of 2-DG. Cmax in three cohorts on cycle 1 was 45.4±3.1, 73.7±27.7 and 122.1±47.5μg/mL. The AUC0–24h in was 134.8±38.8, 181.8±35.0 and 282.7±122.0μg/mL×h, respectively, which showed a dose-dependent linear pharmacokinetics. Since the bioavailability of 2-DG is unknown, the clearance was reported as Cl/F, which was estimated to be 232.0±63.8, 243.3±49.4 and 185.0±52.6 mL/h, respectively. The elimination t1/2 was 4.5±0.6, 7.3±1.6, 5.2±1.6hr in three dose levels.
Figure 3.

Mean plasma 2-DG concentration-time plot in different dose levels
Conclusions
This study describes a simple and sensitive HPLC assay with precolumn fluorescent derivatization for quantitation of 2-DG in plasma. The method was developed using 100μL of human plasma for 2-DG determination with lower limit of quantitation (0.63μg/mL). This validated HPLC assay is suitable for the quantitation of 2-DG in plasma and for the evaluation of plasma 2-DG pharmacokinetics in patients.
Acknowledgments
The authors gratefully acknowledge Department of Defense grant # W81XW8-05-1-0036 and the Cancer Institute of New Jersey for NCI Cancer Center Support. Grant P30CA072720.
References
- Aft RL, Lewis JS, Zhang F, Kim J, Welch MJ. Enhancing targeted radiotherapy by copper(II)diacetyl- bis(N4-methylthiosemicarbazone) using 2-deoxy-D-glucose. Cancer Res. 2003;63:5496–5504. [PubMed] [Google Scholar]
- Aft RL, Zhang FW, Gius D. Evaluation of 2-deoxy-D-glucose as a chemotherapeutic agent: mechanism of cell death. Br J Cancer. 2002;7:805–812. doi: 10.1038/sj.bjc.6600547. [DOI] [PMC free article] [PubMed] [Google Scholar]
- Anumula KR. Advances in fluorescence derivatization methods for high-performance liquid chromatographic analysis of glycoprotein carbohydrates. Anal Biochem. 2006;350:1–23. doi: 10.1016/j.ab.2005.09.037. [DOI] [PubMed] [Google Scholar]
- Anumula KR. Quantitative determination of monosaccharides in glycoproteins by high-performance liquid chromatography with highly sensitive fluorescence detection. Anal Biochem. 1994;220:275–283. doi: 10.1006/abio.1994.1338. [DOI] [PubMed] [Google Scholar]
- Blough HA, Giuntoli RL. Successful treatment of human genital herpes infections with 2-deoxy-D-glucose. JAMA. 1979;241:2798–2801. [PubMed] [Google Scholar]
- Casabuono AC, Morion MC, Buchta C, Perego MC, Couto AS. Comparison of micro-enzymatic and high performance anion exchange chromatography methods for the analysis of glucose in human serum. ARKIVOC. 2005;xii:243–252. [Google Scholar]
- Cremerius U, Wildberger JE, Borchers H, Zimny M, Jakse G, Gunther RW, Buell U. Does positron emission tomography using 18-fluoro-2-deoxyglucose improve clinical staging of testicular cancer?--Results of a study in 50 patients. Urology. 1999;54:900–904. doi: 10.1016/s0090-4295(99)00272-1. [DOI] [PubMed] [Google Scholar]
- DiPaola RS, Dvorzhinski D, Thalasila A, Garikapaty V, Doram D, May M, Bray K, Mathew R, Beaudoin B, Karp C, Stein M, Foran DJ, White E. Therapeutic starvation and autophagy in prostate cancer: a new paradigm for targeting metabolism in cancer therapy. Prostate. 2008;68:1743–1752. doi: 10.1002/pros.20837. [DOI] [PMC free article] [PubMed] [Google Scholar]
- Furler SM, Jenkins AB, Kraegen EW. Effect of insulin on [3H]deoxy-D-glucose pharmacokinetics in the rat. Am J Physiol. 1988;255:E806–811. doi: 10.1152/ajpendo.1988.255.6.E806. [DOI] [PubMed] [Google Scholar]
- Hanko VP, Rohrer JS. Determination of carbohydrates, sugar alcohols, and glycols in cell cultures and fermentation broths using high-performance anion-exchange chromatography with pulsed amperometric detection. Anal Biochem. 2000;283:192–199. doi: 10.1006/abio.2000.4653. [DOI] [PubMed] [Google Scholar]
- Hase S. Pre- and Post-column detection-oriented derivatization techniques in HPLC of carbohydrates. In: Rassi ZE, editor. Carbohydrate analysis- High performance liquid chromatography and capillary. Vol. 58. Amesterdam: Elsevier Science B.V; 1995. pp. 555–575. [Google Scholar]
- Hsu PP, Sabatini DM. Cancer cell metabolism: Warburg and beyond. Cell. 2008;134:703–707. doi: 10.1016/j.cell.2008.08.021. [DOI] [PubMed] [Google Scholar]
- Hughes DE. Determination of alpha-2-deoxy-D-glucose in topical formulations by high-performance liquid chromatography with ultraviolet detection. J Chromatogr. 1985;331:183–186. doi: 10.1016/0021-9673(85)80020-0. [DOI] [PubMed] [Google Scholar]
- Kakita H, Kamishima H, Komiya K, Kato Y. Simultaneous analysis of monosaccharides and oligosaccharides by high-performance liquid chromatography with postcolumn fluorescence derivatization. J Chromatogr A. 2002;961:77–82. doi: 10.1016/s0021-9673(02)00655-6. [DOI] [PubMed] [Google Scholar]
- Kern KA, Norton JA. Inhibition of established rat fibrosarcoma growth by the glucose antagonist 2-deoxy-D-glucose. Surgery. 1987;102:380–385. [PubMed] [Google Scholar]
- Liu H, Hu YP, Savaraj N, Priebe W, Lampidis TJ. Hypersensitization of tumor cells to glycolytic inhibitors. Biochemistry. 2001;40:5542–5547. doi: 10.1021/bi002426w. [DOI] [PubMed] [Google Scholar]
- Maher JC, Krishan A, Lampidis TJ. Greater cell cycle inhibition and cytotoxicity induced by 2-deoxy-D-glucose in tumor cells treated under hypoxic vs aerobic conditions. Cancer Chemother Pharmacol. 2004;53:116–122. doi: 10.1007/s00280-003-0724-7. [DOI] [PubMed] [Google Scholar]
- Maschek G, Savaraj N, Priebe W, Braunschweiger P, Hamilton K, Tidmarsh GF, De Young LR, Lampidis TJ. 2-deoxy-D-glucose increases the efficacy of adriamycin and paclitaxel in human osteosarcoma and non-small cell lung cancers in vivo. Cancer Res. 2004;64:31–34. doi: 10.1158/0008-5472.can-03-3294. [DOI] [PubMed] [Google Scholar]
- Mohanti BK, Rath GK, Anantha N, Kannan V, Das BS, Chandramouli BA, Banerjee AK, Das S, Jena A, Ravichandran R, Sahi UP, Kumar R, Kapoor N, Kalia VK, Dwarakanath BS, Jain V. Improving cancer radiotherapy with 2-deoxy-D-glucose: phase I/II clinical trials on human cerebral gliomas. Int J Radiat Oncol Biol Phys. 1996;35:103–111. doi: 10.1016/s0360-3016(96)85017-6. [DOI] [PubMed] [Google Scholar]
- Scott WJ, Schwabe JL, Gupta NC, Dewan NA, Reeb SD, Sugimoto JT. Positron emission tomography of lung tumors and mediastinal lymph nodes using [18F]fluorodeoxyglucose. The Members of the PET-Lung Tumor Study Group. Ann Thorac Surg. 1994;58:698–703. doi: 10.1016/0003-4975(94)90730-7. [DOI] [PubMed] [Google Scholar]
- Shah VP, Midha KK, Dighe S, McGilveray IJ, Skelly JP, Yacobi A, Layloff T, Viswanathan CT, Cook CE, McDowall RD, et al. Analytical methods validation: bioavailability, bioequivalence and pharmacokinetics studies. Conference Report. Pharm Res. 1992;9:588–592. doi: 10.1007/BF03189968. [DOI] [PubMed] [Google Scholar]
- Simons AL, Ahmad IM, Mattson DM, Dornfeld KJ, Spitz DR. 2-Deoxy-D-glucose combined with cisplatin enhances cytotoxicity via metabolic oxidative stress in human head and neck cancer cells. Cancer Res. 2007;67:3364–3370. doi: 10.1158/0008-5472.CAN-06-3717. [DOI] [PMC free article] [PubMed] [Google Scholar]
- Singh D, Banerji AK, Dwarakanath BS, Tripathi RP, Gupta JP, Mathew TL, Ravindranath T, Jain V. Optimizing cancer radiotherapy with 2-deoxy-d-glucose dose escalation studies in patients with glioblastoma multiforme. Strahlenther Onkol. 2005;181:507–514. doi: 10.1007/s00066-005-1320-z. [DOI] [PubMed] [Google Scholar]
- Stein M, Lin H, Jeyamonhan C, Dvorzhinski D, Gounder M, Bray K, Eddy S, Goodin S, White E, DiPaola RS. Targeting tumor metabolism with 2-deoxyglucose in patients with castrate-resistant prostate cancer and advanced malignancies. Prostate. 2010;70:1388–1394. doi: 10.1002/pros.21172. [DOI] [PMC free article] [PubMed] [Google Scholar]
- Umegae Y, Nohta H, Ohkura Y. Simultaneous determination of 2-deoxy-D-glucose and D-glucose in rat serum by high-performance liquid chromatography with post-column fluorescence derivatization. Chem Pharm Bull (Tokyo) 1990;38:963–965. doi: 10.1248/cpb.38.963. [DOI] [PubMed] [Google Scholar]
- Wallis MG, Wheatley CM, Rattigan S, Barrett EJ, Clark AD, Clark MG. Insulin-mediated hemodynamic changes are impaired in muscle of Zucker obese rats. Diabetes. 2002;51:3492–3498. doi: 10.2337/diabetes.51.12.3492. [DOI] [PubMed] [Google Scholar]
- Zhang XD, Deslandes E, Villedieu M, Poulain L, Duval M, Gauduchon P, Schwartz L, Icard P. Effect of 2-deoxy-D-glucose on various malignant cell lines in vitro. Anticancer Res. 2006;26:3561–3566. [PubMed] [Google Scholar]
- Zhu Z, Jiang W, McGinley JN, Thompson HJ. 2-Deoxyglucose as an energy restriction mimetic agent: effects on mammary carcinogenesis and on mammary tumor cell growth in vitro. Cancer Res. 2005;65:7023–7030. doi: 10.1158/0008-5472.CAN-05-0453. [DOI] [PubMed] [Google Scholar]